REVIEW 4 major objections 5 minor 42 references
Global Solar Magnetic-field and Interplanetary Scintillations During the Past Four Solar Cycles
T0 review · 4 major / 5 minor · reviewed 2026-08-14 · deepseek-v4-flash
Pith's one-line read This paper claims that the Sun's global coronal magnetic field, not just its polar fields, declined 11.3–22.2% from the mid-1990s to 2018, with the solar-wind scintillation index falling 23.6% in step.
desk verdict PFSS-coronal decline is a real extension, but the KP-SOLIS magnetograph transition is an unaddressed confounder that could explain the entire result. read the letter →
The pith
A machine-rendered reading of the paper's core claim, the machinery that carries it, and where it could break.
The reading
What carries the argument
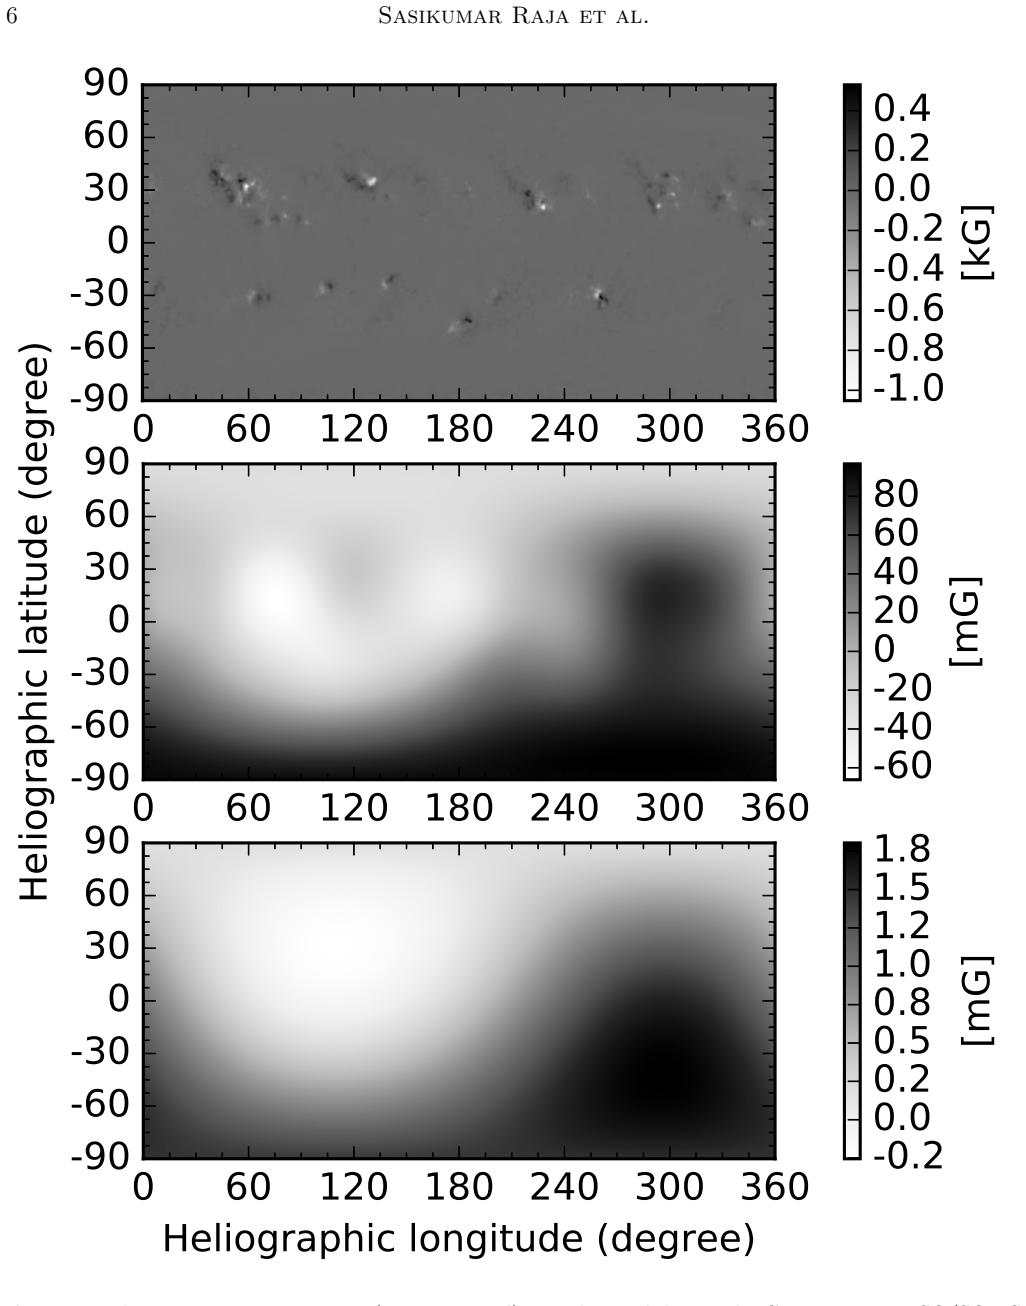
The central machinery is the potential-field source-surface (PFSS) extrapolation, a model that assumes a current-free corona and extrapolates measured photospheric magnetograms outward to a source surface at 2.5 solar radii, then radially to 10 solar radii. The magnetograms come from two instruments covering 1975–2018, and the extrapolated fields are averaged over latitude bands. The other key object is the normalized interplanetary scintillation index, $m$, which is corrected for heliocentric distance and finite source size using theoretical Marians curves and a near-point radio source, so that year-to-year changes reflect genuine solar-wind turbulence rather than observing geometry.
What would settle it
Compare the two magnetograph datasets over the overlapping Carrington rotations around 2003.66; if NSO/SOLIS systematically reads lower than NSO/KP on the same photospheric regions, then part or all of the claimed 11–22% decline could be instrumental rather than solar.
Extended reading notes
Core claim
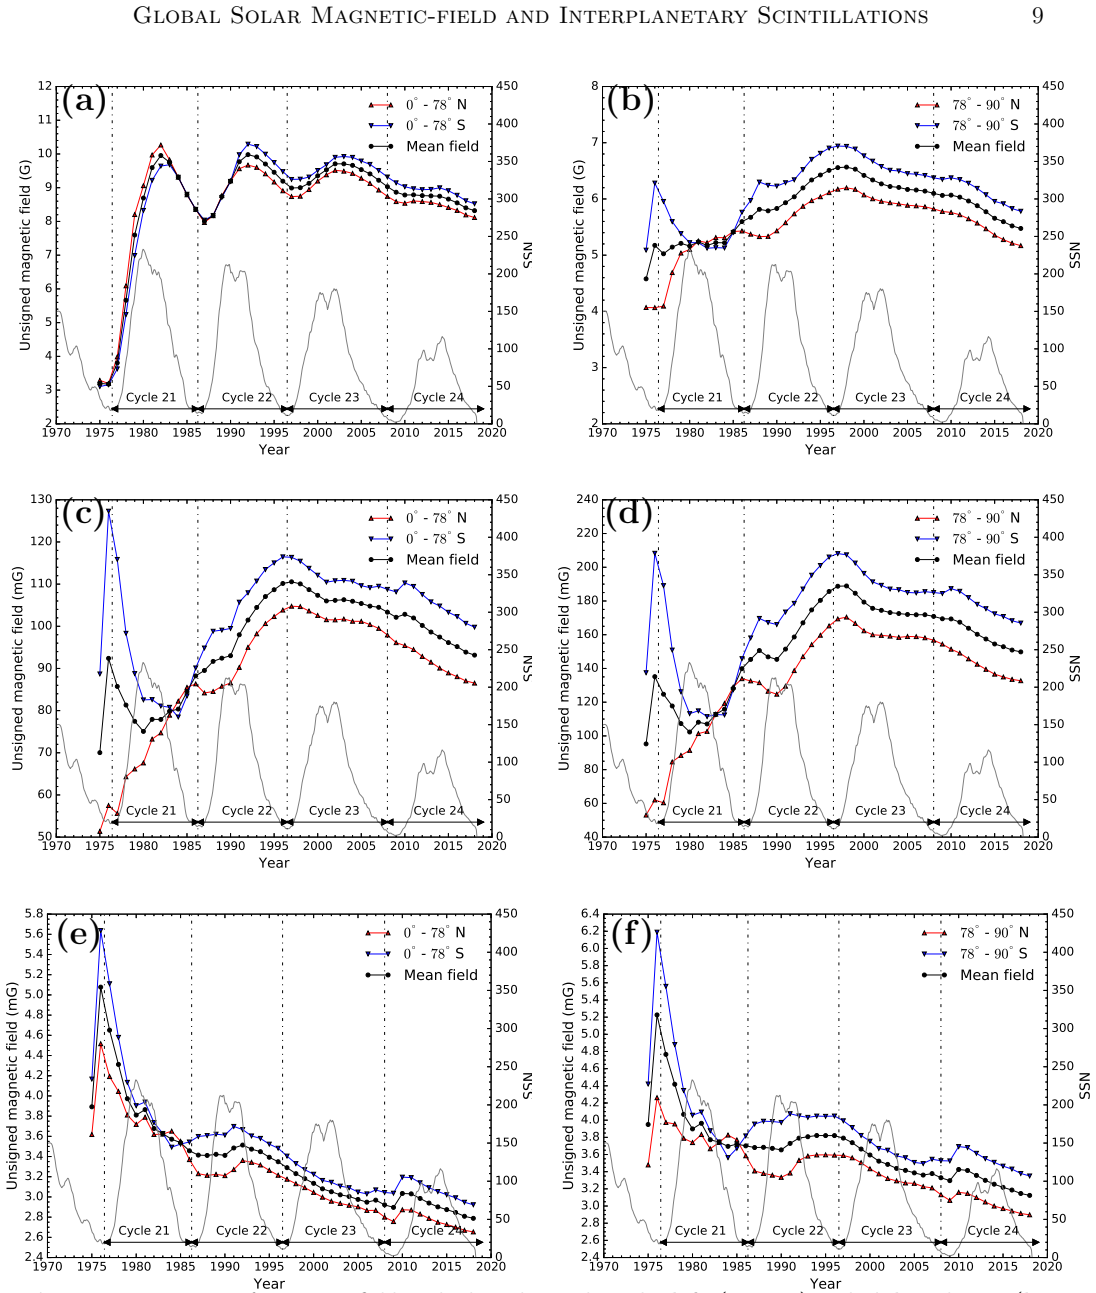
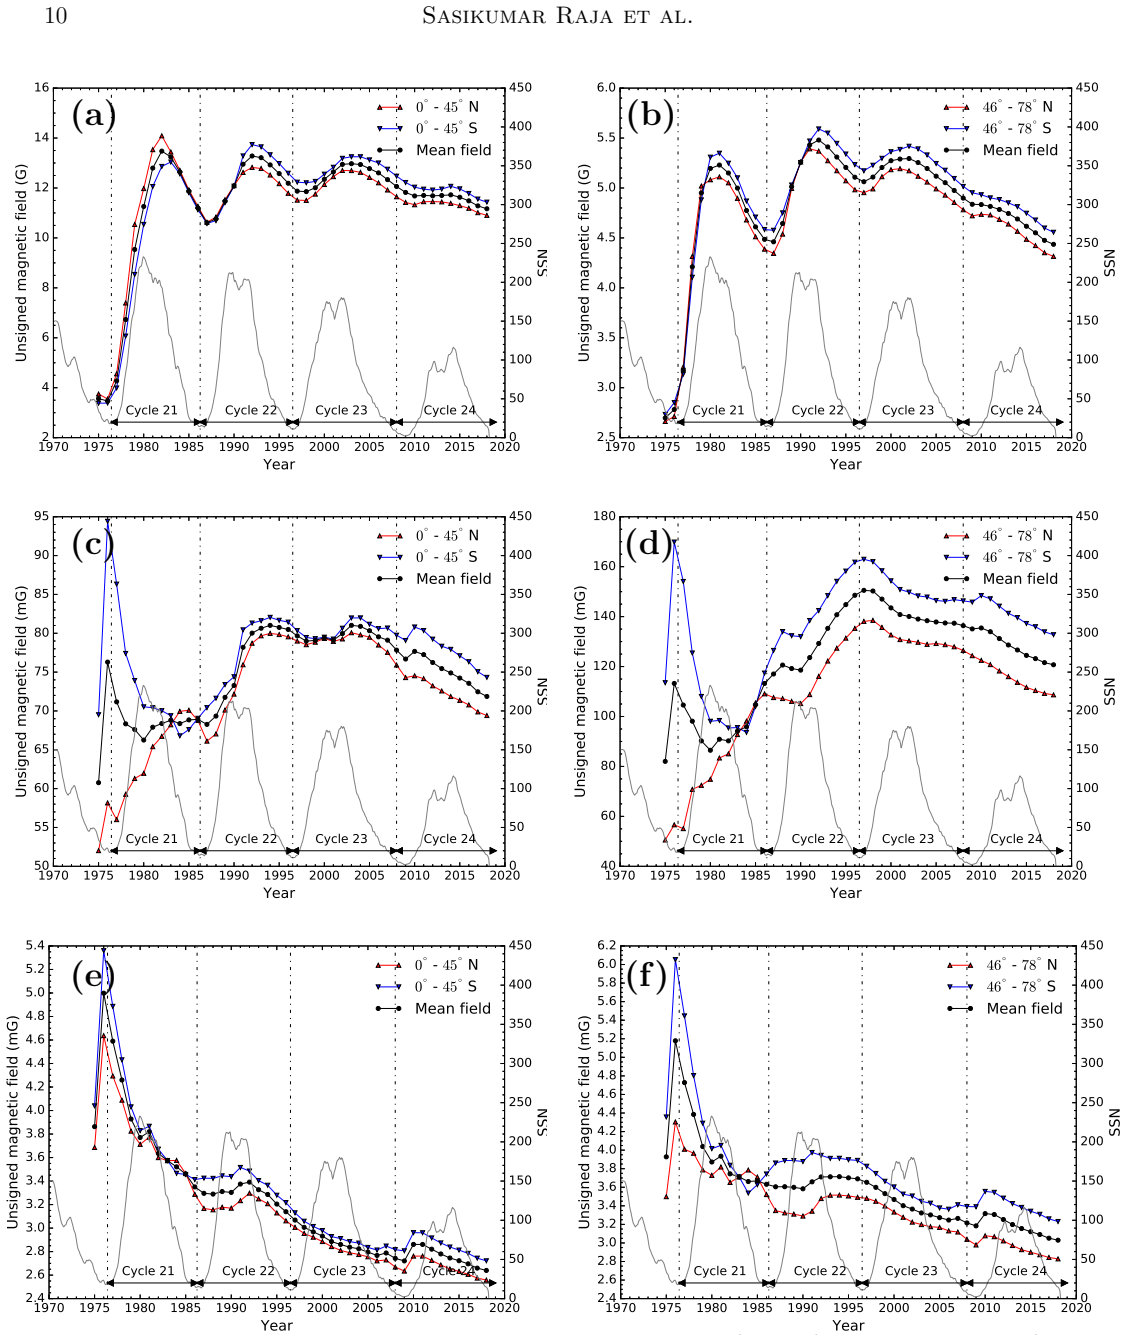
On the paper's own terms, the discovery is that the Sun's global magnetic field at the photosphere, at 2.5 solar radii, and at 10 solar radii has been monotonically declining since the mid-1990s across all latitude bands, from equatorial to polar. The reported decrease is 11.3–22.2% between the mid-1990s and 2018, and this decline is separate from the 5–10% solar-cycle oscillation seen in photospheric fields. In phase with the declining fields, the normalized scintillation index fell by 23.6%, and the peak sunspot number from Solar Cycle 21 to Cycle 24 declined by about 50%. The paper concludes that the global magnetic field is controlling the turbulence characteristics in the solar corona and solar wind.
Load-bearing premise
The time series crosses an instrument change in 2003, from NSO/KP to NSO/SOLIS magnetograms, and the paper treats their field strengths as directly comparable without a cross-calibration, so a systematic offset between the two instruments could create a spurious decline.
Editorial extensions
If this is right
- If the global coronal field keeps declining, Solar Cycle 25 is likely to be another weak cycle, consistent with predictions of a Maunder-like minimum.
- The normalized scintillation index $m$ can serve as a proxy for the strength of the global coronal field, allowing IPS monitoring to track field changes even when magnetogram instruments change.
- The absence of a solar-cycle oscillation in the extrapolated coronal fields implies that sunspot-related variability is largely confined to the photosphere, while the inner-heliospheric field decline is secular.
- The decline is not limited to polar caps, so the entire large-scale solar magnetic field, not just the polar field, is participating in the long-term weakening.
- The relationship between the declining field and $m$ suggests that solar-wind turbulence levels will continue to fall if the field continues to weaken.
Reading between the lines
- The paper does not cross-calibrate the NSO/KP and NSO/SOLIS magnetograms; a systematic offset between these two instruments across their 2003 boundary could account for part of the reported 11–22% decline, so an overlap comparison would test the trend's reality.
- If the decline is real, reduced solar-wind turbulence should also weaken the scattering of energetic particles, which could lead to measurable changes in cosmic-ray modulation during solar minima.
- Applying the same PFSS pipeline to independent magnetogram datasets from other observatories would show whether the monotonic decline is a solar feature or an artifact of a single instrument series.
- A sensitivity analysis varying the assumed point-source calibrator and Marians curve fits would reveal whether the 23.6% drop in $m$ is robust to the normalization choices.
Signed reviews
Editorial analysis
A structured set of objections, weighed in public.
Referee Report
Summary. The paper combines NSO/KP and NSO/SOLIS synoptic magnetograms (1975–2018) with PFSS extrapolations to compute latitude-averaged unsigned magnetic fields at the photosphere, 2.5 R_sun, and 10 R_sun, and compares these with the normalized interplanetary scintillation index m from ISEE observations (1983–2017). The central claim is that the global coronal magnetic field has declined by 11.3–22.2% since the mid-1990s at 2.5 and 10 R_sun, and that m declined by 23.6% in phase with this decline, supporting the idea that the Sun is entering a prolonged quiet state.
Significance. If the result holds, it extends the previously reported polar-field decline to the global coronal field and links it to a measurable solar-wind turbulence parameter, which is relevant for solar-cycle prediction and for understanding the Sun's long-term magnetic evolution. The PFSS extrapolations are an independent analysis that does not simply reuse the target conclusion as an input, and the IPS normalization procedure is documented in enough detail to be checked. The main value is the multi-decade baseline and the attempt to connect photospheric, coronal, and solar-wind observables over four cycles.
major comments (4)
- [§2.1, Table 1, Figures 3–4] The claimed 11.3–22.2% decline spans an instrument transition without any cross-calibration. The time series uses NSO/KP magnetograms through CR2006 (2003.66) and NSO/SOLIS thereafter, and Table 1 compares KP-era annual means (1992–1997) with a SOLIS-era value (2018). Because the PFSS model is linear in the photospheric boundary condition, any multiplicative scale offset between KP and SOLIS would propagate directly into the extrapolated fields at 2.5 and 10 R_sun. The manuscript provides no overlap regression, no comparison against an independent calibrated proxy, and no citation to a study establishing the comparability of the two instruments. This is load-bearing because the 'before' and 'after' epochs are entirely on different instruments.
- [§3.1–3.2, Table 1] The magnetic-field measurements have no uncertainties. Figures 3 and 4 show annual-mean curves without error bars, and Table 1 lists epoch means and percentage decrements without any estimate of statistical or systematic error. Given that the reported declines are only 11–22%, the absence of error bars makes it impossible to assess whether the changes are significant relative to intrinsic solar variability or to instrumental noise. The manuscript should provide at least the standard deviation of the Carrington-rotation values within each epoch, or a formal trend fit with confidence intervals.
- [§4, Table 1, column 3] The decline onset epoch ('Year from when the beginning of significant decline') is selected by eye, and it differs across latitude bins and heights (1992, 1993, 1994, 1996, 1997). This makes the percentage decrements in column 7 partly dependent on an arbitrary choice of baseline. A quantitative trend test (e.g., linear or piecewise fit with a changepoint, or a simple correlation with time over a fixed window) is needed to support the claim of a monotonic decline since the mid-1990s and to define the baseline consistently.
- [§3.3, Figure 5] The statement in §3.3 that error bars for m are 'measured separately for the years 1983–2008 and 2009–2017' is problematic because it pre-conditions the analysis on a post-2008 drop, which is part of the claimed decline. This can make the reported 23.6% decrease appear more significant than a uniform error treatment would allow. The authors should justify this choice with a homogeneity test or use a single error model with a break only if statistically supported.
minor comments (5)
- [Figure 1 caption] The caption spells 'magenta' as 'majenta' in two places.
- [§2.2] The phrase 'The current four station network provide the more robust estimates' has a subject-verb agreement error and should read 'provides'.
- [§3.3, Eq. (3)–(4)] The notation ΔS and ⟨S⟩ is used without explicitly stating that these are time-averaged quantities over the observing bandwidth; a brief clarification would help readers unfamiliar with IPS practice.
- [References] The Schatten et al. 1969a and 1969b entries appear to refer to the same paper and the same pages; the authors should check whether one citation is meant to be different (e.g., Schatten et al. 1969, Solar Physics 6, 442).
- [§5, last paragraph] The sentence beginning 'It would be interesting to further examine the relationship' could be trimmed or moved to the introduction, as it is more of a forward-looking remark than a conclusion.
Circularity Check
No circularity found: the PFSS coronal-field decline and the IPS m decline are independent measurement/model chains, with self-citations supplying context rather than load-bearing inputs.
full rationale
The paper's derivation chain has two independent legs. First, the coronal magnetic-field decline is computed by applying the standard PFSS model to NSO/KP and NSO/SOLIS synoptic magnetograms; the percentages in Table 1 are direct ratios of annual/Carrington-rotation averaged field values at the photosphere, 2.5 R_sun, and 10 R_sun, not quantities fitted to the IPS results. Second, the normalized scintillation index m is measured from ISEE IPS data and corrected for heliocentric distance and source size using Marians curves; the 23.6% decline is a direct comparison of annual averages of the measured and normalized data. The claimed phase relationship is an observed correlation, not a derivation of either quantity from the other. The self-citations (Janardhan et al. 2011, 2015; Bisoi et al. 2014) provide the normalization convention and earlier context, but the present m values are re-measured from the IPS observations and the PFSS extrapolation does not assume the target decline. The KP-to-SOLIS magnetogram transition is a possible source of systematic error because no cross-calibration is shown, but that is an observational calibration concern rather than a circular reduction: no equation in the paper makes the coronal decline equal to a fitted or definitionally imposed input. Therefore no specific circular step can be exhibited.
Assumptions & free parameters
free parameters (2)
- Decline onset epoch per latitude bin =
1992, 1994, 1996, or 1997 depending on bin (Table 1)
- Latitude bin boundaries =
0-45, 46-78, 78-90, 0-78 degrees
assumptions (5)
- domain assumption The solar corona is current-free (potential field) between photosphere and source surface, as assumed by PFSS.
- domain assumption Magnetic field lines are radial beyond 2.5 R_sun, justifying extrapolation to 10 R_sun.
- domain assumption Marians curves correctly describe the heliocentric-distance and source-size dependence of scintillation, and source 1148-001 is a perfect point source.
- domain assumption NSO/KP and NSO/SOLIS synoptic magnetograms are inter-calibrated, i.e., a given field strength produces the same measured value in both instruments.
- domain assumption The selected 27 IPS sources form an unbiased sample over 1983-2017.
Cite this review
Pith. "Pith review of Global Solar Magnetic-field and Interplanetary Scintillations During the Past Four Solar Cycles." pith.science (2026). https://pith.science/paper/HGDQ5KBS
@misc{pith2026190809134,
  author       = {Pith},
  title        = {Pith review of: Global Solar Magnetic-field and Interplanetary Scintillations During the Past Four Solar Cycles},
  year         = {2026},
  howpublished = {\url{https://pith.science/paper/HGDQ5KBS}},
  note         = {Machine review of arXiv:1908.09134}
}
abstract
The extended minimum of Solar Cycle 23, the extremely quiet solar-wind conditions prevailing, and the mini-maximum of Solar Cycle 24 drew global attention and many authors have since attempted to predict the amplitude of the upcoming Solar Cycle 25, which is predicted to be the third successive weak cycle; it is a unique opportunity to probe the Sun during such quiet periods. Earlier work has established a steady decline, over two decades, in solar photospheric fields at latitudes above $45^{\circ}$ and a similar decline in solar-wind micro-turbulence levels as measured by interplanetary scintillation (IPS) observations. However, the relation between the photospheric magnetic fields and those in the low corona/solar-wind are not straightforward. Therefore, in the present article, we have used potential-field source-surface (PFSS) extrapolations to deduce global magnetic-fields using synoptic magnetograms observed with National Solar Observatory (NSO), Kitt Peak, USA (NSO/KP) and Solar Optical Long-term Investigation of the Sun (NSO/SOLIS) instruments during 1975-2018. Furthermore, we have measured the normalized scintillation index [m] using the IPS observations carried out at the Institute of Space Earth Environment Research (ISEE), Japan during 1983-2017. From these observations, we have found that, since the mid-1990s, the magnetic-field over different latitudes at 2.5 $\rm R_{\odot}$ and 10 $\rm R_{\odot}$(extrapolated using PFSS method) has decreased by $\approx 11.3-22.2 \%$. In phase with the declining magnetic-fields, the quantity m also declined by $\approx 23.6 \%$. These observations emphasize the inter-relationship between the global magnetic-field and various turbulence parameters in the solar corona and solar wind.
Figures

Figures from the paper (2 more)

Reference graph
Works this paper leans on
-
[1]
Altschuler, M. D., & Newkirk, G. 1969, SoPh, 9, 131, doi: 10.1007/BF00145734
-
[2]
Ananthakrishnan, S., Coles, W. A., & Kaufman, J. J. 1980, J. Geophys. Res., 85, 6025, doi: 10.1029/JA085iA11p06025 14 Sasikumar Raja et al
- [3]
-
[4]
Asai, K., Kojima, M., Tokumaru, M., et al. 1998, J. Geophys. Res., 103, 1991, doi: 10.1029/97JA02750
-
[5]
Bird, M. K. 1981, in Solar Wind 4, ed. H. Rosenbauer, 78
work page 1981
-
[6]
Bird, M. K. 1982, SSRv, 33, 99, doi: 10.1007/BF00213250
-
[7]
K., Janardhan, P., Ingale, M., et al
Bisoi, S. K., Janardhan, P., Ingale, M., et al. 2014, ApJ, 795, 69, doi: 10.1088/0004-637X/795/1/69
-
[8]
M., Muschietti, L., & Goldman, M
Celnikier, L. M., Muschietti, L., & Goldman, M. V. 1987, A&A, 181, 138
work page 1987
Show all 42 references
-
[9]
Cliver, E. W. 2015, Revisiting the Sunspot Number, ed. A. Balogh, H. Hudson, K. Petrovay, & R. von Steiger, 35
2015
-
[10]
J., Velli, M
Fox, N. J., Velli, M. C., Bale, S. D., et al. 2016, Space Science Reviews, 204, 7, doi: 10.1007/s11214-015-0211-6
2016 doi
-
[11]
L., & Handy, B
Freeland, S. L., & Handy, B. N. 1998, SoPh, 182, 497, doi: 10.1023/A:1005038224881
1998 doi
-
[12]
Hale, G. E. 1908, ApJ, 28, 315, doi: 10.1086/141602
1908 doi
-
[13]
Harvey, J. W. 1969, PhD thesis, Univ. Colorado, Boulder
1969
-
[14]
F., & Wills, D
Hewish, A., Scott, P. F., & Wills, D. 1964, Nature, 203, 1214, doi: 10.1038/2031214a0
1964 doi
-
[15]
Hoeksema, J. T. 1984, PhD thesis, Stanford Univ., CA
1984
-
[16]
Janardhan, P., & Alurkar, S. K. 1993, A&A, 269, 119
1993
-
[17]
1996, SoPh, 166, 379, doi: 10.1007/BF00149405
Ananthakrishnan, S., et al. 1996, SoPh, 166, 379, doi: 10.1007/BF00149405
1996 doi
-
[18]
2011, Geophys
Tokumaru, M., & Fujiki, K. 2011, Geophys. Res. Lett., 38, L20108, doi: 10.1029/2011GL049227
2011 doi
-
[19]
K., Ananthakrishnan, S., et al
Janardhan, P., Bisoi, S. K., Ananthakrishnan, S., et al. 2015, J. Geophys. Res., 120, 5306, doi: 10.1002/2015JA021123
2015 doi
-
[20]
K., & Gosain, S
Janardhan, P., Bisoi, S. K., & Gosain, S. 2010, SoPh, 267, 267, doi: 10.1007/s11207-010-9653-x
2010 doi
-
[21]
K., & Rout, D
Janardhan, P., Fujiki, K., Ingale, M., Bisoi, S. K., & Rout, D. 2018, A&A, 618, A148, doi: 10.1051/0004-6361/201832981
2018 doi
-
[22]
1990, SSRv, 53, 173, doi: 10.1007/BF00212754
Kojima, M., & Kakinuma, T. 1990, SSRv, 53, 173, doi: 10.1007/BF00212754
1990 doi
-
[23]
J., & Tomczyk, S
Lin, H., Penn, M. J., & Tomczyk, S. 2000, ApJL, 541, L83, doi: 10.1086/312900
2000 doi
-
[24]
E., & Freeman, J
Lopez, R. E., & Freeman, J. W. 1986, J. Geophys. Res., 91, 1701, doi: 10.1029/JA091iA02p01701
1986 doi
-
[25]
H., & van Ballegooijen, A
Mackay, D. H., & van Ballegooijen, A. A. 2006, ApJ, 641, 577, doi: 10.1086/500425
2006 doi
-
[26]
Manoharan, P. K. 2010, SoPh, 265, 137, doi: 10.1007/s11207-010-9593-5
2010 doi
-
[27]
1975, Radio Science, 10, 115, doi: 10.1029/RS010i001p00115
Marians, M. 1975, Radio Science, 10, 115, doi: 10.1029/RS010i001p00115
1975 doi
-
[28]
J., Barraclough, B
McComas, D. J., Barraclough, B. L., Funsten, H. O., et al. 2000, J. Geophys. Res., 105, 10419, doi: 10.1029/1999JA000383
2000 doi
-
[29]
Mickey, D. L. 1973, ApJL, 181, L19, doi: 10.1086/181175
1973 doi
-
[30]
D., & Schatten, K
Pesnell, W. D., & Schatten, K. H. 2018, SoPh, 293, 112, doi: 10.1007/s11207-018-1330-5
2018 doi
-
[31]
W., & Smartt, R
Querfeld, C. W., & Smartt, R. N. 1984, SoPh, 91, 299, doi: 10.1007/BF00146301
1984 doi
-
[32]
Ramesh, R., Kathiravan, C., & Sastry, C. V. 2010, ApJ, 711, 1029, doi: 10.1088/0004-637X/711/2/1029 Sasikumar Raja, K., Ingale, M., Ramesh, R., et al. 2016, J. Geophys. Res., 121, 11, doi: 10.1002/2016JA023254 Sasikumar Raja, K., & Ramesh, R. 2013, ApJ, 775, 38, doi: 10.1088/0...
2010 doi
-
[33]
Kathiravan, C., & Wang, T. J. 2014, ApJ, 796, 56, doi: 10.1088/0004-637X/796/1/56 Sasikumar Raja, K., Subramanian, P., Ingale, M., & Ramesh, R. 2019, ApJ, 872, 77, doi: 10.3847/1538-4357/aafd33 Sasikumar Raja, K., Subramanian, P., Ramesh, R., Vourlidas, A., & Ingale, M. 2017, ...
2014 doi
-
[34]
Sastry, C. V. 2009, ApJ, 697, 1934, doi: 10.1088/0004-637X/697/2/1934
2009 doi
-
[35]
H., Wilcox, J
Schatten, K. H., Wilcox, J. M., & Ness, N. F. 1969a, SoPh, 6, 442, doi: 10.1007/BF00146478 —. 1969b, SoPh, 6, 442, doi: 10.1007/BF00146478
-
[36]
J., & De Rosa, M
Schrijver, C. J., & De Rosa, M. L. 2003, SoPh, 212, 165, doi: 10.1023/A:1022908504100
2003 doi
- [37]
-
[38]
T., Levy, G
Stelzried, C. T., Levy, G. S., Sato, T., et al. 1970, SoPh, 14, 440, doi: 10.1007/BF00221330 Global Solar Magnetic-field and Interplanetary Scintilla tions 15
1970 doi
-
[39]
Tokumaru, M., Kojima, M., & Fujiki, K. 2010, J. Geophys. Res., 115, A04102, doi: 10.1029/2009JA014628 van Ballegooijen, A. A., Priest, E. R., & Mackay, D. H. 2000, ApJ, 539, 983, doi: 10.1086/309265
2010 doi
-
[40]
R., Ananthakrishnan, S., Swarup, G., Pynzar, A
Venugopal, V. R., Ananthakrishnan, S., Swarup, G., Pynzar, A. V., & Udaltsov, V. A. 1985, MNRAS, 215, 685, doi: 10.1093/mnras/215.4.685
1985 doi
-
[41]
Wang, Y.-M., & Sheeley, Jr., N. R. 1992, ApJ, 392, 310, doi: 10.1086/171430
1992 doi
-
[42]
Zhao, X., & Hoeksema, J. T. 1995, J. Geophys. Res., 100, 19, doi: 10.1029/94JA02266
1995 doi
Reviewed August 14, 2026 · model on record in the stance chip above.
Discussion (0). Continue with ORCID to comment.