REVIEW 3 major objections 7 minor 60 references
Reviewed by Pith at T0; open to challenge.
T0 means a machine referee read the full paper against a public rubric. The mark states how deep the mechanical check went, never who wrote it. the ladder, T0–T4 →
T0 review · glm-5.2
UV radiation, not just mass, shapes core chemistry in Orion B
2026-07-09 09:13 UTC pith:HJBLRRDV
load-bearing objection Solid observational PCA study of 1001 Orion B cores; the G0/n result is real but the ratio-vs-components comparison is missing the 3 major comments →
Chemical diversity of dense cores in Orion B: The role of the environment
The pith
A machine-rendered reading of the paper's core claim, the machinery that carries it, and where it could break.
Core claim
The ratio of far-ultraviolet radiation field strength to mean gas density, G0/n, is the principal driver of chemical differentiation among dense cores in Orion B. Cores with low G0/n are cold and shielded, showing emission from N2H+, DCO+, and deuterated species, while cores with high G0/n show emission from CN, CCH, and HCO+ instead, despite having similar masses and column densities. This environmental parameter, not intrinsic core mass or column density alone, determines which molecular tracers a core will exhibit.
What carries the argument
Principal component analysis of 25 molecular line intensities across 1003 cores, with the second principal component (PC2) serving as a proxy for the G0/n ratio. The physical interpretation rests on well-known astrochemical pathways: UV photodissociation produces CN and CCH in irradiated gas, while deuterium fractionation and CO freeze-out occur in cold, dense, shielded gas. The G0/n ratio itself is a standard parameter in photodissociation region theory that controls the ionization fraction and thus the chemistry.
Load-bearing premise
The G0/n ratio uses single representative values of the UV field and gas density per core position, both derived from line-of-sight-averaged maps. The local UV field and density at the actual core surface where the chemistry operates may differ from these averaged values, and systematic biases in the density or radiation field maps (particularly in saturated high-column-density regions like NGC 2024) could artificially strengthen or weaken the correlation.
What would settle it
If cores with similar G0/n values but located in different cloud environments show systematically different molecular emission patterns, or if the PC2-G0/n correlation weakens significantly when higher-resolution density and radiation field measurements replace the current averaged maps, the claim that G0/n is the key controlling parameter would need revision.
If this is right
- Core identification surveys that rely solely on cold dense gas tracers like N2H+ are biased toward shielded cores and systematically miss UV-exposed cores of similar mass, skewing the prestellar core mass function.
- The G0/n parameter can be derived from existing far-infrared and column density maps, making it a practical diagnostic for classifying cores in large surveys without requiring full molecular line surveys.
- Cores in massive star-forming regions like Orion B have velocity dispersions about twice the thermal width, meaning the standard Bonnor-Ebert stability criterion assuming 10 K and negligible turbulence is inadequate for assessing whether a core will collapse.
- The C17O/C18O intensity ratio is constant at 0.292 plus or minus 0.001 across the full sample, confirming both lines are optically thin and trace the same gas, supporting their use as reliable column density tracers.
Where Pith is reading between the lines
- If G0/n is the primary chemical driver, then in clouds with even harder or more variable radiation fields (e.g., near O-type stars), the chemical diversity of cores should be even more extreme, and the fraction of N2H+-dark but UV-bright cores should increase, potentially explaining missing-core problems in other surveys.
- The finding that UV-exposed cores have similar masses to cold cores but different chemistry suggests that the star formation efficiency per core may depend on environment in ways not captured by dust-only selection, since UV irradiation could affect both the thermal balance and the ionization fraction that controls magnetic braking and angular momentum transport.
- The three-parameter description (column density, G0/n, mean density) could be tested as a predictive model: given these three quantities for a new core, one should be able to predict its molecular emission pattern, and deviations from the prediction would flag genuinely anomalous objects such as those near the NGC 2024 cloud-cloud collision site.
Editorial analysis
A structured set of objections, weighed in public.
Referee Report
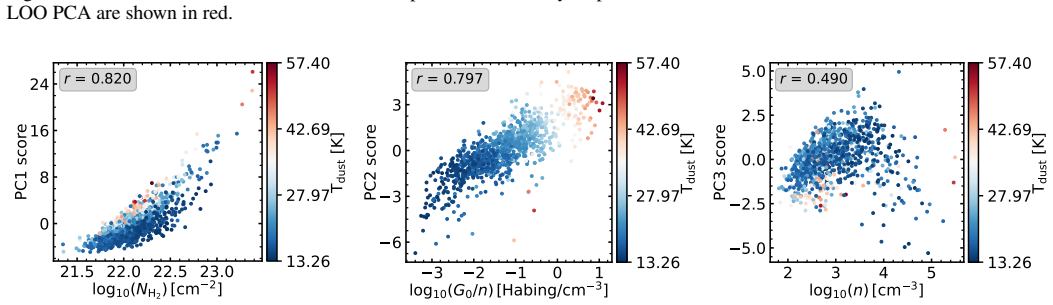
Summary. This paper presents a PCA of 25 molecular line intensities measured toward ~1003 dust-selected cores in the Orion B molecular cloud. The authors find that PC1 correlates with H2 column density (r=0.82), PC2 correlates with the ratio G0/n of FUV radiation field to mean gas density (r=0.80), and PC3 relates to mean density and freeze-out signatures. They use these results to argue that G0/n is the key parameter distinguishing UV-exposed cores from cold, shielded cores, and that core selection based solely on traditional cold tracers (N2H+, H13CO+) misses a population of FUV-exposed cores. Additional kinematic analysis of C18O(1-0) line widths shows that Orion B cores are more turbulent than those in nearby quiescent clouds. The C17O/C18O ratio of 0.292±0.001 is reported as a consistency check for optical thinness.
Significance. The paper provides a valuable statistical characterization of molecular line emission across a large, unbiased sample of cores in a massive star-forming cloud. The leave-one-out PCA robustness analysis is a genuine strength, demonstrating that the first three PCs are stable to outlier removal. The C17O/C18O ratio serves as a useful, falsifiable consistency check. The identification of a UV-exposed core population that would be missed by traditional cold-dense-core selection criteria is a practically useful result for future core surveys. The finding that Orion B cores have systematically larger line widths than Taurus analogs, challenging the applicability of Bonnor-Ebert criteria developed for quiescent clouds, is also noteworthy.
major comments (3)
- §4.3, Fig. 11: The central claim that G0/n is 'the key parameter' (§4.6, §6) is not fully supported because the paper never reports the correlation of PC2 with G0 alone or n alone. Section 4.3 states the three physical parameters were 'selected after initial assessments,' but these assessments are not shown. If G0 alone correlates with PC2 at a comparable r value, the specific emphasis on the ratio G0/n — which carries the PDR-chemistry interpretation — would be unjustified. The authors should report Pearson r for PC2 vs log(G0) and PC2 vs log(n) and discuss whether the ratio genuinely outperforms its components. This is load-bearing because the paper's interpretive framework (cold shielded cores vs. UV-exposed cores) depends on the ratio being the discriminating variable, not just UV illumination alone.
- §2.3, §4.4: The mean density n is derived by Orkisz & Kainulainen (2025) from the same Herschel column-density data used to define the core sample and N_H2, while G0 (Santa-Maria et al. 2023) is derived from far-IR luminosity that also depends on dust column. If n partially encodes N_H2, then G0/n carries a built-in N_H2 dependence. Since PC1 already captures N_H2 variance and PC2 is orthogonal to PC1, the PC2–G0/n correlation could be partly structural rather than purely physical. The authors should address this potential partial circularity, for example by checking whether residuals of n after removing the N_H2 dependence still correlate with PC2, or by discussing the degree of independence between the density and column-density maps.
- §4.5, Fig. 11 (right panel): The correlation between PC3 and log(n) is r=0.490, computed only for densities <10^3.5 cm^-3. This is a modest correlation, and the physical interpretation of PC3 (freeze-out, fractionation, excitation effects) is presented with limited quantitative support. The paper should clarify what fraction of the PC3 variance is actually captured by the density correlation and whether alternative physical parameters (e.g., dust temperature, which is color-coded in Fig. 11 but never correlated with any PC) might explain PC3 variance more effectively.
minor comments (7)
- Abstract states '1001 cores' while §2.1 gives 1001 objects, §2.4 extends to 1007, and §4.1 uses 1003 for the PCA. These numbers should be reconciled or explicitly explained in one place.
- Fig. 14 caption mentions 'PC2 < 2' and 'PC2 > 0' but the text in §5.2 defines the boxes as [PC2≤−2.5, G0/n≤−2] and [PC2≥2.5, G0/n≥0]. The caption and text should be made consistent.
- §5.2: The box definitions use log10(G0/n) thresholds of −2 and 0, but the text also references 'log10(G0/n)>0' and 'log10(G0/n)<−2.5' in different places. Standardize the threshold values.
- Fig. 11 caption: the units for G0/n are listed as '[Habing/cm^3]' in the axis label but the contour levels in Fig. 12 use values like '5.0e-03' without units. Consistent labeling would help.
- §3.2: The rejection of ~17% of cores (176/1007) from the kinematic analysis is mentioned but the potential selection bias on the virial mass analysis (Fig. 6) is not discussed. Are the rejected cores systematically different in environment or column density?
- Table A.1: The protostellar core 988 has G0=39383.81 Habing, which is ~2 orders of magnitude higher than most other protostars. A footnote or brief note on this extreme value would be helpful.
- §4.4: The statement 'Based on the combination of lines and the distribution of PC2 scores in Fig. 7 we saw that the environmental impact must have an important role' appears to reference Fig. 7 (intensity distributions) for PC2 scores, but PC2 scores are shown in Fig. 11/12. This reference may be incorrect.
Simulated Author's Rebuttal
We thank the referee for a thorough and constructive report. The major comments all identify legitimate gaps in the quantitative justification of our PCA interpretation. We address each below and indicate revisions we will make.
read point-by-point responses
-
Referee: §4.3, Fig. 11: The central claim that G0/n is 'the key parameter' is not fully supported because the paper never reports the correlation of PC2 with G0 alone or n alone. The authors should report Pearson r for PC2 vs log(G0) and PC2 vs log(n) and discuss whether the ratio genuinely outperforms its components.
Authors: The referee is correct that this is a gap in the manuscript. We will compute and report Pearson correlation coefficients for PC2 versus log(G0), PC2 versus log(n), and PC2 versus log(G0/n) in the revised manuscript. We will also report partial correlations controlling for log(N_H2), given that PC2 is orthogonal to PC1 (which traces N_H2). We agree that if G0 alone or n alone performs comparably to the ratio, the specific emphasis on G0/n would need to be tempered. We will present all three correlations transparently and adjust the language in §4.4, §4.6, and §6 accordingly. We note that the theoretical motivation for using G0/n — as a proxy for the penetration depth of FUV photons relative to the gas density, which controls the ionization fraction and PDR chemistry (Hollenbach & Tielens 1997; Bešlić et al. 2025) — provides a physical basis for the ratio beyond purely empirical correlation. However, we agree the empirical comparison must be shown. revision: yes
-
Referee: §2.3, §4.4: Potential partial circularity because n is derived from the same Herschel column-density data used to define N_H2, and G0 also depends on dust column. The PC2–G0/n correlation could be partly structural rather than purely physical.
Authors: This is a legitimate concern that we had not explicitly addressed. We will add a discussion of the degree of independence between the density map (Orkisz & Kainulainen 2025) and the column-density map. We note that the mean mass-weighted density is not simply N_H2 divided by a fixed path length; it is derived through a more complex inversion that incorporates structural information from the column-density map, so the two are related but not trivially identical. Nevertheless, some covariance is expected. To address the referee's specific suggestion, we will compute the residuals of log(n) after regressing out log(N_H2) and test whether these residuals still correlate with PC2. We will also perform the analogous test for G0. If the residual correlations remain significant, this will support the physical interpretation; if they weaken substantially, we will acknowledge that the PC2–G0/n correlation is partly structural. We will report the results honestly regardless of outcome. revision: yes
-
Referee: §4.5, Fig. 11 (right panel): The PC3–log(n) correlation is r=0.490, computed only for densities <10^3.5 cm^-3. The paper should clarify what fraction of PC3 variance is captured and whether dust temperature might explain PC3 variance more effectively.
Authors: The referee is correct that r=0.490 is a modest correlation and that we did not quantitatively justify the physical interpretation of PC3 beyond this. We will add the following to the revised manuscript: (1) We will state explicitly that r^2 = 0.24, meaning approximately 24% of the PC3 variance (for the subsample with n < 10^3.5 cm^-3) is captured by the density correlation, and acknowledge that the majority of PC3 variance remains unexplained by this single parameter. (2) We will compute and report the Pearson correlation between T_dust and PC3. As the referee notes, T_dust is already color-coded in Figure 11 but never quantitatively correlated with any PC. It is plausible that T_dust, which is anti-correlated with density in shielded regions and enhanced in FUV-exposed regions, captures additional PC3 variance. (3) We will also report r(PC3, T_dust) for the full sample and for the n < 10^3.5 cm^-3 subsample. If T_dust outperforms n as a predictor of PC3, we will revise our interpretation accordingly. We will temper the language in §4.5 to reflect that PC3 likely encodes a combination of excitation, freeze-out, and thermal effects, and that no single physical parameter fully accounts for its variance. revision: yes
Circularity Check
No circularity found; PCA is unsupervised on line intensities, physical parameters derived independently
full rationale
The paper applies PCA to 25 molecular line intensities measured from IRAM 30m spectral cubes, producing PC1–PC3. It then correlates these components with physical parameters derived from entirely independent data products: N_H2 from Herschel/Planck dust SED fitting (Lombardi et al. 2014), G0 from far-IR luminosity (Santa-Maria et al. 2023), and mean density n from a dust-based density map (Orkisz & Kainulainen 2025). The G0/n ratio is not used as input to the PCA, so the PC2–G0/n correlation (r≈0.8) is an empirical finding, not a construction. No parameter is fitted to PCA output and then predicted back. The self-citations (Gratier et al. 2017, 2021; Pety et al. 2017; Einig et al. 2023, 2024; Bešlić et al. 2025) provide methodology context (asinh rescaling, prior PCA interpretation, data pipeline) and the G0/n PDR proxy concept (tracing to Hollenbach & Tielens 1997), but none are load-bearing in a way that makes the central result tautological. The selection of G0/n among candidate parameters (§4.3: 'selected after initial assessments') raises a multiple-comparisons concern, but this is a correctness risk, not circularity. The derivation is self-contained against external data.
Axiom & Free-Parameter Ledger
free parameters (3)
- asinh reparametrization
- Default velocity window (-4, 16 km/s) =
[-4, 16] km/s
- Line width rejection thresholds =
FWHM>5 km/s, δσ>0.2 km/s, δσ/σ>30%
axioms (4)
- domain assumption C18O(1-0) and C17O(1-0) are optically thin in all sampled cores
- domain assumption The mean mass-weighted density n is a representative physical parameter for each core
- domain assumption Single Gaussian fitting of C18O profiles yields meaningful velocity dispersions even for cores with complex velocity structure
- domain assumption The K20 core positions are sufficiently accurate for extracting representative spectra
read the original abstract
Prestellar cores are the sites of the earliest stages of star formation. Dust continuum observations are often used to identify and characterize their properties yet only a small fraction of them was observed and studied in terms of their composition and dynamical status. We explore the chemical diversity of prestellar cores and protostellar cores residing in the Orion B giant molecular cloud selected on their dust continuum emission to provide an unbiased view of their line emission properties and how they vary as function of the core parameters and environment. We make use of the large scale maps of Orion B in 25 molecular lines from which we extract information for a sample of 1001 cores selected using positions extracted from \textit{Herschel} dust continuum observations. The main properties of the core sample are derived using the Principal Component Analysis and additional maps of physical parameters: column density $N_{\rm{H_2}}$, far-ultraviolet (FUV) radiation field $G_0$ and mean volume gas density $n$. Additional high spectral resolution observations of $\rm C^{18}O(1-0)$ serve to evaluate the dynamical status of cores. The average line width of the cores is larger than what is typically expected for prestellar cores of closer star forming regions, which suggests that cores in Orion B are subjected to stronger turbulence affecting their stability. The first factor of the PCA analysis explaining the variation of the detected line intensities is the core column density of molecular gas. The second factor explains how the core chemical composition is strictly linked to their environment, which can be traced by the ratio of the external FUV radiation field over the core volume density, $G_0/n$. The third factor explaining the core chemical diversity is the mean density along the core line of sight, which is also associated with freeze-out and fractionation signatures.
Figures




Reference graph
Works this paper leans on
-
[1]
Herschel-Planck dust optical-depth and column-density maps. I. Method description and results for Orion. , keywords =. doi:10.1051/0004-6361/201323293 , archivePrefix =. 1404.0032 , primaryClass =
work page internal anchor Pith review Pith/arXiv arXiv doi:10.1051/0004-6361/201323293
-
[2]
Properties of the dense core population in Orion B as seen by the Herschel Gould Belt survey
Properties of the dense core population in Orion B as seen by the Herschel Gould Belt survey. , keywords =. doi:10.1051/0004-6361/201834753 , archivePrefix =. 1910.04053 , primaryClass =
work page internal anchor Pith review Pith/arXiv arXiv doi:10.1051/0004-6361/201834753 1910
-
[3]
The anatomy of the Orion B Giant Molecular Cloud: A local template for studies of nearby galaxies
The anatomy of the Orion B giant molecular cloud: A local template for studies of nearby galaxies. , keywords =. doi:10.1051/0004-6361/201629862 , archivePrefix =. 1611.04037 , primaryClass =
work page internal anchor Pith review Pith/arXiv arXiv doi:10.1051/0004-6361/201629862
-
[4]
C ^ 18 O, ^ 13 CO, and ^ 12 CO abundances and excitation temperatures in the Orion B molecular cloud. Analysis of the achievable precision in modeling spectral lines within the approximation of the local thermodynamic equilibrium. , keywords =. doi:10.1051/0004-6361/202037776 , archivePrefix =. 2005.08317 , primaryClass =
-
[5]
Extinction of Taurus, Orion, Perseus, and California Molecular Clouds Based on the LAMOST, 2MASS, and Gaia Surveys. I. 3D Extinction and Structure. , keywords =. doi:10.3847/1538-4357/acbbc7 , archivePrefix =. 2302.06306 , primaryClass =
work page internal anchor Pith review Pith/arXiv arXiv doi:10.3847/1538-4357/acbbc7
-
[6]
Deep learning denoising by dimension reduction: Application to the ORION-B line cubes
Deep learning denoising by dimension reduction: Application to the ORION-B line cubes. , keywords =. doi:10.1051/0004-6361/202346064 , archivePrefix =. 2307.13009 , primaryClass =
work page internal anchor Pith review Pith/arXiv arXiv doi:10.1051/0004-6361/202346064
-
[7]
From filamentary clouds to prestellar cores to the stellar IMF: Initial highlights from the Herschel Gould Belt Survey. , keywords =. doi:10.1051/0004-6361/201014666 , archivePrefix =. 1005.2618 , primaryClass =
work page internal anchor Pith review Pith/arXiv arXiv doi:10.1051/0004-6361/201014666
-
[8]
Planck 2013 results. I. Overview of products and scientific results. , keywords =. doi:10.1051/0004-6361/201321529 , archivePrefix =. 1303.5062 , primaryClass =
work page internal anchor Pith review Pith/arXiv arXiv doi:10.1051/0004-6361/201321529 2013
-
[9]
Dissecting the molecular structure of the Orion B cloud: Insight from Principal Component Analysis
Dissecting the molecular structure of the Orion B cloud: insight from principal component analysis. , keywords =. doi:10.1051/0004-6361/201629847 , archivePrefix =. 1701.04205 , primaryClass =
work page internal anchor Pith review Pith/arXiv arXiv doi:10.1051/0004-6361/201629847
-
[10]
HCN emission from translucent gas and UV-illuminated cloud edges revealed by wide-field IRAM 30 m maps of the Orion B GMC. Revisiting its role as a tracer of the dense gas reservoir for star formation. , keywords =. doi:10.1051/0004-6361/202346598 , archivePrefix =. 2309.03186 , primaryClass =
work page internal anchor Pith review Pith/arXiv arXiv doi:10.1051/0004-6361/202346598
-
[11]
The first estimation of the ionization fraction in dense and translucent molecular gas across Orion B. , keywords =. doi:10.1051/0004-6361/202553706 , archivePrefix =. 2507.19480 , primaryClass =
-
[12]
On volume density and star formation in nearby molecular clouds
Volume densities and star formation in nearby molecular clouds. , keywords =. doi:10.1051/0004-6361/202245828 , archivePrefix =. 2412.07595 , primaryClass =
work page internal anchor Pith review Pith/arXiv arXiv doi:10.1051/0004-6361/202245828
-
[13]
Quantitative inference of the H _ 2 column densities from 3 mm molecular emission: case study towards Orion B. , keywords =. doi:10.1051/0004-6361/202037871 , archivePrefix =. 2008.13417 , primaryClass =
work page internal anchor Pith review Pith/arXiv arXiv doi:10.1051/0004-6361/202037871 2008
-
[14]
Quantifying the informativity of emission lines to infer physical conditions in giant molecular clouds: I. Application to model predictions. , keywords =. doi:10.1051/0004-6361/202451588 , archivePrefix =. 2408.08114 , primaryClass =
work page internal anchor Pith review Pith/arXiv arXiv doi:10.1051/0004-6361/202451588
-
[15]
ALMAGAL: IV. Morphological comparison of molecular and thermal dust emission using the histogram of oriented gradients method. , keywords =. doi:10.1051/0004-6361/202452700 , archivePrefix =. 2504.12963 , primaryClass =
work page internal anchor Pith review Pith/arXiv arXiv doi:10.1051/0004-6361/202452700
-
[16]
3D physico-chemical model of a pre-stellar core. I. Environmental and structural impact on the distribution of CH _ 3 OH and c-C _ 3 H _ 2. , keywords =. doi:10.1051/0004-6361/202245466 , archivePrefix =. 2305.05932 , primaryClass =
work page internal anchor Pith review Pith/arXiv arXiv doi:10.1051/0004-6361/202245466
-
[17]
First map of D _ 2 H ^ + emission revealing the true centre of a prestellar core: Further insights into deuterium chemistry. , keywords =. doi:10.1051/0004-6361/202347351 , archivePrefix =. 2409.10093 , primaryClass =
work page internal anchor Pith review Pith/arXiv arXiv doi:10.1051/0004-6361/202347351
-
[18]
Ionization fraction and the enhanced sulfur chemistry in Barnard 1
Ionization fraction and the enhanced sulfur chemistry in Barnard 1. , keywords =. doi:10.1051/0004-6361/201628285 , archivePrefix =. 1605.04724 , primaryClass =
work page internal anchor Pith review Pith/arXiv arXiv doi:10.1051/0004-6361/201628285
-
[19]
ALMA-IMF. I. Investigating the origin of stellar masses: Introduction to the Large Program and first results. , keywords =. doi:10.1051/0004-6361/202141677 , archivePrefix =. 2112.08182 , primaryClass =
work page internal anchor Pith review Pith/arXiv arXiv doi:10.1051/0004-6361/202141677
-
[20]
ALMA-IMF. III. Investigating the origin of stellar masses: top-heavy core mass function in the W43-MM2&MM3 mini-starburst. , keywords =. doi:10.1051/0004-6361/202142951 , archivePrefix =. 2203.03276 , primaryClass =
work page internal anchor Pith review Pith/arXiv arXiv doi:10.1051/0004-6361/202142951
-
[21]
ALMAGAL: I. The ALMA evolutionary study of high-mass protocluster formation in the Galaxy: Presentation of the survey and early results. , keywords =. doi:10.1051/0004-6361/202452702 , archivePrefix =. 2503.05555 , primaryClass =
work page internal anchor Pith review Pith/arXiv arXiv doi:10.1051/0004-6361/202452702
-
[22]
A Complete Search for Dense Cloud Cores in Taurus. , keywords =. doi:10.1086/341347 , adsurl =
-
[23]
Molecular Cloud Cores with High Deuterium Fractions: Nobeyama Mapping Survey
Molecular Cloud Cores with High Deuterium Fractions: Nobeyama Mapping Survey. , keywords =. doi:10.3847/1538-4365/ac0978 , archivePrefix =. 2106.04052 , primaryClass =
work page internal anchor Pith review Pith/arXiv arXiv doi:10.3847/1538-4365/ac0978
-
[24]
Mapping synthetic observations to pre-stellar core models: An interpretable machine learning approach. , keywords =. doi:10.1051/0004-6361/202453266 , archivePrefix =. 2502.07874 , primaryClass =
-
[25]
Discovery of benzyne, o-C6H4, in TMC-1 with the QUIJOTE line survey
Discovery of benzyne, o-C _ 6 H _ 4 , in TMC-1 with the QUIJOTE line survey. , keywords =. doi:10.1051/0004-6361/202141660 , archivePrefix =. 2108.02308 , primaryClass =
work page internal anchor Pith review Pith/arXiv arXiv doi:10.1051/0004-6361/202141660
-
[26]
Gas kinematics around filamentary structures in the Orion B cloud
Gas kinematics around filamentary structures in the Orion B cloud. , keywords =. doi:10.1051/0004-6361/202142109 , archivePrefix =. 2211.14350 , primaryClass =
work page internal anchor Pith review Pith/arXiv arXiv doi:10.1051/0004-6361/202142109
-
[27]
Pressure-confined Clumps in Magnetized Molecular Clouds. , keywords =. doi:10.1086/171638 , adsurl =
-
[28]
Toward a robust physical and chemical characterization of heterogeneous lines of sight: The case of the Horsehead nebula. , keywords =. doi:10.1051/0004-6361/202451567 , archivePrefix =. 2409.20074 , primaryClass =
work page internal anchor Pith review Pith/arXiv arXiv doi:10.1051/0004-6361/202451567
-
[29]
Low sulfur depletion in the Horsehead PDR
Low sulfur depletion in the Horsehead PDR. , keywords =. doi:10.1051/0004-6361:20065260 , archivePrefix =. astro-ph/0605716 , primaryClass =
work page internal anchor Pith review Pith/arXiv arXiv doi:10.1051/0004-6361:20065260
-
[30]
Bias versus variance when fitting multi-species molecular lines with a non-LTE radiative transfer model. Application to the estimation of the gas temperature and volume density. , keywords =. doi:10.1051/0004-6361/202449148 , archivePrefix =. 2403.20057 , primaryClass =
work page internal anchor Pith review Pith/arXiv arXiv doi:10.1051/0004-6361/202449148
-
[31]
Alignment of dense molecular core morphology and velocity gradients with ambient magnetic fields
Alignment of dense molecular core morphology and velocity gradients with ambient magnetic fields. , keywords =. doi:10.1093/mnras/stad2283 , archivePrefix =. 2307.13022 , primaryClass =
work page internal anchor Pith review Pith/arXiv arXiv doi:10.1093/mnras/stad2283
-
[32]
The Green Bank Ammonia Survey: Data Release 2. , keywords =. doi:10.3847/1538-4365/ae11b1 , archivePrefix =. 2510.10607 , primaryClass =
-
[33]
A multi-scale, multi-wavelength source extraction method: getsources , DOI= "10.1051/0004-6361/201218797", url= "https://doi.org/10.1051/0004-6361/201218797", journal =
-
[34]
The JCMT Gould Belt Survey: A First Look at Dense Cores in Orion B
The JCMT Gould Belt Survey: A First Look at Dense Cores in Orion B. , keywords =. doi:10.3847/0004-637X/817/2/167 , archivePrefix =. 1512.00893 , primaryClass =
work page internal anchor Pith review Pith/arXiv arXiv doi:10.3847/0004-637x/817/2/167
-
[35]
A Survey of Infall Motions toward Starless Cores. I. CS (2-1) and N _ 2 H ^ + (1-0) Observations. , keywords =. doi:10.1086/308027 , archivePrefix =. astro-ph/9906468 , primaryClass =
work page internal anchor Pith review Pith/arXiv arXiv doi:10.1086/308027
-
[36]
Principal component analysis: a review and recent developments
Jolliffe, Ian T and Cadima, Jorge. Principal component analysis: a review and recent developments. Philos. Trans. A Math. Phys. Eng. Sci
-
[37]
Complex Structure in Class 0 Protostellar Envelopes. II. Kinematic Structure from Single-dish and Interferometric Molecular Line Mapping. , keywords =. doi:10.1088/0004-637X/740/1/45 , archivePrefix =. 1107.4361 , primaryClass =
work page internal anchor Pith review Pith/arXiv arXiv doi:10.1088/0004-637x/740/1/45
-
[38]
Exploratory data analysis
-
[39]
The ALMA Survey of 70 m Dark High-mass Clumps in Early Stages (ASHES). VII. Chemistry of Embedded Dense Cores. , keywords =. doi:10.3847/1538-4357/ac94d4 , archivePrefix =. 2209.12814 , primaryClass =
work page internal anchor Pith review Pith/arXiv arXiv doi:10.3847/1538-4357/ac94d4
-
[40]
Identification of pre-stellar cores in high-mass star forming clumps via H _ 2 D ^ + observations with ALMA. , keywords =. doi:10.1051/0004-6361/202140694 , archivePrefix =. 2104.06431 , primaryClass =
work page internal anchor Pith review Pith/arXiv arXiv doi:10.1051/0004-6361/202140694
-
[41]
Distribution of methanol and cyclopropenylidene around starless cores , DOI= "10.1051/0004-6361/201936598", url= "https://doi.org/10.1051/0004-6361/201936598", journal =
-
[42]
Gas-phase CO depletion and N2H+ abundances in starless cores , DOI= "10.1051/0004-6361/201322129", url= "https://doi.org/10.1051/0004-6361/201322129", journal =
work page internal anchor Pith review doi:10.1051/0004-6361/201322129
-
[43]
High-mass star formation in Orion triggered by cloud-cloud collision II, Two merging molecular clouds in NGC2024. arXiv e-prints , keywords =. doi:10.48550/arXiv.1706.05652 , archivePrefix =. 1706.05652 , primaryClass =
work page internal anchor Pith review Pith/arXiv arXiv doi:10.48550/arxiv.1706.05652
-
[44]
Linear Sequences of Starless Cores and Young Stellar Objects in the Eagle Nebula. , keywords =. doi:10.1086/340439 , adsurl =
-
[45]
Prestellar Cores in Turbulent Clouds: Properties of Critical Cores
Prestellar Cores in Turbulent Clouds: Properties of Critical Cores. , keywords =. doi:10.3847/1538-4357/ade239 , archivePrefix =. 2411.07350 , primaryClass =
work page internal anchor Pith review Pith/arXiv arXiv doi:10.3847/1538-4357/ade239
-
[46]
Nature Astronomy , year = 2025, month = dec, volume =
Evidence of triggered star formation in the Pillars of Creation from JWST observations. Nature Astronomy , year = 2025, month = dec, volume =. doi:10.1038/s41550-025-02683-8 , adsurl =
-
[47]
Pedregosa, F. and Varoquaux, G. and Gramfort, A. and Michel, V. and Thirion, B. and Grisel, O. and Blondel, M. and Prettenhofer, P. and Weiss, R. and Dubourg, V. and Vanderplas, J. and Passos, A. and Cournapeau, D. and Brucher, M. and Perrot, M. and Duchesnay, E. , journal=. Scikit-learn: Machine Learning in
-
[48]
ALMAGAL: III. Compact source catalog: Fragmentation statistics and physical evolution of the core population. , keywords =. doi:10.1051/0004-6361/202452706 , archivePrefix =. 2503.05663 , primaryClass =
work page internal anchor Pith review Pith/arXiv arXiv doi:10.1051/0004-6361/202452706
-
[49]
, year = 1997, month = jan, volume =
Dense Photodissociation Regions (PDRs). , year = 1997, month = jan, volume =. doi:10.1146/annurev.astro.35.1.179 , adsurl =
-
[50]
Competition between CO and N _ 2 Desorption from Interstellar Ices. , keywords =. doi:10.1086/428901 , adsurl =
-
[51]
Thermal Desorption of Interstellar Ices: A Review on the Controlling Parameters and Their Implications from Snowlines to Chemical Complexity. ACS Earth and Space Chemistry , keywords =. doi:10.1021/acsearthspacechem.1c00357 , archivePrefix =. 2201.07512 , primaryClass =
work page internal anchor Pith review Pith/arXiv arXiv doi:10.1021/acsearthspacechem.1c00357
-
[52]
The Green Bank Ammonia Survey (GAS): First Results of NH3 mapping the Gould Belt
The Green Bank Ammonia Survey: First Results of NH _ 3 Mapping of the Gould Belt. , keywords =. doi:10.3847/1538-4357/aa6d58 , archivePrefix =. 1704.06318 , primaryClass =
work page internal anchor Pith review Pith/arXiv arXiv doi:10.3847/1538-4357/aa6d58
-
[53]
Physical Processes in Interstellar Clouds , year = 1987, editor =
Evolution of interstellar dust. Physical Processes in Interstellar Clouds , year = 1987, editor =. doi:10.1007/978-94-009-3945-5_21 , adsurl =
-
[54]
Observations of the Icy Universe
Observations of the icy universe. , keywords =. doi:10.1146/annurev-astro-082214-122348 , archivePrefix =. 1501.05317 , primaryClass =
work page internal anchor Pith review Pith/arXiv arXiv doi:10.1146/annurev-astro-082214-122348
-
[55]
Water, O2 and Ice in Molecular Clouds
Water, O _ 2 , and Ice in Molecular Clouds. , keywords =. doi:10.1088/0004-637X/690/2/1497 , archivePrefix =. 0809.1642 , primaryClass =
work page internal anchor Pith review Pith/arXiv arXiv doi:10.1088/0004-637x/690/2/1497
-
[56]
The ionization fraction gradient across the Horsehead edge: An archetype for molecular clouds
The ionization fraction gradient across the Horsehead edge: an archetype for molecular clouds. , keywords =. doi:10.1051/0004-6361/200811496 , archivePrefix =. 0902.2748 , primaryClass =
work page internal anchor Pith review Pith/arXiv arXiv doi:10.1051/0004-6361/200811496
-
[57]
Isotopic fractionation of carbon, deuterium and nitrogen : a full chemical study
Isotopic fractionation of carbon, deuterium, and nitrogen: a full chemical study. , keywords =. doi:10.1051/0004-6361/201425113 , archivePrefix =. 1501.01141 , primaryClass =
work page internal anchor Pith review Pith/arXiv arXiv doi:10.1051/0004-6361/201425113
-
[58]
Are PAHs precursors of small hydrocarbons in Photo--Dissociation Regions? The Horsehead case
Are PAHs precursors of small hydrocarbons in photo-dissociation regions? The Horsehead case. , keywords =. doi:10.1051/0004-6361:20041170 , archivePrefix =. astro-ph/0501339 , primaryClass =
work page internal anchor Pith review Pith/arXiv arXiv doi:10.1051/0004-6361:20041170
-
[59]
H ^ 13 CO ^ + and CH _ 3 OH Line Observations of Prestellar Dense Cores in the TMC-1C Region. II. Internal Structure. , keywords =. doi:10.1086/345845 , adsurl =
-
[60]
SiO in G34.26: Outflows and shocks in a high mass star forming region. , keywords =. doi:10.1051/0004-6361:20010468 , adsurl =
discussion (0)
Sign in with ORCID, Apple, or X to comment. Anyone can read and Pith papers without signing in.