REVIEW 4 major objections 5 minor 7 cited by
This paper argues that short gamma-ray bursts occur just 10–800 million years after their parent stars form, not billions of years later — and that the earlier long delays came from mishandled selection effects.
Reviewed by Pith at T0; open to challenge. T0 means a machine referee read the full paper against a public rubric. the ladder, T0–T4 →
T0 review · deepseek-v4-flash
2026-08-03 12:12 UTC pith:HJPKZRZ4
load-bearing objection A careful HBM reanalysis that plausibly corrects W15's multi-Gyr SGRB delays to sub-Gyr, but the whole edifice leans on a completeness threshold taken from the authors' prior paper. the 4 major comments →
Short gamma-ray burst progenitors have short delay times
The pith
A machine-rendered reading of the paper's core claim, the machinery that carries it, and where it could break.
Core claim
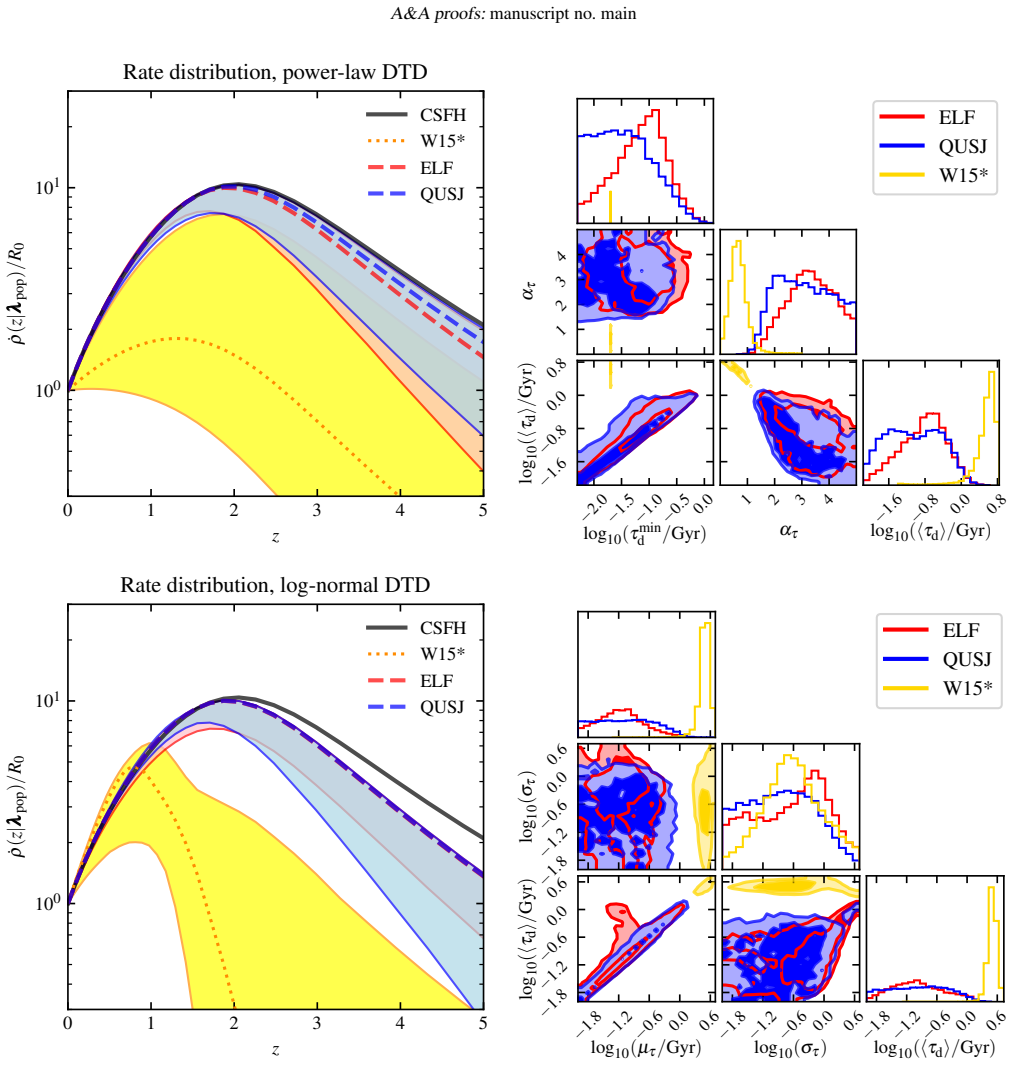
On the paper's own terms, the discovery is that short gamma-ray bursts merge shortly after their progenitors form: a hierarchical Bayesian reanalysis of a flux-complete 210-burst Fermi/GBM sample and a nearly redshift-complete 18-event subsample, run with two delay models and two luminosity models, yields average delays of about 10–800 Myr, minimum delays below ~350 Myr, and steep power-law indices α_τ ≈ 3. It further establishes that earlier multi-gigayear estimates were likely an artifact of selection effects: in simulation, re-inferring a population with known delays using flux thresholds below the completeness limit shifts recovered delays upward, and the same framework on the earlier st
What carries the argument
The load-bearing element is the selection term in the hierarchical Bayesian likelihood — the denominator D(λ'_pop) = ∫ P_det(λ_src) P_pop(λ_src) dλ_src, which encodes the probability that a source with given properties would be detected and included. The paper models detection as a hard Heaviside threshold on the 64-ms peak photon flux, P_det = Θ(p − p_lim), and takes the flux-completeness limit of Fermi/GBM to be p_lim,GBM = 3.5 cm⁻² s⁻¹: above this flux the sample is assumed genuinely complete. That threshold carries the whole argument — it is the difference between this analysis and earlier ones, which used effective thresholds low enough to admit flux-incomplete samples. The supporting m
Load-bearing premise
The result — and the diagnosis that earlier studies were biased — rests on the assumption that Fermi/GBM's detection efficiency is genuinely complete above a 64-ms peak photon flux of 3.5 cm⁻² s⁻¹, so that the hard threshold used in the selection model is the true completeness limit; if real efficiency falls below that even above the threshold, this analysis carries the same bias it attributes to earlier work.
What would settle it
Re-run the paper's own injection test (Section 4.1) with the delay parameters it actually infers — a power law with α_τ ≈ 3 and τ_min ≈ 0.08 Gyr, giving an average delay around 160 Myr — and check whether lowering the assumed flux threshold below the completeness limit still pushes the recovered average delay upward; if it does not, the proposed bias mechanism is not operative in the regime the paper concludes. A direct measurement of Fermi/GBM's short-burst detection efficiency near 3.5 cm⁻² s⁻¹ would settle whether the completeness premise itself holds.
If this is right
- SGRB rate evolution should closely track the cosmic star formation history with little time lag, so the high-redshift SGRB rate is higher than earlier long-delay models implied.
- A steep power-law index α_τ ≈ 3 replaces the simple α_τ = 1 expectation for binaries shrinking purely by gravitational radiation, implying fast merger channels — short initial orbital separations, common-envelope and mass-transfer evolution, and neutron-star natal kicks.
- The inferred short delays bring SGRB population constraints in line with Galactic r-process element studies that require fast mergers (minimum delays ≲ 40 Myr and steep indices).
- For most model combinations, the inferred local SGRB rate falls within the binary-neutron-star merger rate measured by gravitational-wave observatories, reinforcing BNS mergers as the dominant SGRB progenitor channel.
- Future population studies must either build flux-complete samples or model the full detection efficiency; analyses that ignore completeness will systematically overestimate delay times.
Where Pith is reading between the lines
- A directly testable corollary the paper leaves implicit: a truly flux- and redshift-complete SGRB sample should show a redshift distribution that peaks near the star-formation peak and decays less steeply than the long-delay prediction — a larger complete redshift sample would settle this observationally.
- The bias mechanism plausibly generalizes beyond SGRBs to any transient population inferred from a flux-limited catalog without a verified completeness threshold, including long gamma-ray bursts and other compact-merger counterparts.
- The injection test's simulated population has a long true average delay (2.78 Gyr, α_τ = 1), not the short-delay regime the paper infers; repeating the test at the inferred parameters (α_τ ≈ 3, τ_min ≈ 0.08 Gyr) would confirm the size of the bias in the actual regime.
- As gravitational-wave catalogs grow, the delay-time distribution inferred here from SGRBs can be cross-checked against the merger-delay distribution reconstructed directly from detected BNS systems, providing a largely independent test of the short-delay claim.
Editorial analysis
A structured set of objections, weighed in public.
Referee Report
Summary. This paper presents a hierarchical Bayesian inference of the short gamma-ray burst (SGRB) population, jointly modeling the delay-time distribution (DTD) and luminosity function. The analysis uses two DTD models (power-law with minimum delay, log-normal), two luminosity models (empirical broken power law, ELF; quasi-universal structured jet, QUSJ), and two samples: a 210-event Fermi/GBM observer-frame sample and an 18-event rest-frame sample. The authors report short average delays, 10 ≲ ⟨τ_d⟩/Myr ≲ 800, and a minimum delay ≲ 350 Myr, in contrast with earlier studies that found multi-Gyr delays. They reproduce the earlier Wanderman & Piran (2015) constraints using the same framework with the earlier sample and selection model (W15*), and perform an injection test in §4.1 to argue that the longer delays in previous studies are due to incorrect treatment of selection effects, specifically using flux thresholds below the completeness limit.
Significance. If correct, the paper would resolve a major discrepancy in SGRB population studies: it would show that SGRB rate evolution is consistent with short-delay BNS merger channels and that previous multi-Gyr delay inferences are selection artifacts. The paper's strengths are the W15* reproduction, which anchors the new framework to an external published result, the consistency of the central finding across four model combinations, and the injection test that directly demonstrates the bias direction from incomplete flux samples. The analysis builds on the publicly available grbpop code, which is a reproducibility asset. The main risk is that the central claim and the bias diagnosis both depend on the completeness threshold p_lim,GBM = 3.5 cm⁻² s⁻¹ adopted from the authors' earlier S23 work, and on the assertion that the rest-frame sample is redshift-complete.
major comments (4)
- [§4.1, Fig. 5] The injection test does not validate the bias in the parameter regime actually inferred. The simulated truth is α_τ=1, τ_min=0.1 Myr, giving ⟨τ_d⟩=2.78 Gyr, whereas the real posterior is α_τ≈3.3, τ_min≈0.08 Gyr, ⟨τ_d⟩≈160 Myr. The test therefore shows that, for a long-delay population, using an incomplete flux threshold biases the inferred delay even longer; it does not demonstrate the magnitude of the selection bias for the short-delay population that the paper claims to measure. Please rerun the injection with truth parameters drawn from the inferred posterior regime, and also report the sensitivity of the real inference to p_lim values around 3.5 (e.g., 3.0, 4.0, 5.0 cm⁻² s⁻¹). Without this, the quantitative claim '10–800 Myr' and the causal diagnosis for W15 are not fully supported.
- [§2.4.1, Eq. (15)] The entire analysis, and especially the bias diagnosis, rests on p_lim,GBM = 3.5 cm⁻² s⁻¹, which is adopted from S23 and modeled as a hard Heaviside cut. The denominator D(λ') in Eq. (3) divides the per-event likelihood by the fraction of the population passing this cut, so an incorrect completeness threshold directly biases the DTD hyperparameters. The injection test validates this threshold only against S23's smooth efficiency at E_p,obs = 100 keV and at a single threshold value. If the true completeness limit is higher than 3.5, the observer-frame sample is flux-incomplete in precisely the manner attributed to W15; if it is lower, the bias correction applied to earlier samples may be overstated. The paper needs an independent or otherwise stronger justification of p_lim=3.5, or a sensitivity analysis showing that the short-delay conclusion and the W15-bias diagnosis are robust across
- [§2.4.2, Eqs. (15)–(16)] The rest-frame sample is asserted to maximize redshift completeness, but the selection function does not include the probability that a redshift is measured. The sample contains 18 events and only 16 with measured redshift; the cuts that produce the sample may correlate with luminosity and redshift. If redshift measurement probability depends on L or z, the likelihood in Eqs. (1)–(3) is biased. The paper should either model the redshift-measurement efficiency explicitly or demonstrate by simulation that the stated cuts leave the redshift distribution unbiased. This is load-bearing because the rest-frame sample is one of the two anchors of the redshift-evolution inference.
- [Table 2, log-normal DTD rows] For the log-normal DTD, σ_τ is essentially unconstrained: ELF gives σ_τ = 0.30 +2.16 −0.28 and QUSJ gives σ_τ = 0.14 +1.59 −0.13 (90% intervals). Since the mean delay of a log-normal is exp(μ + σ²/2), large σ admits substantially longer delays. The abstract's claim 'Regardless of the chosen parametrization' is therefore weaker for the log-normal case than for the power-law case. The paper should either report the posterior on ⟨τ_d⟩ directly (which is the meaningful quantity) or qualify the log-normal conclusion. This is not a fatal flaw, but it is important for the robustness claim and should be addressed.
minor comments (5)
- [Abstract / Keywords] The key words include 'gamma-ray burst: individual: GRB 221009A', but GRB 221009A is not discussed anywhere in the paper and is not an SGRB. Remove or replace.
- [Eq. (8)] The log-normal DTD formula has a typo: the exponent appears as '−1/2 (ln τ_d − ln μ_τ)^2 / 2σ_τ^2', which is dimensionally inconsistent. It should be exp[−(ln τ_d − ln μ_τ)^2 / (2σ_τ^2)].
- [Table 1 / Table A.1] The prior for R_0 is listed as 'Uniform-in-log, σ_c ∈ [1,10^5]' in Table 1; the parameter name should be R_0. In Table A.1 the units for R_0 are given as 'Gpc⁻³ s⁻¹'; should be 'Gpc⁻³ yr⁻¹'.
- [Appendix A.3 / Table A.2] The text says the W15* local rate density is 'one order of magnitude higher' than W15, but Table A.2 gives R_0 = 13.8 vs 7.7 Gpc⁻³ yr⁻¹ (factor ~1.8). Please correct or rephrase.
- [§4.1, Fig. 4] The statement that the detection efficiency is '≳80% above the chosen threshold' is used to justify treating the sample as complete. 80% is not 100%; the hard-threshold approximation should be acknowledged more explicitly, especially because it is the basis of Eq. (15).
Circularity Check
No significant circularity; the inference is self-contained and anchored by the external W15* reproduction and a controlled injection test.
full rationale
The central claim (short average delay times 10-800 Myr, with long delays in earlier work attributed to selection effects) is reached by a hierarchical Bayesian fit of DTD hyper-parameters (Eqs. 1-3, 6-11) to the GBM observer-frame and rest-frame samples. The DTD parameters are free parameters of the population model P_pop(lambda_src|lambda'_pop); they are not quantities that have been fitted to the target claim and then relabeled as predictions. The only self-citation that carries weight is the Fermi/GBM flux-completeness threshold p_lim,GBM = 3.5 cm^-2 s^-1 (Sec. 2.4.1) and the S23-based selection/efficiency and QUSJ luminosity models. This is not circular: p_lim is a parameter-free external calibration of detector completeness from S23, with public grbpop code, and it is not fitted to the DTD or to the delay-time result. The paper also provides two independent anchors: (i) the W15* reproduction (Appendix A), using W15's own sample and selection model, recovers the external long-delay result, showing that the framework is not rigged to produce short delays; and (ii) the Sec. 4.1 injection test is a controlled simulation with known truth, in which the complete-sample inference recovers the true average delay, validating the pipeline, while lower-threshold runs demonstrate the bias direction. The mismatch between the injected truth (alpha_tau = 1, <tau_d> = 2.78 Gyr) and the inferred regime (alpha_tau ~ 3, <tau_d> ~ 160 Myr) is a limitation on the quantitative demonstration of bias magnitude, but it is not a circular reduction. No equation or fitted parameter reduces to the input by construction, so no circular step is identified.
Axiom & Free-Parameter Ledger
free parameters (9)
- α_τ (power-law DTD slope) =
3.33^{+1.40}_{-1.44} (ELF); 3.08^{+1.70}_{-1.44} (QUSJ)
- τ_min^d (minimum delay) =
0.08^{+0.27}_{-0.07} Gyr (ELF); 0.03^{+0.23}_{-0.02} Gyr (QUSJ)
- μ_τ (log-normal median delay) =
0.07^{+0.41}_{-0.05} Gyr (ELF); 0.09^{+0.59}_{-0.07} Gyr (QUSJ)
- σ_τ (log-normal dispersion) =
0.30^{+2.16}_{-0.28} (ELF); 0.14^{+1.59}_{-0.13} (QUSJ)
- ELF luminosity-function params (α_BPL, β_BPL, γ_BPL, L*, L**, L0) =
α_BPL≈0.8, β_BPL≈2.1-2.5, log10 L*/erg s^-1≈52.8-53.0; L0, L** span priors
- QUSJ jet params (θ_c, θ_w, α_L, β_L, L*_c, A, E*_p,c, α_Ep, β_Ep) =
θ_c≈2.6-3.1°, θ_w≈61-66°, α_L≈4.7-5.1, A≈2.7-2.8
- R0 (local SGRB rate density) =
log10(R0/Gpc^-3 yr^-1) ≈ 2.1^{+1.8}_{-1.2} (ELF pow); 2.7^{+0.7}_{-0.8} (QUSJ pow)
- p_lim,GBM (flux-completeness threshold) =
3.5 cm^-2 s^-1
- CSFH parameters (Madau & Fragos 2017) =
a=2.6, b=6.2, z=2.2
axioms (8)
- domain assumption SGRBs predominantly trace compact-binary (BNS/NSBH) mergers
- domain assumption Madau & Fragos (2017) CSFH with fixed parameters
- domain assumption Power-law or log-normal DTD adequately represent the population
- domain assumption Hard-threshold selection function matches true efficiency at/above p_lim
- domain assumption Redshift distribution independent of L and E_p
- domain assumption Flat Planck-2014 cosmology
- domain assumption GRB 170817A priors (luminosity, E_p, viewing angle) constrain the faint/off-axis population
- standard math Bayesian hierarchical formalism of Mandel et al. (2019)
read the original abstract
Short gamma-ray bursts (SGRBs) are thought to be primarily associated with binary neutron star (BNS) mergers. The SGRB population can therefore be scrutinized to look for signatures of the delay time between the formation of the progenitor massive star binary and the eventual merger, which could produce an evolution of the cosmic rate density of such events whose shape departs from that of the cosmic star formation history (CSFH). To that purpose, we study a large sample of SGRBs within a hierarchical Bayesian framework, with a particular focus on the delay time distribution (DTD) of the population. Following previous studies, we model the DTD either as a power-law with a minimum time delay or as a log-normal function. We consider two models for the intrinsic SGRB luminosity distribution: an empirical luminosity function (ELF) with a doubly broken power-law shape, and one based on a quasi-universal structured jet (QUSJ) model. Regardless of the chosen parametrization, we find average time delays $10\lesssim \langle \tau_\mathrm{d}\mathrm\rangle/\mathrm{Myr}\lesssim 800$ and a minimum delay time $\tau_\mathrm{d,min}\lesssim 350\,\mathrm{Myr}$, in contrast with previous studies that found long delay times of few Gyr. We demonstrate that the cause of the longer inferred time delays in past studies most likely resides in an incorrect treatment of selection effects.
Figures


Forward citations
Cited by 7 Pith papers
-
Fast Radio Bursts Trace Cosmic Star Formation with Little Delay
Hierarchical Bayesian analysis of CHIME/FRB finds the FRB volumetric rate peaks with the cosmic star-formation history at mean delays of 0.1–0.3 Gyr, consistent with zero delay and ruling out multi-Gyr merger-like delays.
-
Binary Neutron Star Merger Evolution and r-Process Enrichment in the Milky Way Disk
Binary neutron star mergers with evolving merger rates or yields are strongly preferred over constant scenarios to explain Milky Way r-process enrichment, with Bayes factors exceeding 10^20, yet remain in tension with...
-
Double Neutron Star Delay Times Across Cosmic Metallicities: The Role of Helium Star Progenitors
Simulations show double neutron star mergers peak 80-250 million years after star formation across metallicities, with 15% quick mergers and over 20% delayed over a billion years.
-
Diverse Morphologies of GRB X-Ray Plateaus within a Common Magnetar Framework
A hierarchical fit of 185 GRB X-ray plateaus finds no statistical need for distinct magnetar populations behind rising, flat, and decaying plateau shapes.
-
Double Neutron Star Delay Times Across Cosmic Metallicities: The Role of Helium Star Progenitors
Population synthesis of helium star-NS systems yields DNS delay time distributions that peak between 80-250 Myr across metallicities, with 15% merging within 80 Myr and over 20% after 1 Gyr.
-
Implications of low neutron star merger rates for gamma-ray bursts, r-process production and Galactic double neutron stars
Lower BNS merger rates from GWTC-4 data produce tensions of factors 3.6-18 with SGRB rates, 0.9-4.1 with r-process rates, and 2.3-5.1 with Galactic DNS rates.
-
Wide Jets or Low Rates: Reconciling Short GRB and Gravitational-Wave Neutron Star Merger Rates
Latest GW neutron star merger rates are consistent with short GRBs being produced by BNS mergers if jets are wide or rates low, with NSBH mergers subdominant.
Reference graph
Works this paper leans on
-
[1]
G., Abouelfettouh, I., Acernese, F., & et al
Abac, A. G., Abouelfettouh, I., Acernese, F., & et al. 2025, arXiv e-prints, arXiv:2508.18083 Abbott, B. P., Abbott, R., Abbott, T. D., et al. 2017, ApJ, 848, L13 Abbott, R., Abbott, T. D., Acernese, F., et al. 2022, ApJ, 928, 186 Andrews, J. J. & Zezas, A. 2019, MNRAS, 486, 3213 Band, D., Matteson, J., Ford, L., et al. 1993, ApJ, 413, 281 Beniamini, P. &...
Pith/arXiv arXiv 2025
-
[2017]
original
is not featured in the W15 study, its trend is very similar to the one from Planck Collaboration et al. (2014), which is one of the models used for the analysis in W15 and referred to as SFR2. We therefore take into account this set of results from W15 to compare ours. The uncertainty taken into account on the median values is 1σas in W15, in order to mak...
2014
discussion (0)
Sign in with ORCID, Apple, or X to comment. Anyone can read and Pith papers without signing in.