REVIEW 3 major objections 6 minor 26 references
Accurate and precise optical phase sensor based on a non-linear quantum Sagnac interferometer
T0 review · 3 major / 6 minor · reviewed 2026-08-11 · deepseek-v4-flash
Pith's one-line read Putting a nonlinear crystal inside a Sagnac loop turns it into a self-stabilized phase sensor measuring chromatic dispersion more than an order of magnitude more precisely than prior methods.
desk verdict Genuinely new Sagnac-based dispersion sensor with clean theory and impressive repeatability, but the accuracy claim needs a quantitative loop calibration. read the letter →
The pith
A machine-rendered reading of the paper's core claim, the machinery that carries it, and where it could break.
The reading
What carries the argument
The machinery is the nonlinear Sagnac interferometer itself: a polarization Sagnac loop containing a pair of periodically poled lithium niobate waveguides that perform cascaded second-harmonic generation and spontaneous parametric down-conversion. The polarization basis of the beam splitter defines the two counter-propagating paths, and the relative phase between them is exactly the wavevector mismatch $(k_s+k_i-k_p)L$ accumulated in the sample, whose quadratic term is the chromatic dispersion. A half-wave plate inside the loop rotates the down-converted photons so both paths exit through the pump port, giving deterministic rather than 50% output, and the common-path geometry makes the interferometer self-stabilized against slow environmental drifts. Detection uses tunable bandpass filters and superconducting nanowire single-photon detectors to record the spectral coincidence fringes $P_c(\Delta\omega) \propto \mathrm{sinc}(\Delta k_c L_c/2)\,[1+V\cos(\Delta\phi)]$, and a fit of that fringe pattern extracts $\beta^{(2)}$.
What would settle it
Measure a second spool of the same fiber with a different length, subtract the extracted CD values, and check that the difference scales exactly with the length difference to within the quoted $7\times10^{-3}\,\%$ statistical error; any residual offset would reveal the loop's own dispersion and falsify the calibration assumption.
Extended reading notes
Core claim
The central discovery is that a Sagnac interferometer, normally insensitive to chromatic dispersion because reciprocal phases cancel, can be made sensitive to it by embedding a type-0 phase-matched nonlinear waveguide inside the loop. The pump is injected in a diagonal polarization state, so the polarizing beam splitter divides it into two counter-propagating paths; after one path passes through the sample and then undergoes second-harmonic generation followed by spontaneous parametric down-conversion, and the other path undergoes the same conversions before the sample, the two paths recombine as polarization-entangled photon pairs carrying the relative phase $\Delta\phi = (\beta^{(2)}\Delta\omega^2 + 2\beta^{(0)} - 2k_0)L$. Energy conservation $\Delta\omega_s = -\Delta\omega_i$ cancels all odd-order dispersion terms, an instance of non-local dispersion cancellation, so the spectral phase is quadratic with the second-order dispersion $\beta^{(2)}$ as its coefficient. Measuring the coincidence spectrum therefore yields the chromatic dispersion from a cosine fit, and repeating the measurement across pump wavelengths yields the third-order dispersion. The authors report a statistical error of $7\times10^{-3}\,\%$ on a 0.9\,\text{m} commercial fiber, an order-of-magnitude improvement over previous results, and argue the architecture is self-stabilized, deterministic, and fully fibered at telecom wavelengths.
Load-bearing premise
The load-bearing premise is that the Sagnac loop itself — the PPLN waveguides, fibers, circulator, and filters — contributes negligible chromatic dispersion compared with the sample, so the fitted quadratic phase is due entirely to the sample; the paper supports this only qualitatively, with no quantitative bound on the loop's residual dispersion.
Editorial extensions
If this is right
- Chromatic dispersion and third-order dispersion can be extracted from samples as short as a few centimeters, whereas classical phase-modulation and time-of-flight techniques typically need tens of meters to kilometers of fiber.
- The common-path Sagnac geometry removes the need for active phase-locking and polarization control, since reciprocal phase drifts cancel and polarization-maintaining fiber keeps the loop aligned.
- The phase-matching bandwidth of the crystals, not the sample length, sets the accessible dispersion range, so the same loop can measure short high-dispersion samples and long near-zero-dispersion fibers.
- Using a broad-band pump and recording the joint spectral intensity would extract CD and its derivatives in a single shot, limited only by the waveguide phase-matching bandwidth.
- Subtracting measurements of two different sample lengths would yield a calibration-free CD value, eliminating the systematic contribution of the loop itself.
Reading between the lines
- If the loop's residual dispersion is truly negligible, the same architecture should transfer to chip-scale platforms using third-order nonlinearities, shrinking the sensor to micrometer dimensions; the paper mentions this as a future direction but does not demonstrate it.
- The accuracy check against manufacturer specifications assumes the manufacturer's values are trustworthy; an independent comparison with a second measurement technique on the same fiber would close that gap.
- A quantitative bound on the loop's own dispersion, for example measuring two different lengths of the same fiber, would turn the qualitative 'no visible fringes' calibration statement into a hard systematic-error budget.
- The single-shot JSI proposal implies the method could measure dispersion continuously across a wavelength range in one acquisition, a natural next experiment to test the approach.
Editorial analysis
A structured set of objections, weighed in public.
Referee Report
Summary. The paper reports a quantum nonlinear Sagnac interferometer for optical phase measurements in the frequency domain, demonstrated on chromatic dispersion (CD) of a 0.9 m commercial polarization-maintaining dispersion-shifted fiber. The authors derive the two-photon interference phase from a cascaded SHG/SPDC process, giving a quadratic phase in detuning from which CD is extracted. They report CD = -81.654(6) ps/(km.nm) with a statistical error of 7e-3% over 100 repeated fits, and TOD = -0.26(1) ps/(nm^2.km) from a linear fit of CD versus pump wavelength. They claim state-of-the-art precision and accuracy, with both values falling inside the manufacturer's specifications.
Significance. The interferometric concept is elegant and potentially impactful: the Sagnac common-path geometry provides passive phase stability, the cascaded SHG/SPDC scheme avoids dual-wavelength components, and the polarization-entangled photon pairs yield deterministic output and non-local dispersion cancellation. The theoretical derivation of Eqs. (7)-(9) is clean, and the statistical characterization over 100 repeated fits is a real strength; a 7e-3% relative statistical error on CD, if confirmed, would be a strong precision result. The paper also gives a useful working-range analysis in Fig. 5. The main missing element is a quantitative system-calibration bound, which is required before the accuracy claim can be accepted. With that measurement added, the result would be a significant advance in quantum-assisted material characterization.
major comments (3)
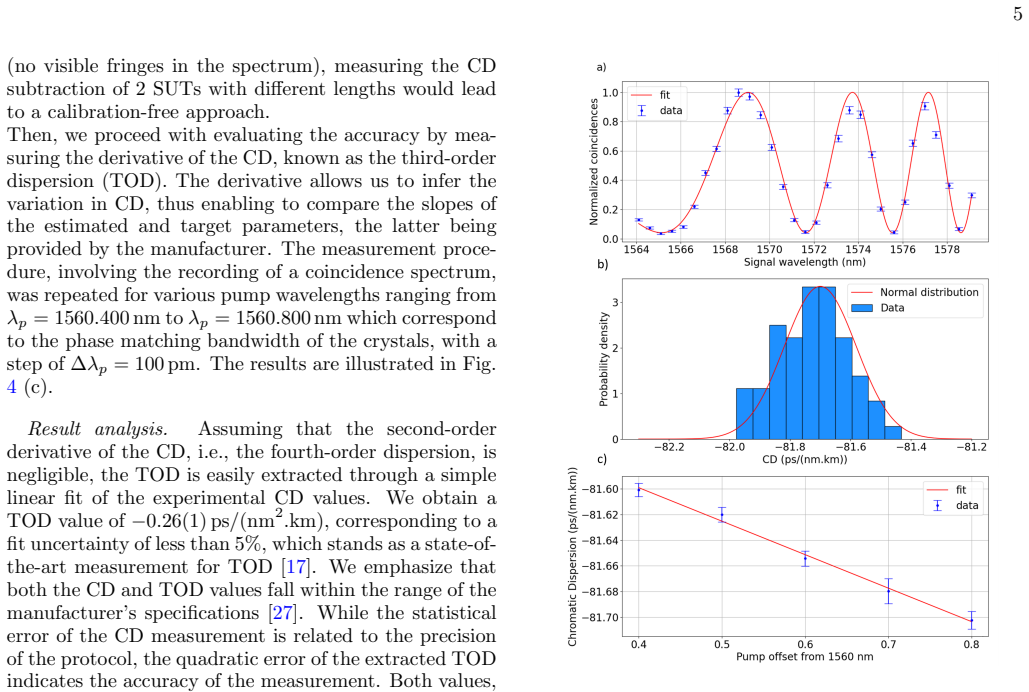
- [Section IV, Measurement results (Eq. 9)] The accuracy claim is not anchored because the loop's residual chromatic dispersion is only dismissed qualitatively. Eq. (9) describes the phase imprinted by the sample, but the physical loop also contains PM fiber, two PPLN waveguides, a WDM, and a circulator; the fitted phase is proportional to (β_SUT^(2) L_SUT + β_loop^(2) L_loop) Δω^2. The statement that the empty-loop calibration 'leads to an apparent negligible value (no visible fringes in the spectrum)' provides no quantitative upper bound on β_loop^(2) L_loop. Since the sample contribution is only -0.0735 ps/nm for L = 0.9 m and β^(2) = -81.654 ps/(km.nm), a loop dispersion of a few ps/(km.nm) over a few meters of fiber could be a significant bias, potentially much larger than the quoted statistical uncertainty of 7e-3%. Please report the empty-loop interferogram with the scan range, filter bandwidth, noise floor, and an upper bound on the residual phase excursion, or implement the two-length subtraction mentioned in the same paragraph. Without this, the word 'accurate' in the central claim is not supported.
- [Section IV, Result analysis] The TOD-based accuracy assessment does not close the systematic-error budget. The text states that accuracy is indicated by the quadratic error of the TOD and that both CD and TOD fall within manufacturer specifications. Agreement with a manufacturer data sheet is an external consistency check, not an independent calibration, and the vendor tolerance is not quoted; moreover, a constant loop offset would not appear in the slope of CD versus pump wavelength, so the TOD comparison does not validate the absolute CD scale. The TOD is also obtained from a linear fit over five points spanning 0.4 nm under the assumption that fourth-order dispersion is negligible; please provide fit residuals, the manufacturer's specified range, and a propagation of the loop-calibration uncertainty into the TOD slope. As written, the 'accuracy' claim is overstated relative to the evidence.
- [Section I and Section IV] The claim that the measured statistical error shows 'more than one order of magnitude' improvement over state-of-the-art measurements is not supported by a quantitative comparison. Reference [14] is cited, but no previous precision values are listed for classical or quantum CD measurements. Please add a table or explicit numbers so the reader can verify the improvement; otherwise soften the claim.
minor comments (6)
- [Abstract] The phrase 'more that one order of magnitude' should read 'more than one order of magnitude,' and the term 'quadratic error' should be defined (relative fit error of the TOD?) when first used.
- [Fig. 4 caption] The caption says the CD histogram is taken at λp = 1560.800 nm, while the main text reports λp = 1560.600 nm for the CD measurement; please correct the discrepancy.
- [Eq. (9)] The statement that Eq. (9) differs from Eq. (7) only in the phase offset is confusing because the linear term changes from kp to 2k0; define k0 and clarify the relation to the pump frequency in the cascaded scheme.
- [Section IV] The phrase 'no visible fringes in the spectrum' should be replaced with a quantitative statement (scan range, filter bandwidth, and contrast limit), not only in the response to the major comment but also in the text.
- [References] Reference [26] is identical to Reference [15]; please remove the duplicate.
- [Conclusion] The typo 'SU-Ture' in the final paragraph should be corrected to 'future.'
Circularity Check
No circular derivation: CD and TOD are extracted by fitting an independently derived phase model and benchmarked against an external manufacturer specification.
full rationale
The measurement chain is self-contained. The relative phase in Eq. 9, Delta-phi = beta^(2) Delta-omega^2 L + offset, is derived from the wavevector Taylor expansion and energy conservation; the chromatic dispersion beta^(2) is a free parameter of the fit to the measured coincidence spectrum (Eq. 10), not an input inserted to generate the prediction. The TOD is obtained as the slope of the CD values versus pump wavelength, i.e., a derivative of the fitted quantity, and is then compared with an external manufacturer specification [27], which is an independent benchmark. Self-citations [14,15,26] are used for literature context, prior demonstrations, and technical choices (e.g., Poissonian statistics limit); none of these carries the derivation, and the core dispersion-cancellation argument is grounded in Eq. 6 and the standard SPDC energy-conservation relation. The manuscript's own caveat that loop residual dispersion is only bounded qualitatively ('no visible fringes') is a legitimate systematic-accuracy limitation, not a circular step: it concerns whether the fitted phase is attributable solely to the SUT, not whether the fitted value was used as an input. Accordingly, no equation reduces to its inputs by construction and no prediction is statistically forced by a fitted parameter.
Assumptions & free parameters
free parameters (3)
- Beta^(2) (CD of SUT) =
-81.654(6) ps/(km.nm)
- Visibility V
- Phase offset phi_off
assumptions (4)
- standard math Energy conservation in degenerate SPDC gives Delta_omega_s = -Delta_omega_i, so odd-order dispersion terms vanish (non-local dispersion cancellation).
- domain assumption Fourth-order dispersion is negligible over the pump tuning range, making CD a linear function of wavelength.
- ad hoc to paper The intrinsic chromatic dispersion of the Sagnac loop (crystals, fibers, components) without the SUT is negligible.
- domain assumption SPDC brightness and phase are equal for the two counter-propagating paths.
Cite this review
Pith. "Pith review of Accurate and precise optical phase sensor based on a non-linear quantum Sagnac interferometer." pith.science (2026). https://pith.science/paper/HK2AWS3J
@misc{pith2026241213744,
  author       = {Pith},
  title        = {Pith review of: Accurate and precise optical phase sensor based on a non-linear quantum Sagnac interferometer},
  year         = {2026},
  howpublished = {\url{https://pith.science/paper/HK2AWS3J}},
  note         = {Machine review of arXiv:2412.13744}
}
abstract
Optical phase measurements play a key role in the detection of macroscopic parameters such as position, velocity, and displacement. They also permit to qualify the microscopic properties of photonic waveguides such as polarization mode dispersion, refractive index difference, and chromatic dispersion. In the quest for ever-better measurement performance and relevance, we report an original quantum non-linear interferometer based on a Sagnac configuration allowing precise, accurate, self-stabilized, and reproductible optical phase measurement. The potential of this system is demonstrated through the measurement of second-order dispersion, namely chromatic dispersion, of a commercial dispersion-shifted fiber at telecommunication wavelength. We assess precision by exhibiting a statistical error of $7.10^{-3}\, \%$, showing more that one order of magnitude compares to state-of-the-art measurements. Additionally, the accuracy of the second-order dispersion value is determined through the measurement of the third-order dispersion, showing a quadratic error as low as 5\,\%. Our system promises the development of photonic-based sensors enabling the measurements of optical-material properties in a user-friendly manner.
Figures


Figures from the paper (2 more)

Reference graph
Works this paper leans on
- [14]
-
[1]
S. Daryanoosh, S. Slussarenko, D. W. Berry, H. M. Wise- man, and G. J. Pryde, Nat Commun 9, 4606 (2018)
work page 2018
-
[2]
LIGO op- erates with quantum noise below the Standard Quantum Limit,
W. Jia, V. Xu, K. Kuns, M. Nakano, L. Barsotti, M. Evans, N. Mavalvala, R. Abbott, I. Abouelfet- 7 touh, R. Adhikari, A. Ananyeva, S. Appert, K. Arai, N. Aritomi, S. Aston, M. Ball, S. Ballmer, D. Barker, B. Berger, J. Betzwieser, D. Bhattacharjee, G. Billings- ley, N. Bode, E. Bonilla, V. Bossilkov, A. Branch, A. Brooks, D. Brown, J. Bryant, C. Cahillane...
arXiv 2024
-
[3]
B. Ndagano, H. Defienne, D. Branford, Y. D. Shah, A. Lyons, N. Westerberg, E. M. Gauger, and D. Fac- cio, Nat. Photon. 16, 384 (2022)
work page 2022
-
[4]
A. F. Abouraddy, M. B. Nasr, B. E. A. Saleh, A. V. Sergienko, and M. C. Teich, Physical Review A 65 (2002)
work page 2002
-
[5]
Giovannetti, S
V. Giovannetti, S. Lloyd, and L. Maccone, Science 306, 1330 (2004)
2004
- [6]
- [7]
Show all 26 references
-
[8]
Grassani, M
D. Grassani, M. Galli, and D. Bajoni, Opt. Lett. 39, 2530 (2014)
2014
-
[9]
Culshaw, Measurement Science and Technology 17, R1 (2005)
B. Culshaw, Measurement Science and Technology 17, R1 (2005)
2005
-
[10]
M. Fink, F. Steinlechner, J. Handsteiner, J. P. Dowling, T. Scheidl, and R. Ursin, New Journal of Physics 21, 053010 (2019)
2019
-
[11]
G. P. Agrawal, Nonlinear fiber optics, 2nd ed., Optics and photonics (Academic Press, San Diego, 1995)
1995
-
[12]
Fasel, N
S. Fasel, N. Gisin, G. Ribordy, and H. Zbinden, The European Physical Journal D 30, 143 (2004)
2004
-
[13]
Shi and A
B.-S. Shi and A. Tomita, Physical Review A 69, 013803 (2004), publisher: American Physical Society
2004
-
[16]
J. D. Franson, Phys. Rev. A 45, 3126 (1992)
1992
-
[17]
Gr´ osz, A
T. Gr´ osz, A. P. Kov´ acs, M. Kiss, and R. Szip˝ ocs, Appl. Opt. 53, 1929 (2014)
2014
-
[18]
J. D. Franson, Phys. Rev. Lett. 62, 2205 (1989)
1989
-
[19]
D. Oser, S. Tanzilli, F. Mazeas, C. Alonso-Ramos, X. Le Roux, G. Sauder, X. Hua, O. Alibart, L. Vivien, E Cassan, and L. Labont´ e, npj Quantum Inf 6, 31 (2020)
2020
-
[20]
Baker, Y
C. Baker, Y. Lu, and X. Bao, Opt. Express 22, 22314 (2014)
2014
-
[21]
Page and L
V. Page and L. R. Chen, Optics Communications 265, 161 (2006)
2006
-
[22]
Bogaerts, P
W. Bogaerts, P. De Heyn, T. Van Vaerenbergh, K. De Vos, S. Kumar Selvaraja, T. Claes, P. Dumon, P. Bienstman, D. Van Thourhout, and R. Baets, Laser & Photonics Reviews 6, 47 (2012)
2012
-
[23]
Cabrejo-Ponce, C
M. Cabrejo-Ponce, C. Spiess, A. L. M. Muniz, P. Ancsin, and F. Steinlechner, Quantum Science and Technology 7, 045022 (2022)
2022
-
[24]
Repelin, E
Y. Repelin, E. Husson, F. Bennani, and C. Proust, Jour- nal of Physics and Chemistry of Solids 60, 819 (1999)
1999
-
[25]
Eraerds, N
P. Eraerds, N. Walenta, M. Legr´ e, N. Gisin, and H. Zbinden, New Journal of Physics 12, 063027 (2010)
2010
-
[26]
Dalidet, A
R. Dalidet, A. Martin, M. Riesner, S.-E. Ahmedou, R. Dauliat, B. Leconte, G. Walter, G. Sauder, J.-C. De- lagnes, G. Millot, P. Roy, R. Jamier, S. Tanzilli, and L. Labont´ e, Phys. Rev. Appl.20, 024026 (2023)
2023
-
[27]
Thorlabs website: Polarization-maintaining dispersion- compensating fiber optic patch cables,
“Thorlabs website: Polarization-maintaining dispersion- compensating fiber optic patch cables,”
Reviewed August 11, 2026 · model on record in the stance chip above.
Discussion (0). Continue with ORCID to comment.