Identifying and Mitigating Systemic Measurement Bias in Production LLM Inference Benchmarks
Pith reviewed 2026-06-30 15:38 UTC · model grok-4.3
The pith
Modeling the LLM benchmark client as an M/G/1 queue shows that Python's GIL inflates TTFT and TPOT metrics with rising request rates.
A machine-rendered reading of the paper's core claim, the machinery that carries it, and where it could break.
Core claim
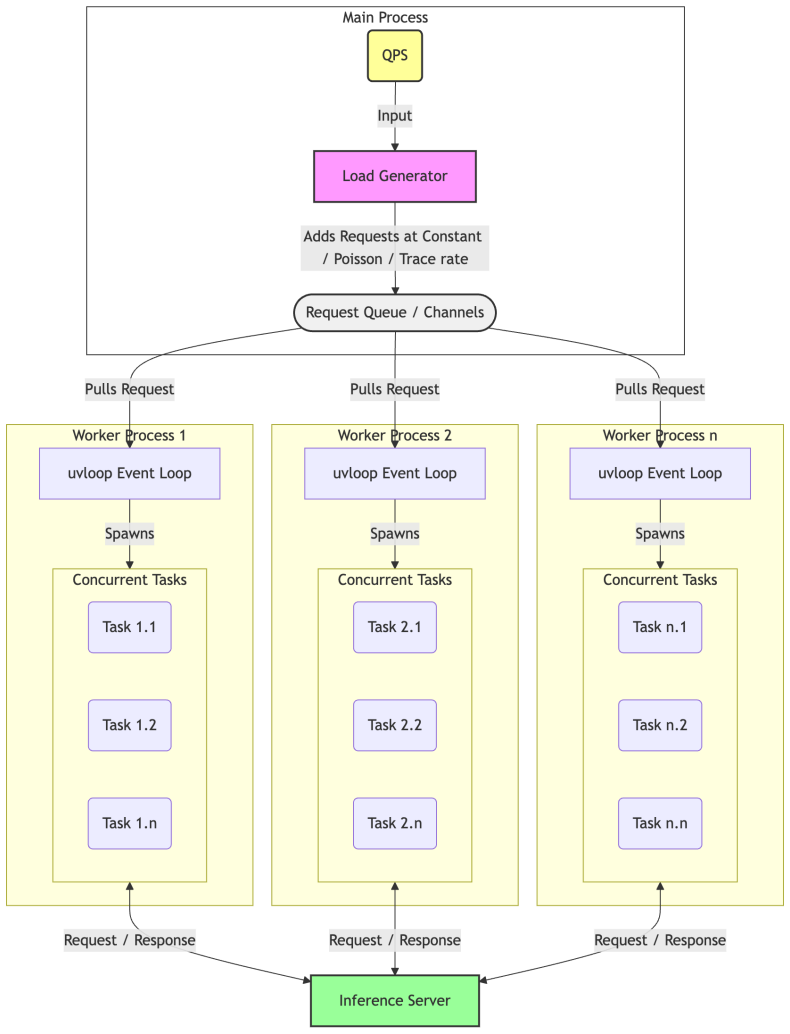
By representing the benchmarking client as an M/G/1 queue, the single-process asyncio design combined with the Python GIL is shown to produce queuing that systematically inflates TTFT and TPOT as request rates increase; a multi-process evaluation framework distributes client load to remove this overhead, and Normalized Time Per Output Token (NTPOT) is defined to normalize end-to-end latency including prefill and scheduling delays across sequence lengths, thereby isolating pure serving-engine performance at scales exceeding thousands of queries per second.
What carries the argument
M/G/1 queue model of the single-process asyncio benchmarking client, used to quantify GIL-induced inflation of TTFT and TPOT.
If this is right
- Reported TTFT and TPOT values in existing single-process benchmarks grow artificially with concurrency and therefore cannot be used directly for SLO verification at production scale.
- The multi-process client removes client queuing so that measured latencies reflect only the serving engine.
- NTPOT supplies a single comparable figure that accounts for prefill plus decode costs across different output lengths.
- Accurate profiling at thousands of queries per second becomes feasible without the previous client-side distortion.
Where Pith is reading between the lines
- Benchmark results obtained with single-process clients may have led to overstated capacity requirements when planning LLM deployments.
- The same M/G/1 client analysis could be applied to other single-threaded or lock-contended benchmark harnesses to check for analogous measurement artifacts.
- NTPOT may shift optimization priorities toward engines that keep both prefill and decode phases balanced rather than optimizing only one.
Load-bearing premise
The single-process asyncio architecture and its GIL contention constitute the dominant source of measurement bias, and the M/G/1 model captures client behavior without large unmodeled effects from network, OS scheduling, or server internals.
What would settle it
Run the same high-rate workload with both the original single-process client and the proposed multi-process client; if the measured TTFT and TPOT difference fails to grow with request rate or if the multi-process version does not materially reduce the reported latencies, the claimed source of bias is not supported.
Figures
read the original abstract
As Large Language Models (LLMs) transition from research environments to production deployments, evaluating their performance against strict Service Level Objectives (SLOs) has become critical. However, current evaluation methodologies suffer from severe measurement bias at scale. We demonstrate that widely used benchmarking utilities rely on single-process, asyncio-driven architectures that introduce fundamental client-side queuing bottlenecks under high concurrency. By modeling the benchmarking client as an $M/G/1$ queue, we mathematically demonstrate how the Python Global Interpreter Lock (GIL) artificially inflates Time to First Token (TTFT) and Time Per Output Token (TPOT) metrics as request rates scale. To resolve this systematic inaccuracy, we propose an unbiased, multi-process evaluation framework that effectively distributes client-side load, ensuring negligible queuing overhead. Furthermore, we formalize a composite metric, Normalized Time Per Output Token (NTPOT), to robustly amortize end-to-end latency, including prefill and scheduling delays across sequence lengths. Our empirical evaluation demonstrates that this methodology successfully isolates pure serving engine performance, enabling accurate, reproducible profiling of LLMs at production scales exceeding thousands of queries per second.
Editorial analysis
A structured set of objections, weighed in public.
Referee Report
Summary. The paper claims that widely-used single-process asyncio LLM benchmarking clients introduce client-side queuing due to the Python GIL, which inflates TTFT and TPOT metrics at scale; this is shown by modeling the client as an M/G/1 queue. It proposes a multi-process framework to eliminate the bias and introduces the NTPOT composite metric to better amortize latency across sequence lengths, with empirical results claimed to isolate pure serving-engine performance at high QPS.
Significance. If the modeling and empirical claims hold after addressing the separation of effects, the work would be significant for production LLM evaluation by highlighting a systematic bias in common tools and offering a concrete mitigation. The application of queueing theory to derive the bias mechanism is a positive aspect that could improve reproducibility of high-scale benchmarks.
major comments (2)
- [M/G/1 modeling section] The M/G/1 modeling of the client (described in the abstract and modeling section) attributes TTFT/TPOT inflation specifically to GIL-induced queuing, but provides no indication that the service-time distribution or arrival process subtracts or bounds contributions from network stack delays, OS thread scheduling for sockets, or serving-engine batching/queuing; if any of these scale with request rate, the mathematical demonstration no longer isolates the GIL as the primary source.
- [Empirical evaluation] The empirical evaluation section asserts that the multi-process framework 'successfully isolates pure serving engine performance,' but the abstract gives no details on controls, error analysis, or direct comparison to the M/G/1 predictions that would confirm other unmodeled factors are negligible.
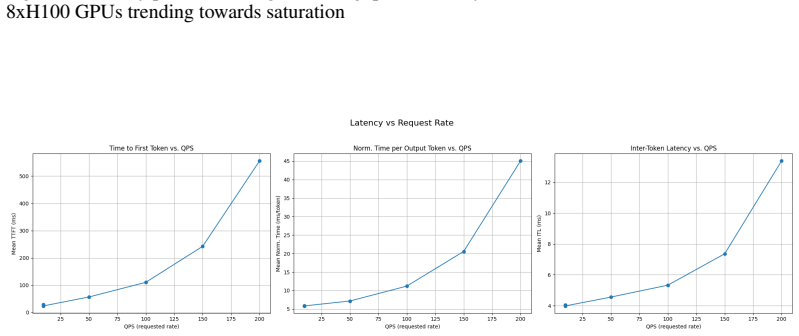
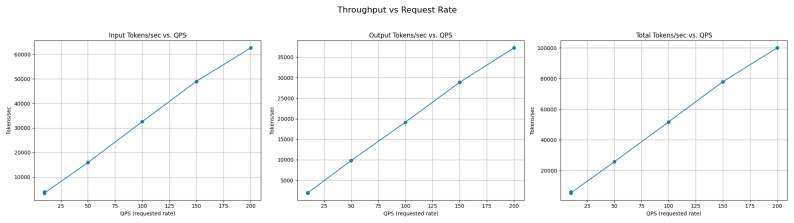
minor comments (2)
- The definition and formula for the proposed NTPOT metric should be stated explicitly rather than described only at a high level.
- The abstract would benefit from a brief statement of the specific models, hardware, and request-rate ranges used in the empirical validation.
Simulated Author's Rebuttal
We thank the referee for their insightful comments on our work. We have addressed each major comment point by point below, making revisions to the manuscript where necessary to clarify the modeling assumptions and empirical controls.
read point-by-point responses
-
Referee: [M/G/1 modeling section] The M/G/1 modeling of the client (described in the abstract and modeling section) attributes TTFT/TPOT inflation specifically to GIL-induced queuing, but provides no indication that the service-time distribution or arrival process subtracts or bounds contributions from network stack delays, OS thread scheduling for sockets, or serving-engine batching/queuing; if any of these scale with request rate, the mathematical demonstration no longer isolates the GIL as the primary source.
Authors: The M/G/1 model specifically represents the client process under GIL constraints, where the 'service time' is the time to process each request in the single-threaded event loop. Factors like network delays and serving-engine batching are external to the client model and are held constant across our single-process and multi-process experiments. The key insight is the differential impact: the multi-process framework removes the GIL queuing while preserving other conditions. To address the referee's valid point on bounding, we have revised the modeling section to include an analysis showing that non-GIL delays do not scale in the same way and that the observed bias matches the M/G/1 prediction for GIL-induced queuing. We have also added a note on the assumptions regarding arrival process being Poisson. revision: partial
-
Referee: [Empirical evaluation] The empirical evaluation section asserts that the multi-process framework 'successfully isolates pure serving engine performance,' but the abstract gives no details on controls, error analysis, or direct comparison to the M/G/1 predictions that would confirm other unmodeled factors are negligible.
Authors: We appreciate this observation. Although the abstract is concise, the empirical section in the manuscript includes comparisons, but we agree more explicit details are warranted. In the revised manuscript, we have augmented the empirical evaluation with: detailed description of experimental controls (e.g., dedicated hardware, local network to minimize external latency), statistical error analysis including confidence intervals from repeated trials, and figures directly overlaying empirical results with M/G/1 model predictions to demonstrate close agreement and negligible contribution from unmodeled factors at the tested scales. These changes confirm the isolation of serving engine performance. revision: yes
Circularity Check
No circularity: applies standard M/G/1 model and proposes independent framework
full rationale
The paper applies the established M/G/1 queueing model to the single-process asyncio client to analyze GIL effects on TTFT/TPOT, then proposes a multi-process evaluation framework and NTPOT metric as mitigations. No steps reduce by construction to fitted parameters, self-definitions, or author self-citations; the queueing analysis uses external theory, and the empirical claims rest on the proposed architecture rather than tautological renaming or imported uniqueness. The derivation chain is self-contained against external benchmarks.
Axiom & Free-Parameter Ledger
axioms (1)
- domain assumption Benchmarking client can be modeled as an M/G/1 queue
Reference graph
Works this paper leans on
-
[1]
Efficient Memory Management for Large Language Model Serving with PagedAttention
Woosuk Kwon, Zhuohan Li, Siyuan Zhuang, Ying Sheng, Lianmin Zheng, Cody Hao Yu, Joseph Rostaing, Hao Zhang, and Ion Stoica. vllm: Easy, fast, and cheap llm serving with pagedattention.arXiv preprint arXiv:2309.06180, 2023
work page internal anchor Pith review Pith/arXiv arXiv 2023
-
[2]
SGLang: Efficient Execution of Structured Language Model Programs
Lianmin Zheng, Li Li, Hao Zhang, Yonghao Zhuang, Zhijie Chen, Yanping Huang, Meredith Ringel Morris, Joseph E. Gonzalez, and Ion Stoica. Sglang: Efficient execution of structured language model programs.arXiv preprint arXiv:2312.07104, 2023
work page internal anchor Pith review Pith/arXiv arXiv 2023
-
[3]
Tensorrt-llm (version 1.0)
NVIDIA. Tensorrt-llm (version 1.0). GitHub repository, 2023. URL https://github.com/NVIDIA/ TensorRT-LLM
2023
-
[4]
Text generation inference
Hugging Face. Text generation inference. GitHub repository, 2023. URL https://github.com/ huggingface/text-generation-inference
2023
-
[5]
vllm benchmarks
vLLM Team. vllm benchmarks. GitHub repository, 2023. URL https://github.com/vllm-project/ vllm/tree/main/benchmarks
2023
-
[6]
Inference x, 2025
Semi Analysis. Inference x, 2025. URLhttps://inferencex.semianalysis.com/
2025
-
[7]
Genai-perf
NVIDIA. Genai-perf. part of triton inference server. GitHub repository, 2024. URL https://github. com/triton-inference-server/perf_analyzer/tree/main/genai-perf
2024
-
[8]
E. J. Hu, Y . Shen, P. Wallis, Z. Allen-Zhu, Y . Li, S. Wang, L. Wang, and W. Chen. Lora: Low-rank adaptation of large language models. InInternational Conference on Learning Representations (ICLR), 2022
2022
-
[9]
Jaiswal, K
S. Jaiswal, K. Jain, Y . Simmhan, A. Parayil, A. Mallick, R. Wang, R. S. Amant, C. Bansal, V . Ruhle, A. Kulkarni, and S. Kofsky. Sageserve: Optimizing llm serving on cloud data centers with forecast aware auto-scaling.Proceedings of the ACM on Measurement and Analysis of Computing Systems, 9(3):1–24, 2025
2025
-
[10]
Zhong, S
Y . Zhong, S. Liu, J. Chen, J. Hu, Y . Zhu, X. Liu, X. Jin, and H. Zhang. Distserve: Disaggregating prefill and decoding for goodput-optimized large language model serving. In18th USENIX Symposium on Operating Systems Design and Implementation (OSDI 24), pages 193–210, 2024
2024
-
[11]
Patel, E
P. Patel, E. Choukse, C. Zhang, A. Shah, Í. Goiri, S. Maleki, and R. Bianchini. Splitwise: Efficient generative llm inference using phase splitting. InProceedings of the 51st Annual International Symposium on Computer Architecture (ISCA), pages 118–132, 2024
2024
-
[12]
Megatron-LM: Training Multi-Billion Parameter Language Models Using Model Parallelism
M. Shoeybi, M. Patwary, R. Puri, P. LeGresley, J. Casper, and B. Catanzaro. Megatron-lm: Training multi-billion parameter language models using model parallelism.arXiv preprint arXiv:1909.08053, 2019
work page internal anchor Pith review Pith/arXiv arXiv 1909
- [14]
-
[15]
PyTorch Distributed: Experiences on Accelerating Data Parallel Training
Shen Li, Yanli Zhao, Rohan Varma, Omkar Salpekar, Pieter Noordhuis, Teng Li, Adam Paszke, Jeff Smith, Brian Vaughan, Pritam Damania, and Soumith Chintala. Pytorch distributed: Experiences on accelerating data parallel training.arXiv preprint arXiv:2006.15704, 2020. URL https://arxiv.org/abs/2006. 15704
work page internal anchor Pith review Pith/arXiv arXiv 2006
-
[16]
GShard: Scaling Giant Models with Conditional Computation and Automatic Sharding
D. Lepikhin, H. Lee, Y . Xu, D. Chen, O. Firat, Y . Huang, M. Krikun, N. Shazeer, and Z. Chen. Gshard: Scal- ing giant models with conditional computation and automatic sharding.arXiv preprint arXiv:2006.16668, 2020. 10
work page internal anchor Pith review Pith/arXiv arXiv 2006
-
[17]
Outrageously Large Neural Networks: The Sparsely-Gated Mixture-of-Experts Layer
N. Shazeer, A. Mirhoseini, K. Maziarz, A. Davis, Q. Le, G. Hinton, and J. Dean. Outrageously large neural networks: The sparsely-gated mixture-of-experts layer.arXiv preprint arXiv:1701.06538, 2017
work page internal anchor Pith review Pith/arXiv arXiv 2017
-
[18]
V . J. Reddi et al. Mlperf inference benchmark. In2020 ACM/IEEE 47th Annual International Symposium on Computer Architecture (ISCA), pages 446–459. IEEE, 2020. doi: 10.1109/ISCA45697.2020.00045
-
[19]
Mlperf v4.0 llm benchmarks, 2024
MLCommons. Mlperf v4.0 llm benchmarks, 2024. URL https://mlcommons.org/2024/03/ mlperf-inference-v4/
2024
-
[20]
Inference x competitive benchmarks, 2025
Semi Analysis. Inference x competitive benchmarks, 2025. URL https://newsletter.semianalysis. com/p/inferencemax-open-source-inference
2025
-
[21]
Artificial analysis providers leaderboard, 2025
Artificial Analysis. Artificial analysis providers leaderboard, 2025. URL https:// artificialanalysis.ai/leaderboards/providers
2025
-
[22]
Llm perf: A tool for the performance evaluation of llm apis
Ray Project. Llm perf: A tool for the performance evaluation of llm apis. GitHub repository, 2025. URL https://github.com/ray-project/llmperf
2025
-
[23]
k6: Open-source load testing tool, 2021
Grafana Labs. k6: Open-source load testing tool, 2021. URLhttps://k6.io/
2021
-
[24]
Locust: An open source load testing tool, 2011
Jonatan Heyman, Carl Byström, Joakim Hamrén, Hugo Heyman, and Lars Holmberg. Locust: An open source load testing tool, 2011. URLhttps://locust.io/
2011
-
[25]
SGLang benchmarking utilities
SGL-Project Team. SGLang benchmarking utilities. GitHub repository, 2024. URL https://github. com/sgl-project/sglang/tree/main/benchmark
2024
-
[26]
Guidellm: Scalable inference and optimization for large language models
Neural Magic, Inc. Guidellm: Scalable inference and optimization for large language models. GitHub repository, 2024. URLhttps://github.com/vllm-project/guidellm
2024
-
[27]
NVIDIA. Ai perf. GitHub repository, 2024. URLhttps://github.com/ai-dynamo/aiperf
2024
-
[28]
Inference Perf
Kubernetes SIGs. Inference Perf. GitHub repository, 2026. URL https://github.com/ kubernetes-sigs/inference-perf
2026
-
[29]
Wiley-Interscience, New York, NY , 1975
Leonard Kleinrock.Queueing Systems, V olume 1: Theory. Wiley-Interscience, New York, NY , 1975. ISBN 978-0471491101
1975
-
[30]
Samuel Williams, Andrew Waterman, and David Patterson. Roofline: an insightful visual performance model for multicore architectures.Communications of the ACM, 52(4):65–76, 2009. doi: 10.1145/1498765. 1498785
-
[31]
Transformer inference arithmetic, 2022
Carol Chen. Transformer inference arithmetic, 2022. URL https://kipp.ly/blog/ transformer-inference-arithmetic/
2022
-
[32]
Llm-d inference simulator
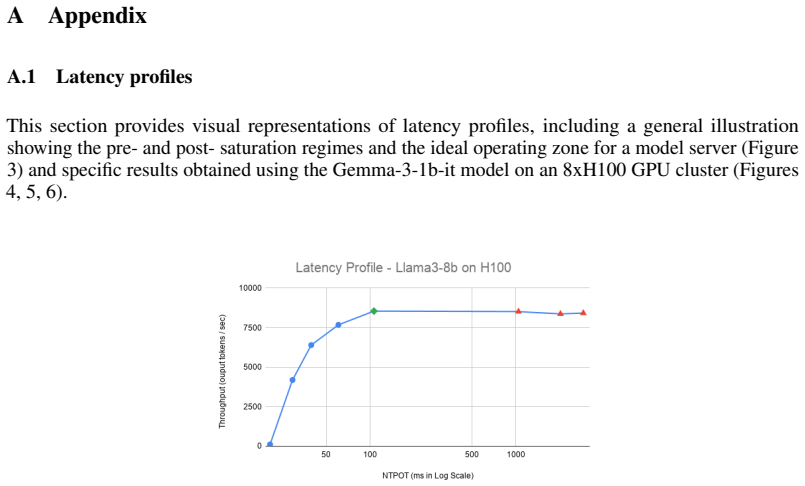
LLM-D Team. Llm-d inference simulator. GitHub repository, 2026. URLhttps://github.com/llm-d/ llm-d-inference-sim. 11 A Appendix A.1 Latency profiles This section provides visual representations of latency profiles, including a general illustration showing the pre- and post- saturation regimes and the ideal operating zone for a model server (Figure
2026
-
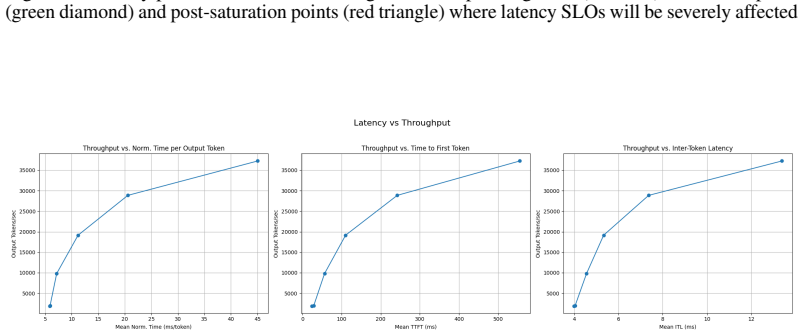
[33]
and specific results obtained using the Gemma-3-1b-it model on an 8xH100 GPU cluster (Figures 4, 5, 6). Figure 3: Latency profile illustration showing the ideal operating zone (blue dot), saturation point (green diamond) and post-saturation points (red triangle) where latency SLOs will be severely affected Figure 4: Latency profile showing the throughput ...
discussion (0)
Sign in with ORCID, Apple, or X to comment. Anyone can read and Pith papers without signing in.