REVIEW 3 major objections 5 minor 1 cited by
CO2 infrared spectra on silicate dust grain analogs: Implications for JWST observations
T0 review · 3 major / 5 minor · reviewed 2026-08-06 · deepseek-v4-flash
Pith's one-line read CO2 ice on silicate grains can produce the JWST 13CO2 double peak at about 70 K.
desk verdict A useful lab result with a plausible but not yet airtight link to the JWST 13CO2 double peak. read the letter →
The pith
A machine-rendered reading of the paper's core claim, the machinery that carries it, and where it could break.
The reading
What carries the argument
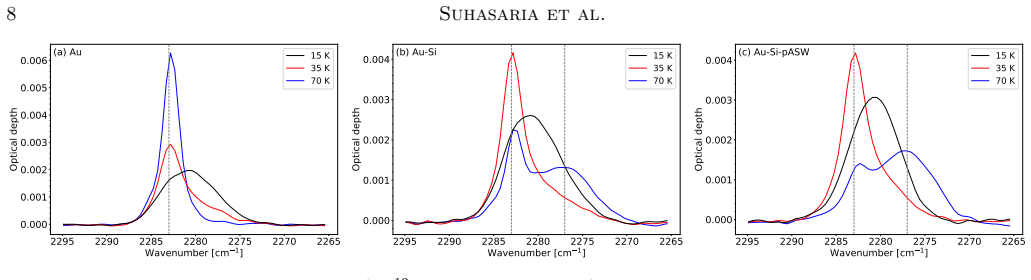
The central object is the layered laboratory sample: a 100 nm porous amorphous MgFeSiO4 film (90% porosity, about 1000 m$^2$ g$^{-1}$, made of 4--8 nm grains) on a gold-plated copper disk, with CO2 deposited on top either directly or on about 10 ML of polar or apolar ice. The work uses reflection absorption infrared spectroscopy at 78$^\circ$ grazing incidence with p-polarized light and connects the observed $\nu_3$ band of 13CO2 (near 2280 cm$^{-1}$, with the split at 2276 and 2283 cm$^{-1}$) to the relaxation of the metal surface selection rule: the silicate film weakens the LO mode and brings out the TO mode. The 13CO2 split itself is the load-bearing diagnostic: it appears only when the silicate layer is present, grows with warming between 60 and 75 K, and is used as the marker of the onset of diffusion, which the paper then matches against archival JWST NIRSpec optical depth spectra.
What would settle it
A decisive test would be to measure the 13CO2 $\nu_3$ band in transmission for CO2 deposited on the same amorphous MgFeSiO4 grains without any metal backing, at 60--75 K; if the 2276 cm$^{-1}$ shoulder and double peak do not appear there, the feature is at least partly a reflection-geometry artifact. A second check is to anneal the silicate film to remove porosity and see whether the split disappears or shifts.
Extended reading notes
Core claim
The paper reports three interconnected experimental findings from reflection absorption infrared spectroscopy of CO2 deposited on a gold-plated substrate with and without a 100 nm amorphous MgFeSiO4 film. First, the silicate film suppresses the longitudinal optical mode at 2363 cm$^{-1}$ that dominates on bare gold and enhances the transverse optical mode near 2341 cm$^{-1}$, showing that the metal surface selection rule is relaxed on the dust grain analog; water ice layers of up to 80 ML on gold do not achieve this. Second, the underlying ice layer changes the structural ordering of CO2: on CO ice the CO2 is already ordered at 15 K, on CH4 the transition occurs at 25--30 K, and on crystalline water it is delayed to about 45 K compared with about 35 K on other surfaces. Third, during warming of about 7 ML CO2 on bare or ice-covered silicate, the 13CO2 feature grows a new peak at 2276 cm$^{-1}$ at 60 K and becomes a double peak at 75 K; this split is absent on gold and is interpreted as a marker for the onset of CO2 diffusion on silicate. The paper states that each laboratory component shows this distinct double-peaked profile, so the split can be attributed to the grain surface alone and need not invoke CO2 mixed in polar ices at high temperatures.
Load-bearing premise
The experiment assumes that a 100 nm porous silicate film on gold reproduces the infrared behavior of free-floating interstellar dust grains, even though the metal backing and the film's 90% porosity are not present in the astronomical case.
Editorial extensions
If this is right
- If the split 13CO2 feature is a general grain-surface effect, the double-peaked profile in JWST spectra of embedded protostars can be explained by CO2 ice on silicate dust near 70 K without requiring a mixture of warm CO2:CH3OH and CO2:H2O components.
- CO2 desorbing later from silicate grains (about half retained to 88 K, with complete desorption between 115 and 120 K, versus full loss by about 90 K on gold) implies CO2 stays in the solid phase longer during protostellar warm-up, increasing its availability for grain-surface chemistry.
- A higher binding energy of CO2 on silicate grains would shift the CO2 snowline in protoplanetary disks to warmer radii than inferred from metal-surface or pure-ice laboratory data, potentially affecting planet formation chemistry.
- Because underlying CO and CH4 ices make CO2 order into crystalline ice at lower temperatures (15 K on CO, 25--30 K on CH4) than polar ices, layered ice structures can show crystalline CO2 features in regions where mixed polar ices would still be amorphous.
Reading between the lines
- If the 2276 cm$^{-1}$ shoulder is a genuine diffusion marker, the relative depth of the two 13CO2 peaks in astronomical spectra could become a temperature probe for the warm-up history of embedded ices, once the relationship between peak ratio and annealing time is calibrated.
- A cleaner test of the interpretation would be to record the same layered CO2/silicate samples in transmission geometry without a metal support, for example on a free-standing or infrared-transparent substrate, to confirm the split is not an artifact of the reflection geometry or the underlying gold.
- The dependence of the split on the film's high porosity suggests that the peak ratio might vary with grain morphology; if so, the same JWST data could constrain the porosity or surface area of interstellar silicates, not just their temperature.
- The desorption data imply binding energies higher than the usual CO2-ice values; if incorporated into disk chemical models, this would alter predictions of where CO2 sublimates and recondenses during planet formation.
Editorial analysis
A structured set of objections, weighed in public.
Referee Report
Summary. The paper reports reflection-absorption infrared (RAIRS) measurements of CO2 ice (1–7 ML) deposited on a bare gold surface, on a 100 nm amorphous MgFeSiO4 film on gold, and on that film covered by polar or apolar ices. The main results are: (i) the silicate film relaxes the metal surface selection rule, enhancing the TO component of the CO2 ν3 band; (ii) CO2 desorbs at higher temperatures on the silicate film than on bare gold; and (iii) a red shoulder at 2276 cm−1 appears at 60 K for CO2 on silicate and silicate+ice and develops into a double-peaked 13CO2 profile by 75 K, which the authors compare qualitatively with JWST observations of the 13CO2 feature toward HOPS 370 and IRAS 20126. The paper proposes that this double-peaked 13CO2 feature can be produced by CO2 on silicate dust grains near 70 K, providing an alternative to previous multi-component hot-ice interpretations.
Significance. If the split is a genuine surface property, the paper offers a new and simpler explanation of the 13CO2 double-peaked absorption toward embedded protostars, with possible implications for ice evolution and desorption in star-forming regions. The RAIRS data are systematic, the desorption-temperature difference between gold and silicate is a useful quantitative result, and the methodological point that silicate-coated metal substrates produce spectra closer to transmission mode is valuable. The authors also make their data available on Zenodo. However, the central astrophysical claim is currently supported only by a qualitative, arbitrary-scaled comparison using a highly porous, metal-backed film, so the significance is conditional on additional control experiments or modeling.
major comments (3)
- [§2.1 and §3.4.3] The 13CO2 split is demonstrated only for a 100 nm, ~90%-porous MgFeSiO4 film deposited on a gold-plated copper disk and measured in RAIRS. No control was performed with a compact or non-porous silicate film, with a different film thickness, or in a geometry without the metal backing. The red shoulder at 2276 cm−1 could therefore arise from CO2 molecules inside the connected pore network, from optical effects of the layered metal/film system, or from a temperature-dependent change in the effective-medium response, rather than from the molecular-scale interaction with a silicate surface. Because the main conclusion (Section 4) rests on this split being a general grain-surface property, the authors should provide either (a) the same experiment on a non-porous or much thinner silicate film, (b) a thickness or porosity series, or (c) a quantitative optical model that excludes an artifact of the RAIRS configuration.
- [§3.4.3] The phrase 'marker for the onset of diffusion' is an interpretation, not a measurement in this work. No diffusion coefficient, TPD trace, or coverage-dependent measurement is presented that directly links the 2276 cm−1 component to CO2 mobility. The citation to He et al. (2024) concerns diffusion on non-porous ASW, which is a different substrate and does not validate the assignment on a porous silicate. The authors should either measure the diffusion kinetics (e.g., via isothermal RAIRS or TPD) or rephrase the claim as observational, e.g., 'a spectral change whose origin requires further investigation.'
- [§4 and Fig. 6] The comparison with the JWST spectra is visual and uses an arbitrary scaling factor of 40; the laboratory FWHM at 70 K (~10.5 cm−1) is narrower than the observed FWHM of HOPS 370 (~12.5 cm−1) and IRAS 20126 (~13 cm−1), as the authors acknowledge. A claim that the observed profile can be explained without invoking multi-component hot ices requires a quantitative decomposition (e.g., least-squares fitting with laboratory spectra and a continuum) and a statement of residuals. As written, the resemblance is suggestive but does not rule out the previous three-component interpretation, and the statement that 'the effect can be attributed solely to the grain surface' is overstrong given the porous metal-backed configuration.
minor comments (5)
- [§2.2.2, Eq. (1)] The definition of θ is ambiguous: the text says 'the angle of incidence of the IR light with respect to the substrate,' but the setup uses a grazing incidence angle of 78°; please state explicitly that θ = 12° is the complement of the incidence angle measured from the surface normal.
- [§3.1, last paragraph] The sentence 'At 50 K, the TO mode remained unchanged and the LO mode is blue shifted to 2376 cm−1' refers to the silicate spectrum, but that 50 K spectrum is not shown in Figure 2; adding it would clarify the comparison.
- [§3.4.5] The text first states that 'desorption temperatures for ice layers on silicate films were not determined' and then states that 'most of CO and CH4 desorbs around 70 K' based on an upcoming manuscript; please clearly separate results reported here from results in preparation.
- [Figure 4 caption] The caption says 'vertical lines at close to LO and TO position provides a visual reference'; it should read 'positions provide.'
- [Figure 6] The H2 S(10) emission feature is mentioned in the text but is not marked in the figure; adding a marker or shaded band would help readers identify the region excluded from the comparison.
Circularity Check
No significant circularity: the 13CO2 split is an observed laboratory result compared qualitatively to JWST data; the self-citations document setup and prior diffusion work but are not load-bearing.
full rationale
This paper is an experimental study rather than a derivation. The new central claim—a red shoulder at 2276 cm−1 that develops into a double-peaked 13CO2 feature at around 70 K on bare and ice-covered silicate films—is presented as a measured spectrum (Section 3.4.3, Figure 5), not as a quantity derived from fitted parameters or from prior work. No parameter is fitted to the JWST observations: the comparison in Section 4 is qualitative, with laboratory spectra scaled by a constant and overplotted on the astronomical optical-depth spectra, and the earlier three-component fitting by Brunken et al. (2024) is cited as external context rather than used to construct the laboratory result. The self-citations (He et al. 2016, 2018, 2024; Suhasaria et al. 2017) document the instrument, prior CO2 spectral behavior on gold, and diffusion activity on amorphous water ice; citing these as background does not make the new silicate-surface observation equivalent to them. The paper explicitly contrasts the silicate surface with bare gold and reports that the split is absent on gold, so the observation has independent content. The skeptical concern that the 90%-porous, metal-backed RAIRS film may not faithfully represent free-floating interstellar grains is an experimental validity or correctness issue, not circularity, because the paper does not define the measured feature in terms of that assumption. No self-definitional reduction, no fitted input renamed as a prediction, and no author-imported uniqueness theorem appears in the argument. The score of 2 reflects only the presence of minor, non-load-bearing self-citations for experimental setup and prior diffusion results.
Assumptions & free parameters
free parameters (1)
- Display scaling factor for JWST comparison =
40
assumptions (4)
- domain assumption The 100 nm MgFeSiO4 film on a gold substrate is a representative analog of interstellar dust grains for the purpose of CO2 ice IR spectroscopy.
- domain assumption Band strengths from Bouilloud et al. (2015), measured in transmission, are valid for RAIRS column density estimates when combined with the geometric factor in Eq. (1).
- domain assumption The onset of diffusion for CO2 on silicate occurs above 60 K, based on prior work on non-porous ASW (He et al. 2024), and is the cause of the 13CO2 split.
- domain assumption Desorption temperatures measured with a 1 K/min linear ramp can be extrapolated to astrophysical warm-up timescales for conclusions about gas-phase return and snowlines.
Cite this review
Pith. "Pith review of CO2 infrared spectra on silicate dust grain analogs: Implications for JWST observations." pith.science (2026). https://pith.science/paper/HTILBX3Q
@misc{pith2026250700836,
  author       = {Pith},
  title        = {Pith review of: CO2 infrared spectra on silicate dust grain analogs: Implications for JWST observations},
  year         = {2026},
  howpublished = {\url{https://pith.science/paper/HTILBX3Q}},
  note         = {Machine review of arXiv:2507.00836}
}
read the original abstract
Carbon dioxide is one of the three most abundant species within the ice mantles around dust grains inside molecular clouds. Since a substantial amount of interstellar grains is made of siliceous materials, we have studied the infrared profile of CO2 deposited on top of a bare and ice-coated amorphous silicate (MgFeSiO4) film using reflection absorption infrared spectroscopy (RAIRS). In contrast to a metal surface, the CO2 IR profile shows a relaxation of the metal surface selection rule in the presence of the bare MgFeSiO4 dust grain analog, which brings the IR profile closer to the observational spectra while maintaining the sensitivity of RAIRS. Experiments with the underlying CO and CH4 ices show that their presence facilitates structural changes toward crystalline ice for the deposited CO2 at much lower temperatures than on the polar ice layers. Warming-up experiments of CO2 showed that it tends to stay on the silicate surface for much longer than on the gold surface without the silicate layer. We noticed for the first time a split in the 13CO2 IR feature on the pure or ice-covered silicate grain as a marker for the onset of diffusion. The laboratory 13CO2 profile then closely resembles recent JWST observations of this feature around young and embedded protostars, suggesting that it can be linked to the observed feature.
Figures


Figures from the paper (3 more)


Forward citations
Cited by 1 Pith paper
-
Tracing the source of carbon oxides on the large moons of Uranus
Exposed carbon oxides on Uranus's large moons are potentially native, with trailing-hemisphere concentrations and crystalline spectral signatures shaped by irradiation and seasonal sublimation-condensation cycles.
Reference graph
Works this paper leans on
-
[1]
G., Lazarian, A., & Vaillancourt, J
Andersson, B. G., Lazarian, A., & Vaillancourt, J. E. 2015, ARA&A, 53, 501
work page 2015
- [2]
-
[3]
Berreman, D. W. 1963, Phys. Rev., 130, 2193
work page 1963
-
[4]
Boogert, A. C. A., Gerakines, P. A., & Whittet, D. C. B. 2015, ARA&A, 53, 541
2015
-
[5]
Boogert, A. C. A., Ehrenfreund, P., Gerakines, P. A., et al. 2000, A&A, 353, 349
work page 2000
-
[6]
Bouilloud, M., Fray, N., B´ enilan, Y., et al. 2015, MNRAS, 451, 2145
work page 2015
-
[7]
Brunken, N. G. C., Rocha, W. R. M., van Dishoeck, E. F., et al. 2024, A&A, 685, A27
work page 2024
- [8]
Show all 37 references
-
[9]
L., Freimann, K., Burke, D
Edridge, J. L., Freimann, K., Burke, D. J., & Brown, W. A. 2013, Philos. Trans. R. Soc. A, 371, 20110578
2013
-
[10]
Ehrenfreund, P., Boogert, A. C. A., Gerakines, P. A., et al. 1996, A&A, 315, L341 RAIRS spectra of CO2 13
1996
-
[11]
Tielens, A. G. G. M., & van Dishoeck, E. F. 1997, A&A, 328, 649
1997
-
[12]
A., et al
Ehrenfreund, P., Kerkhof, O., Schutte, W. A., et al. 1999, A&A, 350, 240
1999
-
[13]
M., Toriello, F., He, J., & Vidali, G
Emtiaz, S. M., Toriello, F., He, J., & Vidali, G. 2022, JPCA, 126, 1973
2022
-
[14]
M., Munoz Caro, G
Escribano, R. M., Munoz Caro, G. M., Cruz-Diaz, G. A., Rodr ´ ıguez-Lazcano, Y., & Mat´ e, B. 2013, PNAS, 110, 12899
2013
-
[15]
Falk, M., & Seto, P. F. 1986, Can. J. Spectrosc., 31, 134
1986
-
[16]
A., Megeath, S
Federman, S. A., Megeath, S. T., Rubinstein, A. E., et al. 2024, ApJ, 966, 41
2024
-
[17]
E., McCoustra, M
Fulker, J. E., McCoustra, M. R. S., & Brown, W. A. 2025, ACS Earth Space Chem
2025
-
[18]
A., Palumbo, M
Fulvio, D., Sivaraman, B., Baratta, G. A., Palumbo, M. E., & Mason, N. J. 2009, Spectrochim. Acta A, 72, 1007
2009
-
[19]
A., Whittet, D
Gerakines, P. A., Whittet, D. C. B., Ehrenfreund, P., et al. 1999, ApJ, 522, 357
1999
-
[20]
2016, ApJ, 825, 89
He, J., Acharyya, K., & Vidali, G. 2016, ApJ, 825, 89
2016
-
[21]
M., & Vidali, G
He, J., Emtiaz, S. M., & Vidali, G. 2017, ApJ, 837, 65
2017
-
[22]
C., Suhasaria, T., et al
He, J., P´ erez Rickert, P. C., Suhasaria, T., et al. 2024, Mol. Phys., 122, e2176181
2024
-
[23]
2021, ApJL, 915, L23
Vidali, G. 2021, ApJL, 915, L23
2021
-
[24]
2018, MNRAS, 473, 860
He, J., & Vidali, G. 2018, MNRAS, 473, 860
2018
-
[25]
2010, ARA&A, 48, 21
Henning, T. 2010, ARA&A, 48, 21
2010
-
[26]
A., Mui˜ na, A
Ioppolo, S., Noble, J. A., Mui˜ na, A. T., et al. 2022, J. Mol. Spectrosc., 385, 111601
2022
-
[27]
A., & Linnartz, H
Isokoski, K., Poteet, C. A., & Linnartz, H. 2013, A&A, 555, A85
2013
-
[28]
Jenniskens, P., & Blake, D. F. 1994, Science, 265, 753
1994
-
[29]
Lasne, J., Rosu-Finsen, A., Cassidy, A., McCoustra, M. R. S., & Field, D. 2015, PCCP, 17, 20971
2015
-
[30]
K., Rocha, W
McClure, M. K., Rocha, W. R. M., Pontoppidan, K. M., et al. 2023, NatAs, 7, 431
2023
-
[31]
2022, ACS Earth and Space Chemistry, 6, 597 ¨Oberg, K
Minissale, M., Aikawa, Y., Bergin, E., et al. 2022, ACS Earth and Space Chemistry, 6, 597 ¨Oberg, K. I., Fayolle, E. C., Cuppen, H. M., van Dishoeck, E. F., & Linnartz, H. 2009, A&A, 505, 183
2022
-
[32]
M., Boogert, A
Pontoppidan, K. M., Boogert, A. C. A., Fraser, H. J., et al. 2008, ApJ, 678, 1005
2008
-
[33]
2013, ApJ, 780, 180
Sabri, T., Gavilan, L., J¨ ager, C., et al. 2013, ApJ, 780, 180
2013
-
[34]
A., & Allamandola, L
Sandford, S. A., & Allamandola, L. J. 1990, ApJ, 355, 357
1990
-
[35]
D., & Zacharias, H
Suhasaria, T., Thrower, J. D., & Zacharias, H. 2017, MNRAS, 472, 389
2017
-
[36]
2024, ACS omega, 10, 1237 van Broekhuizen, F
Tychengulova, A., Katpayeva, K., Shomshekova, S., et al. 2024, ACS omega, 10, 1237 van Broekhuizen, F. A., Groot, I. M. N., Fraser, H. J., van
2024
-
[37]
F., & Schlemmer, S
Dishoeck, E. F., & Schlemmer, S. 2006, A&A, 451, 723
2006
Reviewed August 6, 2026 · model on record in the stance chip above.
Discussion (0). Sign in to comment.