YAC: Bridging Natural Language and Interactive Visual Exploration with Generative AI for Biomedical Data Discovery
Pith reviewed 2026-05-21 22:07 UTC · model grok-4.3
The pith
YAC turns natural language queries into adjustable, linked interactive visualizations for biomedical data exploration.
A machine-rendered reading of the paper's core claim, the machinery that carries it, and where it could break.
Core claim
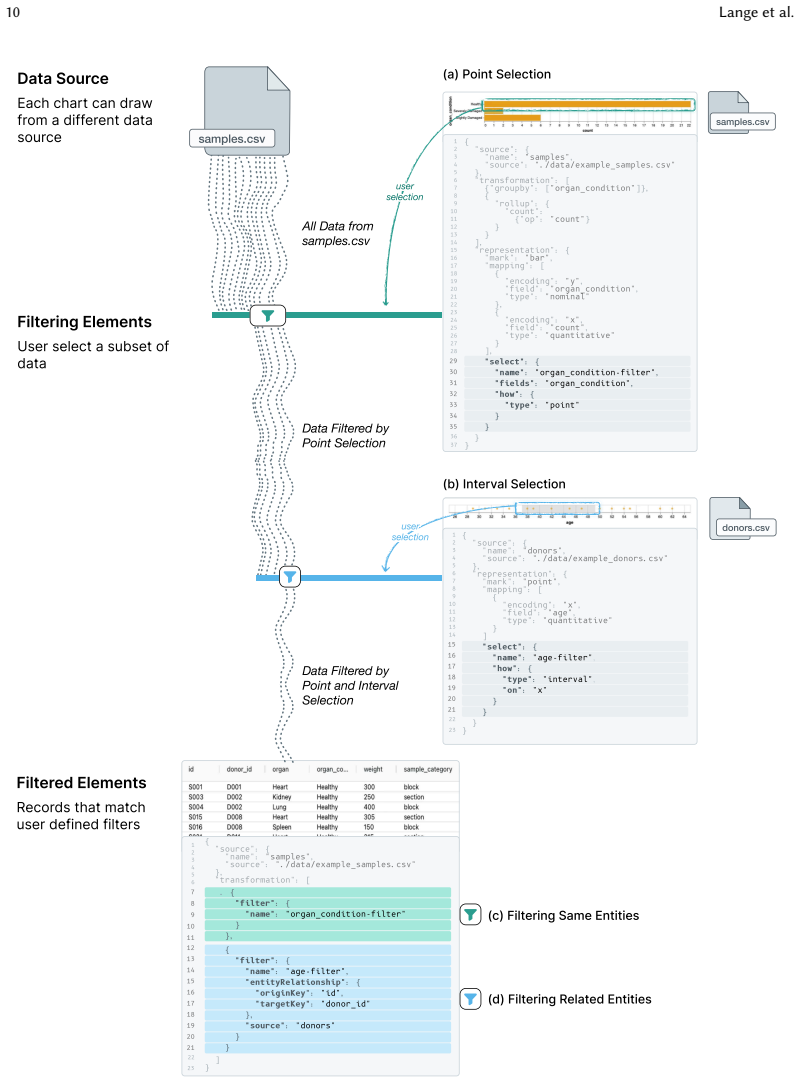
YAC shows that a tool-calling multi-agent system can produce declarative output interpreted to render linked interactive visualizations, apply data filters, generate clarifying structured text, and support direct adjustment widgets that let users modify the generated structures for biomedical data discovery.
What carries the argument
A tool-calling multi-agent system that generates declarative output interpreted to render visualizations and apply filters.
If this is right
- Users gain the ability to start with open-ended questions and then refine results through both visual interaction and direct edits to the underlying structure.
- Clarifying text output helps users understand system boundaries and data meanings without leaving the exploration flow.
- Linked visualizations update together when filters or adjustments are applied, preserving context across multiple views.
- The design supports both initial discovery and iterative correction within the same interface.
Where Pith is reading between the lines
- Similar agent-driven declarative layers could be tested in non-biomedical domains such as environmental sensor data or financial time series.
- Future versions might incorporate live data streams to see whether the same declarative generation remains stable under continuous updates.
- Combining this approach with collaborative multi-user sessions could reveal how shared adjustments affect group interpretation of the same dataset.
Load-bearing premise
The multi-agent pipeline will consistently translate user intent into accurate visualization actions and filters that adjustment widgets can readily correct when errors occur.
What would settle it
Observing sessions where most user queries produce persistent mis-mapped filters or visualizations that the adjustment widgets do not resolve within a few clicks, resulting in repeated restarts or abandoned explorations.
Figures




read the original abstract
Incorporating natural language input has the potential to improve the capabilities of biomedical data discovery interfaces. However, user interface elements and visualizations are still powerful tools for interacting with data. In our prototype system, YAC, Yet Another Chatbot, we integrate natural language and interactive visualizations. YAC uses a tool-calling multi-agent system to generate declarative output, which is interpreted to render linked interactive visualizations and apply data filters. We also include adjustment widgets, which allow users to directly modify the structured output. Structured text is also generated to clarify user intent, notify users of system boundaries, and explain aspects of the data with live data element links. We conducted a user study with domain experts to surface areas where YAC can be improved. Furthermore we reflect on the capabilities and design of this system with an analysis of its technical dimensions.
Editorial analysis
A structured set of objections, weighed in public.
Referee Report
Summary. The manuscript presents YAC ('Yet Another Chatbot'), a prototype system for biomedical data discovery that integrates natural language input with interactive visualizations. It employs a tool-calling multi-agent architecture to generate declarative output interpreted for rendering linked visualizations, applying filters, and enabling direct adjustments via widgets, while also producing structured clarifying text. The authors report conducting a user study with domain experts to identify improvement areas and provide a reflective analysis of the system's technical dimensions.
Significance. If the described integration of the multi-agent pipeline with declarative outputs and correction widgets proves reliable, the work could contribute to hybrid conversational-visual interfaces in biomedical HCI. The prototype nature, inclusion of adjustment mechanisms, and expert user study offer practical design insights. However, the absence of quantitative evaluation limits demonstrated effectiveness, making the significance prospective rather than established.
major comments (1)
- User Study section: The manuscript states that a user study with domain experts was conducted to surface improvement areas, but reports no quantitative results, task metrics, error rates, misinterpretation frequencies, or baseline comparisons. This is load-bearing for the central claim of effective integration, as it leaves the reliability of the tool-calling pipeline in mapping intent to declarative visualization actions and filters supported only by qualitative reflection.
minor comments (2)
- Abstract: The abstract could more clearly summarize the key outcomes or limitations identified in the user study and technical analysis to better convey the paper's contributions beyond system description.
- System description: The high-level overview of the multi-agent tool-calling and declarative output interpretation would benefit from additional concrete examples of query-to-visualization mappings or failure modes to aid reproducibility.
Simulated Author's Rebuttal
We thank the referee for their constructive review of our manuscript on the YAC prototype. We address the major comment below by clarifying the qualitative scope of the user study and the manuscript's positioning as a design-oriented prototype rather than a quantitative evaluation.
read point-by-point responses
-
Referee: [—] User Study section: The manuscript states that a user study with domain experts was conducted to surface improvement areas, but reports no quantitative results, task metrics, error rates, misinterpretation frequencies, or baseline comparisons. This is load-bearing for the central claim of effective integration, as it leaves the reliability of the tool-calling pipeline in mapping intent to declarative visualization actions and filters supported only by qualitative reflection.
Authors: We acknowledge that the reported user study contains no quantitative metrics, task performance data, error rates, or baseline comparisons. This is by design: the study was conducted as a small-scale qualitative exploration with domain experts specifically to identify improvement opportunities and to inform our reflective analysis of the system's technical dimensions, rather than to statistically validate the reliability or effectiveness of the multi-agent pipeline. The manuscript's abstract and introduction frame the contribution as the description of a prototype architecture that integrates natural language with interactive visualizations via declarative outputs and adjustment widgets, together with expert-informed reflections on its capabilities and limitations. We do not advance a central claim of proven effectiveness or quantitative reliability for the tool-calling mechanism. To address the referee's concern, we will revise the User Study section, the abstract, and the introduction to explicitly state the qualitative purpose of the study and to temper any implication of demonstrated integration reliability, making the scope of the evaluation clearer to readers. revision: partial
Circularity Check
No significant circularity
full rationale
The manuscript is a system-description and user-study paper presenting the YAC prototype architecture (multi-agent tool-calling pipeline, declarative output interpretation, adjustment widgets, and structured text generation). No equations, fitted parameters, uniqueness theorems, or derivation steps appear in the provided text or abstract. The central claims rest on architectural choices and qualitative reflections from the user study rather than any self-referential reduction or self-citation load-bearing argument. The work is therefore self-contained against external benchmarks with no circular steps to isolate.
Axiom & Free-Parameter Ledger
Forward citations
Cited by 2 Pith papers
-
Raiven: LLM-Based Visualization Authoring via Domain-Specific Language Mediation
Raiven mediates LLM visualization authoring via a formally defined DSL that unifies scientific and information visualization, producing deterministic, verifiable code from metadata-only inputs.
-
Figures as Interfaces: Toward LLM-Native Artifacts for Scientific Discovery
LLM-native figures embed provenance and enable direct LLM interaction with scientific visualizations to accelerate discovery and improve reproducibility.
Reference graph
Works this paper leans on
-
[1]
Amanda L. Charbonneau, Arthur Brady, Karl Czajkowski, Jain Aluvathingal, Saranya Canchi, Robert Carter, Kyle Chard, Daniel J. B. Clarke, Jonathan Crabtree, Heather H. Creasy, Mike D’Arcy, Victor Felix, Michelle Giglio, Alicia Gingrich, Rayna M. Harris, Theresa K. Hodges, Olukemi Ifeonu, Minji Jeon, Eryk Kropiwnicki, Marisa C. W. Lim, R. Lee Liming, Jessic...
-
[2]
Juntong Chen, Jiang Wu, Jiajing Guo, Vikram Mohanty, Xueming Li, Jorge Piazentin Ono, Wenbin He, Liu Ren, and Dongyu Liu. 2025. InterChat: Enhancing Generative Visual Analytics Using Multimodal Interactions.Computer Graphics Forum44, 3 (2025), e70112. doi:10.1111/cgf.70112
-
[3]
Nan Chen, Yuge Zhang, Jiahang Xu, Kan Ren, and Yuqing Yang. 2025. VisEval: A Benchmark for Data Visualization in the Era of Large Language Models.IEEE Transactions on Visualization and Computer Graphics31, 1 (Jan. 2025), 1301–1311. doi:10.1109/TVCG.2024.3456320
-
[4]
Weiwei Cui, Xiaoyu Zhang, Yun Wang, He Huang, Bei Chen, Lei Fang, Haidong Zhang, Jian-Guan Lou, and Dongmei Zhang. 2020. Text-to-Viz: Automatic Generation of Infographics from Proportion-Related Natural Language Statements. IEEE Transactions on Visualization and Computer Graphics26, 1 (Jan. 2020), 906–916. doi:10.1109/TVCG.2019.2934785
-
[5]
Ge, Yiren Ding, Lane Harrison, Fumeng Yang, and Matthew Kay
Yuan Cui, Lily W. Ge, Yiren Ding, Lane Harrison, Fumeng Yang, and Matthew Kay. 2025. Promises and Pitfalls: Using Large Language Models to Generate Visualization Items.IEEE Transactions on Visualization and Computer Graphics31, 1 (Jan. 2025), 1094–1104. doi:10.1109/TVCG.2024.3456309
-
[7]
Belmont, Mitchell Guttman, Victor O
Job Dekker, Andrew S. Belmont, Mitchell Guttman, Victor O. Leshyk, John T. Lis, Stavros Lomvardas, Leonid A. Mirny, Clodagh C. O’Shea, Peter J. Park, Bing Ren, Joan C. Ritland Politz, Jay Shendure, and Sheng Zhong. 2017. The 4D Nucleome Project.Nature549, 7671 (Sept. 2017), 219–226. doi:10.1038/nature23884
-
[8]
Victor Dibia. 2023. LIDA: A Tool for Automatic Generation of Grammar-Agnostic Visualizations and Infographics Using Large Language Models. InProceedings of the 61st Annual Meeting of the Association for Computational Linguistics (Volume 3: System Demonstrations), Danushka Bollegala, Ruihong Huang, and Alan Ritter (Eds.). Association for Computational Ling...
-
[9]
Victor Dibia and Çağatay Demiralp. 2018. Data2Vis: Automatic Generation of Data Visualizations Using Sequence to Sequence Recurrent Neural Networks. arXiv:1804.03126 [cs] doi:10.48550/arXiv.1804.03126
work page internal anchor Pith review Pith/arXiv arXiv doi:10.48550/arxiv.1804.03126 2018
-
[10]
Lin Gao, Jing Lu, Zekai Shao, Ziyue Lin, Shengbin Yue, Chiokit Leong, Yi Sun, Rory James Zauner, Zhongyu Wei, and Siming Chen. 2025. Fine-Tuned Large Language Model for Visualization System: A Study on Self-Regulated Learning in Education.IEEE Transactions on Visualization and Computer Graphics31, 1 (Jan. 2025), 514–524. doi:10.1109/TVCG. 2024.3456145
- [11]
-
[12]
Tong Gao, Mira Dontcheva, Eytan Adar, Zhicheng Liu, and Karrie G. Karahalios. 2015. DataTone: Managing Ambiguity in Natural Language Interfaces for Data Visualization. InProceedings of the 28th Annual ACM Symposium on User Interface Software & Technology. ACM, Charlotte NC USA, 489–500. doi:10.1145/2807442.2807478
-
[13]
Kristen B. Gorman, Tony D. Williams, and William R. Fraser. 2014. Ecological Sexual Dimorphism and Environmental Variability within a Community of Antarctic Penguins (Genus Pygoscelis).PLOS ONE9, 3 (March 2014), e90081. doi:10.1371/journal.pone.0090081
-
[14]
Jeffrey Heer and Dominik Moritz. 2024. Mosaic: An Architecture for Scalable & Interoperable Data Views.IEEE Transactions on Visualization and Computer Graphics30, 1 (Jan. 2024), 436–446. doi:10.1109/TVCG.2023.3327189
- [15]
-
[16]
Horst, Alison Presmanes Hill, and Kristen B
Allison M. Horst, Alison Presmanes Hill, and Kristen B. Gorman. 2020. Allisonhorst/Palmerpenguins: V0.1.0. Zenodo. doi:10.5281/zenodo.3960218
-
[17]
Jieying Huang, Yang Xi, Junnan Hu, and Jun Tao. 2023. FlowNL: Asking the Flow Data in Natural Languages.IEEE Transactions on Visualization and Computer Graphics29, 1 (Jan. 2023), 1200–1210. doi:10.1109/TVCG.2022.3209453 22 Lange et al
-
[18]
Zhaosong Huang, Ye Zhao, Wei Chen, Shengjie Gao, Kejie Yu, Weixia Xu, Mingjie Tang, Minfeng Zhu, and Mingliang Xu. 2020. A Natural-language-based Visual Query Approach of Uncertain Human Trajectories.IEEE Transactions on Visualization and Computer Graphics26, 1 (Jan. 2020), 1256–1266. doi:10.1109/TVCG.2019.2934671
-
[19]
Joel Jakubovic, Jonathan Edwards, and Tomas Petricek. 2023. Technical Dimensions of Programming Systems.The Art, Science, and Engineering of Programming7, 3 (2023), 13. doi:10.22152/programming-journal.org/2023/7/13
work page doi:10.22152/programming-journal.org/2023/7/13 2023
-
[20]
Jaeyoung Kim, Sihyeon Lee, Hyeon Jeon, Keon-Joo Lee, Hee-Joon Bae, Bohyoung Kim, and Jinwook Seo. 2025. PhenoFlow: A Human-LLM Driven Visual Analytics System for Exploring Large and Complex Stroke Datasets.IEEE Transactions on Visualization and Computer Graphics31, 1 (Jan. 2025), 470–480. doi:10.1109/TVCG.2024.3456215
-
[21]
Efficient Memory Management for Large Language Model Serving with PagedAttention
Woosuk Kwon, Zhuohan Li, Siyuan Zhuang, Ying Sheng, Lianmin Zheng, Cody Hao Yu, Joseph E. Gonzalez, Hao Zhang, and Ion Stoica. 2023. Efficient Memory Management for Large Language Model Serving with PagedAttention. arXiv:2309.06180 [cs] doi:10.48550/arXiv.2309.06180
work page internal anchor Pith review Pith/arXiv arXiv doi:10.48550/arxiv.2309.06180 2023
-
[22]
Devin Lange, Pengwei Sui, Shanghua Gao, Marinka Zitnik, and Nils Gehlenborg. 2025. DQVis Dataset: Natural Language to Biomedical Visualization
work page 2025
-
[23]
Chunggi Lee, Tica Lin, Hanspeter Pfister, and Chen Zhu-Tian. 2025. Sportify: Question Answering with Embedded Visualizations and Personified Narratives for Sports Video.IEEE Transactions on Visualization and Computer Graphics 31, 1 (Jan. 2025), 12–22. doi:10.1109/TVCG.2024.3456332
-
[24]
Patty J. Lee, Christopher C. Benz, Philip Blood, Katy Börner, Judith Campisi, Feng Chen, Heike Daldrup-Link, Phil De Jager, Li Ding, Francesca E. Duncan, Oliver Eickelberg, Rong Fan, Toren Finkel, David Furman, Vesna Garovic, Nils Gehlenborg, Carolyn Glass, Indra Heckenbach, Ziv-Bar Joseph, Pragati Katiyar, So-Jin Kim, Melanie Königshoff, George A. Kuchel...
-
[25]
S. Liu, H. Miao, Z. Li, M. Olson, V. Pascucci, and P-T. Bremer. 2024. AVA: Towards Autonomous Visualization Agents through Visual Perception-Driven Decision-Making.Computer Graphics Forum43, 3 (2024), e15093. doi:10.1111/cgf. 15093
work page doi:10.1111/cgf 2024
-
[26]
Ziao Liu, Xiao Xie, Moqi He, Wenshuo Zhao, Yihong Wu, Liqi Cheng, Hui Zhang, and Yingcai Wu. 2025. Smartboard: Visual Exploration of Team Tactics with LLM Agent.IEEE Transactions on Visualization and Computer Graphics31, 1 (Jan. 2025), 23–33. doi:10.1109/TVCG.2024.3456200
-
[27]
Yuyu Luo, Nan Tang, Guoliang Li, Chengliang Chai, Wenbo Li, and Xuedi Qin. 2021. Synthesizing Natural Language to Visualization (NL2VIS) Benchmarks from NL2SQL Benchmarks. InProceedings of the 2021 International Conference on Management of Data (SIGMOD ’21). Association for Computing Machinery, New York, NY, USA, 1235–1247. doi:10.1145/3448016.3457261
-
[28]
Yuyu Luo, Nan Tang, Guoliang Li, Jiawei Tang, Chengliang Chai, and Xuedi Qin. 2022. Natural Language to Visualization by Neural Machine Translation.IEEE Transactions on Visualization and Computer Graphics28, 1 (Jan. 2022), 217–226. doi:10.1109/TVCG.2021.3114848
-
[29]
Sehi L’Yi, Astrid van den Brandt, Etowah Adams, Huyen N. Nguyen, and Nils Gehlenborg. 2024. Learnable and Expressive Visualization Authoring through Blended Interfaces.IEEE Transactions on Visualization and Computer Graphics(2024). doi:10.1109/TVCG.2024.3456598
-
[30]
Jock Mackinlay, Pat Hanrahan, and Chris Stolte. 2007. Show Me: Automatic Presentation for Visual Analysis.IEEE Transactions on Visualization and Computer Graphics (InfoVis ’07)13, 6 (2007), 1137–1144. doi:10.1109/TVCG.2007.70594
-
[31]
Andrew McNutt, Maureen C. Stone, and Jeffrey Heer. 2025. Mixing Linters with GUIs: A Color Palette Design Probe. IEEE Transactions on Visualization and Computer Graphics31, 1 (2025), 327–337. doi:10.1109/TVCG.2024.3456317
-
[32]
Arpit Narechania, Arjun Srinivasan, and John Stasko. 2021. NL4DV: A Toolkit for Generating Analytic Specifications for Data Visualization from Natural Language Queries.IEEE Transactions on Visualization and Computer Graphics27, 2 (Feb. 2021), 369–379. doi:10.1109/TVCG.2020.3030378
-
[33]
Aditeya Pandey, Sehi L’Yi, Qianwen Wang, Michelle A. Borkin, and Nils Gehlenborg. 2023. GenoREC: A Recommen- dation System for Interactive Genomics Data Visualization.IEEE Transactions on Visualization and Computer Graphics 29, 1 (Jan. 2023), 570–580. doi:10.1109/TVCG.2022.3209407
-
[34]
Rock Yuren Pang, Hope Schroeder, Kynnedy Simone Smith, Solon Barocas, Ziang Xiao, Emily Tseng, and Danielle Bragg. 2025. Understanding the LLM-ification of CHI: Unpacking the Impact of LLMs at CHI through a Systematic Literature Review. InProceedings of the 2025 CHI Conference on Human Factors in Computing Systems (CHI ’25). Association for Computing Mach...
-
[35]
Consciousness and cognition20(4), 1847–1854 (2011) https://doi.org/10.1016/j
Ananda L. Roy, Richard S. Conroy, Veronica G. Taylor, Judy Mietz, Ian M. Fingerman, Michael J. Pazin, Phillip Smith, Carolyn M. Hutter, Dinah S. Singer, and Elizabeth L. Wilder. 2023. Elucidating the Structure and Function of the Nucleus—The NIH Common Fund 4D Nucleome Program.Molecular Cell83, 3 (Feb. 2023), 335–342. doi:10.1016/j. molcel.2022.12.025
work page doi:10.1016/j 2023
- [36]
-
[37]
Arvind Satyanarayan, Ryan Russell, Jane Hoffswell, and Jeffrey Heer. 2016. Reactive Vega: A Streaming Dataflow Architecture for Declarative Interactive Visualization.IEEE Transactions on Visualization and Computer Graphics22, 1 (Jan. 2016), 659–668. doi:10.1109/TVCG.2015.2467091
-
[38]
Battersby, Melanie Tory, Rich Gossweiler, and Angel X
Vidya Setlur, Sarah E. Battersby, Melanie Tory, Rich Gossweiler, and Angel X. Chang. 2016. Eviza: A Natural Language Interface for Visual Analysis. InProceedings of the 29th Annual Symposium on User Interface Software and Technology (UIST ’16). Association for Computing Machinery, New York, NY, USA, 365–377. doi:10.1145/2984511.2984588
-
[39]
Vidya Setlur and Arathi Kumar. 2020. Sentifiers: Interpreting Vague Intent Modifiers in Visual Analysis Using Word Co-occurrence and Sentiment Analysis. In2020 IEEE Visualization Conference (VIS). 216–220. doi:10.1109/VIS47514. 2020.00050
-
[40]
Leixian Shen, Enya Shen, Yuyu Luo, Xiaocong Yang, Xuming Hu, Xiongshuai Zhang, Zhiwei Tai, and Jianmin Wang
-
[41]
Towards Natural Language Interfaces for Data Visualization: A Survey.IEEE Transactions on Visualization and Computer Graphics29, 6 (June 2023), 3121–3144. doi:10.1109/TVCG.2022.3148007
-
[42]
Chuhan Shi, Weiwei Cui, Chengzhong Liu, Chengbo Zheng, Haidong Zhang, Qiong Luo, and Xiaojuan Ma. 2024. NL2Color: Refining Color Palettes for Charts with Natural Language.IEEE Transactions on Visualization and Computer Graphics30, 1 (Jan. 2024), 814–824. doi:10.1109/TVCG.2023.3326522
-
[43]
Michael P. Snyder, Shin Lin, Amanda Posgai, Mark Atkinson, Aviv Regev, Jennifer Rood, Orit Rozenblatt-Rosen, Leslie Gaffney, Anna Hupalowska, Rahul Satija, Nils Gehlenborg, Jay Shendure, Julia Laskin, Pehr Harbury, Nicholas A. Nystrom, Jonathan C. Silverstein, Ziv Bar-Joseph, Kun Zhang, Katy Börner, Yiing Lin, Richard Conroy, Dena Procaccini, Ananda L. Ro...
-
[44]
The Human Body at Cellular Resolution: The NIH Human Biomolecular Atlas Program.Nature574, 7777 (Oct. 2019), 187–192. doi:10.1038/s41586-019-1629-x
-
[45]
Glassman, Jeevana Priya Inala, and Chenglong Wang
Priyan Vaithilingam, Elena L. Glassman, Jeevana Priya Inala, and Chenglong Wang. 2024. DynaVis: Dynamically Synthesized UI Widgets for Visualization Editing. InProceedings of the 2024 CHI Conference on Human Factors in Computing Systems (CHI ’24). Association for Computing Machinery, New York, NY, USA, 1–17. doi:10.1145/3613904. 3642639
-
[46]
J.J. Van Wijk. 2005. The Value of Visualization. InVIS 05. IEEE Visualization, 2005.IEEE, Minneapolis, MN, USA, 79–86. doi:10.1109/VISUAL.2005.1532781
-
[47]
Chenglong Wang, Bongshin Lee, Steven Drucker, Dan Marshall, and Jianfeng Gao. 2025. Data Formulator 2: Iterative Creation of Data Visualizations, with AI Transforming Data Along the Way. arXiv:2408.16119 [cs] doi:10.48550/arXiv. 2408.16119
work page internal anchor Pith review doi:10.48550/arxiv 2025
-
[48]
Chenglong Wang, John Thompson, and Bongshin Lee. 2024. Data Formulator: AI-Powered Concept-Driven Vi- sualization Authoring.IEEE Transactions on Visualization and Computer Graphics30, 1 (Jan. 2024), 1128–1138. doi:10.1109/TVCG.2023.3326585
-
[49]
Huichen Will Wang, Mitchell Gordon, Leilani Battle, and Jeffrey Heer. 2025. DracoGPT: Extracting Visualization Design Preferences from Large Language Models.IEEE Transactions on Visualization and Computer Graphics31, 1 (Jan. 2025), 710–720. doi:10.1109/TVCG.2024.3456350
-
[50]
Yun Wang, Zhitao Hou, Leixian Shen, Tongshuang Wu, Jiaqi Wang, He Huang, Haidong Zhang, and Dongmei Zhang
-
[51]
Towards Natural Language-Based Visualization Authoring.IEEE Transactions on Visualization and Computer Graphics(2022), 1–11. doi:10.1109/TVCG.2022.3209357
- [52]
-
[53]
Kanit Wongsuphasawat, Dominik Moritz, Anushka Anand, Jock Mackinlay, Bill Howe, and Jeffrey Heer. 2016. Voyager: Exploratory Analysis via Faceted Browsing of Visualization Recommendations.IEEE Transactions on Visualization and Computer Graphics22, 1 (Jan. 2016), 649–658. doi:10.1109/TVCG.2015.2467191
-
[54]
Aoyu Wu, Yun Wang, Xinhuan Shu, Dominik Moritz, Weiwei Cui, Haidong Zhang, Dongmei Zhang, and Huamin Qu
-
[55]
Efficient optimization of cutoffs in quantum repeater chains,
AI4VIS: Survey on Artificial Intelligence Approaches for Data Visualization.IEEE Transactions on Visualization and Computer Graphics28, 12 (Dec. 2022), 5049–5070. doi:10.1109/TVCG.2021.3099002
-
[56]
Youfu Yan, Yu Hou, Yongkang Xiao, Rui Zhang, and Qianwen Wang. 2025. KNOWNET: Guided Health Information Seeking from LLMs via Knowledge Graph Integration.IEEE Transactions on Visualization and Computer Graphics31, 1 (Jan. 2025), 547–557. doi:10.1109/TVCG.2024.3456364
-
[57]
Bowen Yu and Claudio T. Silva. 2020. FlowSense: A Natural Language Interface for Visual Data Exploration within a Dataflow System.IEEE Transactions on Visualization and Computer Graphics26, 1 (Jan. 2020), 1–11. arXiv:1908.00681 [cs] YAC: Bridging Natural Language and Interactive Visual Exploration with Generative AI for Biomedical Data Discovery25 doi:10....
-
[58]
Chen Zhu-Tian, Qisen Yang, Xiao Xie, Johanna Beyer, Haijun Xia, Yingcai Wu, and Hanspeter Pfister. 2023. Sporthesia: Augmenting Sports Videos Using Natural Language.IEEE Transactions on Visualization and Computer Graphics29, 1 (Jan. 2023), 918–928. doi:10.1109/TVCG.2022.3209497
discussion (0)
Sign in with ORCID, Apple, or X to comment. Anyone can read and Pith papers without signing in.