REVIEW 4 major objections 5 minor 70 references
Fragility of Minimum-Variance Portfolios
T0 review · 4 major / 5 minor · reviewed 2026-08-01 · deepseek-v4-flash
Pith's one-line read Minimum-variance portfolio instability is a threshold effect, not just estimation noise
desk verdict Mathematically sound and useful closed forms, but the headline mechanism is not cleanly isolated from conditioning effects and some real-data claims overreach; worth refereeing with revisions. read the letter →
The pith
A machine-rendered reading of the paper's core claim, the machinery that carries it, and where it could break.
The reading
What carries the argument
The fixed-point threshold θ̄ (and its block analog θ̄_i + θ̂) is the central object. It is the cutoff in inverse-volatility space determined by correlation ρ and the positive-part truncation; because it solves θ̄ = ρ/(1−ρ) Σ (θ_j − θ̄)_+, it encodes the whole coupling between correlation and volatilities. The paper's proofs rely on the reparametrization x = Θy/(1^T Θy) and the KKT conditions, reducing the portfolio problem to a convex quadratic program whose solution is the truncation. This object carries the argument because proximity of θ̄ to a breakpoint is defined as the exact fragility condition.
What would settle it
Construct an exact block-constant covariance with ordered inverse volatilities arranged so that θ̄ is far from every breakpoint (e.g., satisfying θ_{i+1} << θ̄ << θ_i); then perturb ρ and all σ_i by small amounts and check that the active set and weights remain continuous. If the active set changes despite this separation, the threshold mechanism is wrong. Conversely, take the paper's fragile three-asset example (σ=(1,1.8,2), ρ=0.48) and deliberately nudge σ3; the active set should flip exactly when θ̄ crosses θ_3.
Extended reading notes
Core claim
Under correlation matrices that are constant within blocks, the long-only minimum-variance portfolio equals a normalized truncation of inverse volatilities: y ∝ (θ − θ̄1)_+, where θ̄ solves a fixed-point equation. The authors prove that the active set of assets is determined by which inverse volatilities exceed θ̄, and that the portfolio is fragile exactly when θ̄ is near one of the breakpoints θ_i or θ_{i+1}: small perturbations in ρ, σ_i, or σ_{i+1} can shift the active set and cause discontinuous weight changes. They extend this to block-diagonal matrices, where each block has its own threshold θ̄_i plus a common global threshold θ̂, coupled through a fixed-point system. They then propose
Load-bearing premise
The analysis assumes the true correlation structure is approximately block-constant with known blocks and that the clustering procedure recovers those blocks; if the fitted blocks misplace the breakpoints, the threshold corrections are aimed at the wrong boundaries and the mechanism no longer predicts the real portfolio.
Editorial extensions
If this is right
- If θ̄ stays a safe distance away from every inverse-volatility breakpoint, the active set is locally invariant and small estimation errors cannot flip assets in or out.
- The closed form gives a diagnostic: practitioners can compute θ̄ from an estimated covariance and flag portfolios where θ̄ is close to a breakpoint.
- Correlation-aware shrinkage that projects θ̄ away from breakpoints keeps the portfolio sparse and close to the minimum-variance solution, unlike global shrinkage which densifies it.
- The block-diagonal fixed-point system shows fragility can be localized: one block operating near its threshold is enough to destabilize the whole allocation.
- Because the block structure can be recovered by clustering, the mechanism extends to general covariance matrices without requiring an exogenous grouping.
Reading between the lines
- A natural test is to monitor the distance min_i |θ̄ − θ_i| over rolling windows; if the paper is right, turnover and realized variance should spike when this distance is small, providing an early-warning statistic.
- The same threshold mechanism may translate to mean-variance problems, where expected-return estimates enter as an additional drift term; the paper leaves this open.
- The largest-gap clustering cutoff is only one way to recover blocks; the fragility diagnosis might be sensitive to clustering method, and comparing alternative linkages could reveal whether the mechanism is robust to block mis-specification.
- The correction parameter ε in the projection heuristic is chosen as max θ_i / n; a data-driven calibration of ε could improve the trade-off further, though the paper does not explore it.
Editorial analysis
A structured set of objections, weighed in public.
Referee Report
Summary. The paper derives closed-form solutions for long-only minimum-variance portfolios under constant and block-constant correlation structures (Propositions 1 and 2), showing that the optimal portfolio is determined by a fixed-point threshold θ̄ (and, in the block case, coupled thresholds θ̂+θ̄_i) that truncates inverse volatilities. Fragility is attributed to proximity of these thresholds to the ordered θ_i breakpoints. Motivated by this insight, the authors propose structured shrinkage methods (BDS-Obliv, BDS-Aware, BDS-Direct) and evaluate them against classical and hierarchical benchmarks in controlled simulations and on Fama-French industry returns. Proposition 3 gives the least-squares fit of the block model.
Significance. The closed-form results are a genuine contribution: they make the support-selection mechanism of the long-only minimum-variance problem explicit under a structured correlation model, and the derivations are self-contained and algebraically sound. The BDS family is clearly described, an open-source repository is promised, and the benchmark comparison is unusually broad. However, the central mechanism—threshold distance as the driver of fragility—is not directly tested; the real-data 'confirmation' is in-sample, and the language of discontinuous weight changes is technically inaccurate. If a controlled distance sweep is added and confirms the mechanism, the paper would provide a useful structural explanation and a well-motivated shrinkage procedure.
major comments (4)
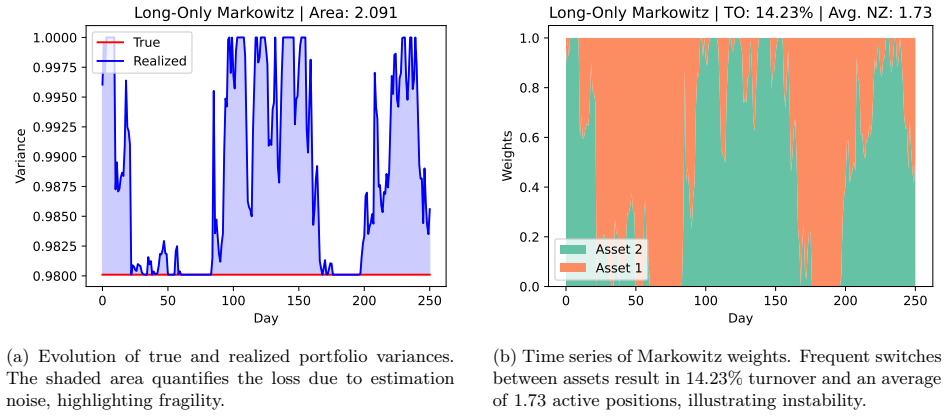
- [§3.1, Eq. (8)–(11); Examples 1–3] The paper's central claim—fragility is governed by the distance of θ̄ to the breakpoints θ_i—is asserted but never tested by varying that distance. All three examples place parameters at or near the boundary (Ex. 1: ρ=σ1/σ2 with σ1≈σ2, so the covariance is near-singular; Ex. 2: θ3≈θ̄; Ex. 3: θ_i≈θ̂+θ̄_i with all θ_i equal). These constructions cannot separate threshold proximity from generic ill-conditioning or block degeneracy. The authors should sweep δ = min_i |θ̄−θ_i| while holding n, ρ, volatility spread, estimator, and evaluation noise fixed, and show that Area, turnover, and active-set switch frequency decrease with δ. Without this control, the robustification rationale in §5 is not empirically established.
- [§4.2, Fig. 6 and §5.3.3] The real-data 'sharp prediction' is in-sample and circular. The block model, thresholds θ̂+θ̄_i, and asset-to-threshold distances are estimated from the full 2018–2025 residualized sample, and the same sample is then used to observe that Mastercard and the Energy names toggle. The 'True' variance in Fig. 6 also uses the full-sample residual covariance as the oracle, making Area an in-sample quantity. This is a descriptive fit, not an external confirmation of the mechanism. Please re-estimate the block structure and thresholds on rolling or training windows and test the predicted toggling out-of-sample, or at least explicitly label the claim as in-sample.
- [§3.1, text after Eq. (10)] The statement that an active-set shift 'changes which components are truncated ... leading to a discontinuous change in the portfolio weights (3)' is inaccurate. In the positive-part solution (8), an asset at the boundary has (θ_i−θ̄)_+=0, so y_i=0 and x_i=0; the mapping from parameters to weights is continuous. The fragility is a kink/derivative discontinuity, not a jump in x. The 'abrupt switches' in the rolling experiments come from estimated parameters jumping across the boundary across rebalancing dates. Please correct this characterization and, if possible, quantify the local Lipschitz constant or derivative of x near the threshold.
- [§5.3 and §6.1] The block approximation (12) is assumed to be a faithful representation of general covariance matrices, and the clustering pipeline is validated only indirectly. In §6.1 the DGP is block-diagonal by construction, so block recovery is favorable; in the factor model and real data there is no ground-truth partition, so the inferred blocks are not checked. The generality of the BDS results depends on the largest-gap/single-linkage rule (19)–(22) recovering meaningful structure. Please report cluster-recovery metrics where true blocks are known (e.g., adjusted Rand index) and a sensitivity analysis of BDS performance to the dendrogram cutoff τ.
minor comments (5)
- [§4.2, Example 3] Notation: 'ˆθ1+θ̄' should be 'θ̂+θ̄_i'; there is no θ̂_1 defined in the paper.
- [§5.3.2, Fig. 9 caption] The caption says the threshold is τ = ½(ℓ_k*+ℓ_k*+1)+ε, but Eq. (22) defines τ without the +ε term. Please reconcile.
- [Figures 4, 7] The axis labels use 'Ast.'; this should be 'Asset' throughout the figure panels.
- [§5.1.2, Eq. (15)] The ε heuristic is effectively a free parameter; no sensitivity analysis with respect to ε is provided. Either report sensitivity or state that results are invariant over a reasonable range.
- [§4.2, Fig. 6] Please define precisely what covariance is used as 'true' in the real-data Area computation; the text implies the full-sample residual covariance, which should be stated explicitly.
Circularity Check
In-sample 'prediction' in §5.3.3 is fitted to the same data it claims to confirm; the closed-form derivation itself is independent.
-
fitted input called prediction
[Section 5.3.3, final paragraph (after Figure 10)]
"The block fixed-point system therefore makes a sharp prediction: assets operating at or near their block thresholds (Mastercard and the Energy names) should be the most susceptible to toggling as the estimated covariance fluctuates across rolling windows, while assets with coordinates safely above their breakpoints should remain persistently active. Figure 6 confirms this prediction closely..."
The thresholds θ̂+θ̄_i used for the prediction are obtained from the block parameters ρ̂, ρ̂_i estimated by Proposition 3 via least-squares projection onto the same full-sample residual correlation matrix that also generates the rolling-window portfolios in Figure 6. The same data set therefore both determines which assets are near the thresholds and supplies the toggling behavior offered as confirmation. The 'sharp prediction' is an in-sample restatement of the fitted model's implications, not an out-of-sample test, so the claimed confirmation is descriptive rather than independent evidence.
full rationale
The analytical core of the paper is self-contained and not circular. Lemma 1 is an exact change of variables; Proposition 1 and Proposition 2 are derived from KKT conditions and algebraic manipulation of the positive-part operator, with no fitted parameters or self-citations. The central fragility claim in Section 3.1 follows directly from formula (8): if the fixed-point threshold θ̄ sits near a breakpoint θ_i or θ_{i+1}, small parameter perturbations can change the active set. That is a mathematical property of the derived solution, not an input. The block-diagonal extension in Proposition 2 is likewise a direct derivation, and Proposition 3 is a straightforward least-squares projection. There is no uniqueness theorem imported from the authors' prior work, and no ansatz smuggled in via self-citation. The only step that approaches a circular pattern is the real-data 'confirmation' in Section 5.3.3: the block structure and thresholds are estimated from the full-sample residual covariance, and the same sample is used both to identify assets near thresholds and to observe which assets toggle in the rolling-window backtest. This is an in-sample description rather than an external validation, so the paper overstates the evidential value of Figure 6. It does not, however, undermine the mathematical derivation or the controlled simulation comparisons, which are independent of this example. Because the central claim retains independent content and the circularity is confined to a supporting empirical illustration, the score is moderate rather than high.
Assumptions & free parameters
free parameters (1)
- epsilon (robustness margin) =
max_i θ_i / n (Eq. 15)
assumptions (4)
- domain assumption The covariance dependence structure is adequately captured by a block-diagonal constant-correlation matrix Ω=(1−ρ)Diag(Ω_i)+ρ11^T, or its single-block special case.
- domain assumption Single-linkage hierarchical clustering with correlation distance and the largest-gap cutoff (22) recover the economically meaningful blocks without an exogenous number of clusters.
- domain assumption Residualizing returns with respect to the market factor leaves a correlation matrix whose dominant structure is block-like, and the sample covariance estimated on the full window can be treated as true V for computing Area.
- standard math KKT conditions are necessary and sufficient for the convex QPs (1) and (4), and covariance matrices are positive semidefinite as specified.
Cite this review
Pith. "Pith review of Fragility of Minimum-Variance Portfolios." pith.science (2026). https://pith.science/paper/HYHRGHBH
@misc{pith2026260718624,
  author       = {Pith},
  title        = {Pith review of: Fragility of Minimum-Variance Portfolios},
  year         = {2026},
  howpublished = {\url{https://pith.science/paper/HYHRGHBH}},
  note         = {Machine review of arXiv:2607.18624}
}
read the original abstract
Minimum-variance portfolios are well known to be highly sensitive to covariance estimation error. In this paper, we show that by imposing a block diagonal correlation structure, we can derive closed-form expressions for long-only minimum-variance portfolios that make this fragility explicit. These analytical solutions reveal that fragility is driven by threshold effects arising from the interaction between correlation structure and the assets' volatilities. Motivated by the latter insight, we propose robustification approaches that can be interpreted as structured shrinkage schemes that selectively attenuate unstable coupling while preserving the dominant risk structure. Unlike global shrinkage techniques, the proposed corrections are analytically grounded, require minimal tuning, and remain closely aligned with the minimum-variance solution. The framework extends naturally to general covariance matrices through clustering-based approximations. Empirical results on controlled simulations highlight a clear regime dependence. In homogeneous volatility settings, correlation-oblivious shrinkage achieves the best trade-off between risk and stability. In contrast, under heterogeneous volatility, correlation-aware shrinkage performs best by inducing sparsity and avoiding exposure to high-risk assets. Across regimes, the proposed methods consistently reduce out-of-sample variance and turnover relative to classical and clustering-based benchmarks, providing a principled and practical approach to robust portfolio construction.
Figures


Figures from the paper (24 more)


Reference graph
Works this paper leans on
-
[1]
Portfolio selection.Journal of Finance, 7(1):77–91, 1952
Harry Markowitz. Portfolio selection.Journal of Finance, 7(1):77–91, 1952
1952
-
[2]
The markowitz optimization enigma: Is ‘optimized’optimal?Financial analysts journal, 45(1):31–42, 1989
Richard O Michaud. The markowitz optimization enigma: Is ‘optimized’optimal?Financial analysts journal, 45(1):31–42, 1989
1989
-
[3]
On the sensitivity of mean-variance-efficient portfolios to changes in asset means: some analytical and computational results.The review of financial studies, 4(2):315–342, 1991
Michael J Best and Robert R Grauer. On the sensitivity of mean-variance-efficient portfolios to changes in asset means: some analytical and computational results.The review of financial studies, 4(2):315–342, 1991
1991
-
[4]
The effect of errors in means, variances, and covariances on optimal portfolio choice.Journal of Portfolio Management, 19(2):6–11, 1993
Vijay K Chopra, William T Ziemba, et al. The effect of errors in means, variances, and covariances on optimal portfolio choice.Journal of Portfolio Management, 19(2):6–11, 1993
1993
-
[5]
Cambridge University Press Cambridge, UK, 1993
Peter Muller.Empirical tests of biases in equity portfolio optimization. Cambridge University Press Cambridge, UK, 1993
1993
-
[6]
Efficient asset management: a practical guide to stock portfolio optimization and asset allocation., 2001
Richard O Michaud and Tongshu Ma. Efficient asset management: a practical guide to stock portfolio optimization and asset allocation., 2001
2001
-
[7]
Portfolio choice problems
Michael W Brandt. Portfolio choice problems. InHandbook of financial econometrics: Tools and techniques, pages 269–336. Elsevier, 2010
2010
-
[8]
Efficient portfolio selection in a large market.Journal of Financial Econometrics, 14(3):496–524, 2016
Jiaqin Chen and Ming Yuan. Efficient portfolio selection in a large market.Journal of Financial Econometrics, 14(3):496–524, 2016
2016
Show all 70 references
-
[9]
Minimum-variance portfolios in the us equity market.Journal of Portfolio Management, 33(1):10, 2006
Roger Clarke, Harindra De Silva, and Steven Thorley. Minimum-variance portfolios in the us equity market.Journal of Portfolio Management, 33(1):10, 2006
2006
-
[10]
Optimal versus naive diversification: How inefficient is the 1/n portfolio strategy?The review of Financial studies, 22(5):1915–1953, 2009
Victor DeMiguel, Lorenzo Garlappi, and Raman Uppal. Optimal versus naive diversification: How inefficient is the 1/n portfolio strategy?The review of Financial studies, 22(5):1915–1953, 2009
1915
-
[11]
Balanced baskets: A new approach to trading and hedging risks.Journal of Investment Strategies (Risk Journals), 1(4), 2012
David H Bailey and Marcos Lopez de Prado. Balanced baskets: A new approach to trading and hedging risks.Journal of Investment Strategies (Risk Journals), 1(4), 2012
2012
-
[12]
Building diversified portfolios that outperform out-of-sample.Journal of Portfolio Management, 2016
Marcos Lopez de Prado. Building diversified portfolios that outperform out-of-sample.Journal of Portfolio Management, 2016
2016
-
[13]
CRC press, 2013
Thierry Roncalli.Introduction to risk parity and budgeting. CRC press, 2013. 55
2013
-
[14]
Minimum-variance portfolio composition.Journal of Portfolio Management, 37(2):31, 2011
Roger Clarke, Harindra De Silva, and Steven Thorley. Minimum-variance portfolio composition.Journal of Portfolio Management, 37(2):31, 2011
2011
-
[15]
Enhanced portfolio optimization.Financial Analysts Journal, 77(2):124–151, 2021
Lasse Heje Pedersen, Abhilash Babu, and Ari Levine. Enhanced portfolio optimization.Financial Analysts Journal, 77(2):124–151, 2021
2021
-
[16]
Spectrum estimation for large dimensional covariance matrices using random matrix theory.The Annals of Statistics, pages 2757–2790, 2008
Noureddine El Karoui. Spectrum estimation for large dimensional covariance matrices using random matrix theory.The Annals of Statistics, pages 2757–2790, 2008
2008
-
[17]
Cleaning large correlation matrices: tools from random matrix theory.Physics Reports, 666:1–109, 2017
Joël Bun, Jean-Philippe Bouchaud, and Marc Potters. Cleaning large correlation matrices: tools from random matrix theory.Physics Reports, 666:1–109, 2017
2017
-
[18]
Geometric representation of high dimension, low sample size data.Journal of the Royal Statistical Society Series B: Statistical Methodology, 67(3): 427–444, 2005
Peter Hall, James Stephen Marron, and Amnon Neeman. Geometric representation of high dimension, low sample size data.Journal of the Royal Statistical Society Series B: Statistical Methodology, 67(3): 427–444, 2005
2005
-
[19]
Thestatisticsandmathematicsofhighdimension low sample size asymptotics.Statistica Sinica, 26(4):1747, 2016
DanShen, HaipengShen, HongtuZhu, andJSMarron. Thestatisticsandmathematicsofhighdimension low sample size asymptotics.Statistica Sinica, 26(4):1747, 2016
2016
-
[20]
A survey of high dimension low sample size asymptotics.Australian & New Zealand journal of statistics, 60(1):4–19, 2018
Makoto Aoshima, Dan Shen, Haipeng Shen, Kazuyoshi Yata, Yi-Hui Zhou, and James S Marron. A survey of high dimension low sample size asymptotics.Australian & New Zealand journal of statistics, 60(1):4–19, 2018
2018
-
[21]
High-dimensionality effects in the markowitz problem and other quadratic programs with linear constraints: Risk underestimation.Ann
Noureddine El Karoui. High-dimensionality effects in the markowitz problem and other quadratic programs with linear constraints: Risk underestimation.Ann. Statist., 38(1):3487–3566, 2010
2010
-
[22]
On the realized risk of high-dimensional markowitz portfolios.SIAM Journal on Financial Mathematics, 4(1):737–783, 2013
Noureddine El Karoui. On the realized risk of high-dimensional markowitz portfolios.SIAM Journal on Financial Mathematics, 4(1):737–783, 2013
2013
-
[23]
Tractable stochastic analysis in high dimensions via robust optimization.Mathematical programming, 134(1):23–70, 2012
Chaithanya Bandi and Dimitris Bertsimas. Tractable stochastic analysis in high dimensions via robust optimization.Mathematical programming, 134(1):23–70, 2012
2012
-
[24]
The dispersion bias.SIAM Journal on Financial Mathematics, 13(2):521–550, 2022
Lisa R Goldberg, Alex Papanicolaou, and Alex Shkolnik. The dispersion bias.SIAM Journal on Financial Mathematics, 13(2):521–550, 2022
2022
-
[25]
The quadratic optimization bias of large covariance matrices
Hubeyb Gurdogan and Alex Shkolnik. The quadratic optimization bias of large covariance matrices. arXiv preprint arXiv:2410.03053, 2024
2024 arXiv
-
[26]
Portfolio selection revisited.Annals of Operations Research, 346(1):137–155, 2025
Alex Shkolnik, Alec Kercheval, Hubeyb Gurdogan, Lisa R Goldberg, and Haim Bar. Portfolio selection revisited.Annals of Operations Research, 346(1):137–155, 2025. 56
2025
-
[27]
A tool for filtering information in complex systems.Proceedings of the National Academy of Sciences, 102(30):10421–10426, 2005
Michele Tumminello, Tomaso Aste, Tiziana Di Matteo, and Rosario N Mantegna. A tool for filtering information in complex systems.Proceedings of the National Academy of Sciences, 102(30):10421–10426, 2005
2005
-
[28]
Community characterization of heterogeneous complex systems.Journal of Statistical Mechanics: Theory and Experiment, 2011(01):P01019, 2011
Michele Tumminello, Salvatore Micciche, Fabrizio Lillo, Jan Varho, Jyrki Piilo, and Rosario N Man- tegna. Community characterization of heterogeneous complex systems.Journal of Statistical Mechanics: Theory and Experiment, 2011(01):P01019, 2011
2011
-
[29]
Relation between financial market structure and the real economy: comparison between clustering methods.PloS one, 10(3):e0116201, 2015
Nicolo Musmeci, Tomaso Aste, and Tiziana Di Matteo. Relation between financial market structure and the real economy: comparison between clustering methods.PloS one, 10(3):e0116201, 2015
2015
-
[30]
Robust optimization–methodology and applications.Mathe- matical Programming, 92(3):453–480, 2002
Aharon Ben-Tal and Arkadi Nemirovski. Robust optimization–methodology and applications.Mathe- matical Programming, 92(3):453–480, 2002
2002
-
[31]
Theory and applications of robust optimization.SIAM review, 53(3):464–501, 2011
Dimitris Bertsimas, David B Brown, and Constantine Caramanis. Theory and applications of robust optimization.SIAM review, 53(3):464–501, 2011
2011
-
[32]
Robust mean-covariance solutions for stochastic optimization.Operations Research, 55 (1):98–112, 2007
Ioana Popescu. Robust mean-covariance solutions for stochastic optimization.Operations Research, 55 (1):98–112, 2007
2007
-
[33]
Robust portfolio selection problems.Mathematics of operations research, 28(1):1–38, 2003
Donald Goldfarb and Garud Iyengar. Robust portfolio selection problems.Mathematics of operations research, 28(1):1–38, 2003
2003
-
[34]
Robust portfolio control with stochastic factor dynamics.Operations Research, 61(4):874–893, 2013
Paul Glasserman and Xingbo Xu. Robust portfolio control with stochastic factor dynamics.Operations Research, 61(4):874–893, 2013
2013
-
[35]
Tütüncü and Mark Koenig
Reha H. Tütüncü and Mark Koenig. Robust asset allocation.Annals of Operations Research, 132(1): 157–187, 2004
2004
-
[36]
Worst-case value-at-risk and robust portfolio optimization: A conic programming approach.Operations research, 51(4):543–556, 2003
Laurent El Ghaoui, Maksim Oks, and Francois Oustry. Worst-case value-at-risk and robust portfolio optimization: A conic programming approach.Operations research, 51(4):543–556, 2003
2003
-
[37]
Markowitz portfolio construction at seventy.arXiv preprint arXiv:2401.05080, 2024
Stephen Boyd, Kasper Johansson, Ronald Kahn, Philipp Schiele, and Thomas Schmelzer. Markowitz portfolio construction at seventy.arXiv preprint arXiv:2401.05080, 2024
2024 arXiv
-
[38]
Addressing estimation errors on expected asset returns through robust portfolio optimization.Quantitative Finance, pages 1–14, 2026
Gérard Cornuéjols, Özgün Elçİ, and Vrishabh Patil. Addressing estimation errors on expected asset returns through robust portfolio optimization.Quantitative Finance, pages 1–14, 2026
2026
-
[39]
Fabozzi, Dashan Huang, and Guofu Zhou
Frank J. Fabozzi, Dashan Huang, and Guofu Zhou. Robust portfolios: Contributions from operations research and finance.Annals of Operations Research, 176(1):191–220, 2010. 57
2010
-
[40]
Data-driven robust optimization.Mathematical Programming, 167(2):235–292, 2018
Dimitris Bertsimas, Vishal Gupta, and Nathan Kallus. Data-driven robust optimization.Mathematical Programming, 167(2):235–292, 2018
2018
-
[41]
Computing return estimation error matrices for robust optimization.Axioma Research Papers, 1:1–9, 2005
RA Stubbs and P Vance. Computing return estimation error matrices for robust optimization.Axioma Research Papers, 1:1–9, 2005
2005
-
[42]
Distributionally robust optimization under moment uncertainty with application to data-driven problems.Operations research, 58(3):595–612, 2010
Erick Delage and Yinyu Ye. Distributionally robust optimization under moment uncertainty with application to data-driven problems.Operations research, 58(3):595–612, 2010
2010
-
[43]
Incorporating asymmetric distributional information in robust value-at-risk optimization.Management Science, 54(3):573–585, 2008
Karthik Natarajan, Dessislava Pachamanova, and Melvyn Sim. Incorporating asymmetric distributional information in robust value-at-risk optimization.Management Science, 54(3):573–585, 2008
2008
-
[44]
Quantifying distributional model risk via optimal transport
Jose Blanchet and Karthyek Murthy. Quantifying distributional model risk via optimal transport. Mathematics of Operations Research, 44(2):565–600, 2019
2019
-
[45]
Distributionally robust stochastic optimization with wasserstein distance
Rui Gao and Anton Kleywegt. Distributionally robust stochastic optimization with wasserstein distance. Mathematics of Operations Research, 48(2):603–655, 2023
2023
-
[46]
Honey, I Shrunk the Sample Covariance Matrix.The Journal of Portfolio Management, 30(4):110–119, 2004
Olivier Ledoit and Michael Wolf. Honey, I Shrunk the Sample Covariance Matrix.The Journal of Portfolio Management, 30(4):110–119, 2004
2004
-
[47]
A test for the number of factors in an approximate factor model.the Journal of Finance, 48(4):1263–1291, 1993
Gregory Connor and Robert A Korajczyk. A test for the number of factors in an approximate factor model.the Journal of Finance, 48(4):1263–1291, 1993
1993
-
[48]
Estimation with quadratic loss
William James, Charles Stein, et al. Estimation with quadratic loss. InProceedings of the fourth Berkeley symposium on mathematical statistics and probability, volume 1, pages 361–379. University of California Press, 1961
1961
-
[49]
Awell-conditionedestimatorforlarge-dimensionalcovariancematrices
OlivierLedoitandMichaelWolf. Awell-conditionedestimatorforlarge-dimensionalcovariancematrices. Journal of multivariate analysis, 88(2):365–411, 2004
2004
-
[50]
Shrinkage algorithms for mmse covariance estimation.IEEE transactions on signal processing, 58(10):5016–5029, 2010
Yilun Chen, Ami Wiesel, Yonina C Eldar, and Alfred O Hero. Shrinkage algorithms for mmse covariance estimation.IEEE transactions on signal processing, 58(10):5016–5029, 2010
2010
-
[51]
Riskmetricstm—technical document.Morgan Guaranty Trust Company of New York: New York, 51:54, 1996
Jacques Longerstaey and Martin Spencer. Riskmetricstm—technical document.Morgan Guaranty Trust Company of New York: New York, 51:54, 1996
1996
-
[52]
Nonlinear shrinkage estimation of large-dimensional covariance ma- trices.The Annals of Statistics, pages 1024–1060, 2012
Olivier Ledoit and Michael Wolf. Nonlinear shrinkage estimation of large-dimensional covariance ma- trices.The Annals of Statistics, pages 1024–1060, 2012. 58
2012
-
[53]
Nonlinear shrinkage of the covariance matrix for portfolio selection: Markowitz meets goldilocks.The Review of Financial Studies, 30(12):4349–4388, 2017
Olivier Ledoit and Michael Wolf. Nonlinear shrinkage of the covariance matrix for portfolio selection: Markowitz meets goldilocks.The Review of Financial Studies, 30(12):4349–4388, 2017
2017
-
[54]
Analytical nonlinear shrinkage of large-dimensional covariance matri- ces.The Annals of Statistics, 48(5):3043–3065, 2020
Olivier Ledoit and Michael Wolf. Analytical nonlinear shrinkage of large-dimensional covariance matri- ces.The Annals of Statistics, 48(5):3043–3065, 2020
2020
-
[55]
A generalized approach to portfolio optimization: Improving performance by constraining portfolio norms.Management science, 55(5):798–812, 2009
Victor DeMiguel, Lorenzo Garlappi, Francisco J Nogales, and Raman Uppal. A generalized approach to portfolio optimization: Improving performance by constraining portfolio norms.Management science, 55(5):798–812, 2009
2009
-
[56]
Machine learning and portfolio optimization
Gah-Yi Ban, Noureddine El Karoui, and Andrew EB Lim. Machine learning and portfolio optimization. Management Science, 64(3):1136–1154, 2018
2018
-
[57]
A scalable algorithm for sparse portfolio selection.IN- FORMS Journal on Computing, 34(3):1489–1511, 2022
Dimitris Bertsimas and Ryan Cory-Wright. A scalable algorithm for sparse portfolio selection.IN- FORMS Journal on Computing, 34(3):1489–1511, 2022
2022
-
[58]
Inverse optimization: A new perspective on the black-litterman model.Operations research, 60(6):1389–1403, 2012
Dimitris Bertsimas, Vishal Gupta, and Ioannis Ch Paschalidis. Inverse optimization: A new perspective on the black-litterman model.Operations research, 60(6):1389–1403, 2012
2012
-
[59]
A review of two decades of correlations, hierarchies, networks and clustering in financial markets.Progress in information geometry: Theory and applications, pages 245–274, 2021
Gautier Marti, Frank Nielsen, Mikołaj Bińkowski, and Philippe Donnat. A review of two decades of correlations, hierarchies, networks and clustering in financial markets.Progress in information geometry: Theory and applications, pages 245–274, 2021
2021
-
[60]
Can machine learning-based portfolios outperform traditional risk-based portfolios? the need to account for covariance misspecification.Risks, 7(3):74, 2019
Prayut Jain and Shashi Jain. Can machine learning-based portfolios outperform traditional risk-based portfolios? the need to account for covariance misspecification.Risks, 7(3):74, 2019
2019
-
[61]
Cross asset portfolios of tradable risk premia indices.Global Quantitative and Derivatives Strategy, JP Morgan, 2017
A Lau, M Kolanovic, T Lee, and R Krishnamachari. Cross asset portfolios of tradable risk premia indices.Global Quantitative and Derivatives Strategy, JP Morgan, 2017
2017
-
[62]
The hierarchical equal risk contribution portfolio.Available at SSRN 3237540, 2018
Thomas Raffinot. The hierarchical equal risk contribution portfolio.Available at SSRN 3237540, 2018
2018
-
[63]
Hierarchical clustering-based asset allocation.Journal of portfolio management, 44 (2):89–99, 2018
Thomas Raffinot. Hierarchical clustering-based asset allocation.Journal of portfolio management, 44 (2):89–99, 2018
2018
-
[64]
Hierarchical structure in financial markets.The European Physical Journal B- Condensed Matter and Complex Systems, 11(1):193–197, 1999
Rosario N Mantegna. Hierarchical structure in financial markets.The European Physical Journal B- Condensed Matter and Complex Systems, 11(1):193–197, 1999
1999
-
[65]
Common risk factors in the returns on stocks and bonds
Eugene F Fama and Kenneth R French. Common risk factors in the returns on stocks and bonds. Journal of financial economics, 33(1):3–56, 1993. 59
1993
-
[66]
Returns to buying winners and selling losers: Implications for stock market efficiency.The Journal of finance, 48(1):65–91, 1993
Narasimhan Jegadeesh and Sheridan Titman. Returns to buying winners and selling losers: Implications for stock market efficiency.The Journal of finance, 48(1):65–91, 1993
1993
-
[67]
Value and momentum everywhere
Clifford S Asness, Tobias J Moskowitz, and Lasse Heje Pedersen. Value and momentum everywhere. The journal of finance, 68(3):929–985, 2013
2013
-
[68]
Time series momentum.Journal of financial economics, 104(2):228–250, 2012
Tobias J Moskowitz, Yao Hua Ooi, and Lasse Heje Pedersen. Time series momentum.Journal of financial economics, 104(2):228–250, 2012
2012
-
[69]
Springer, 2021
Michael L Bynum, Gabriel A Hackebeil, William E Hart, Carl D Laird, Bethany L Nicholson, John D Siirola, Jean-Paul Watson, David L Woodruff, et al.Pyomo-optimization modeling in python, volume 67. Springer, 2021
2021
-
[70]
On the implementation of an interior-point filter line-search algorithm for large-scale nonlinear programming.Mathematical programming, 106(1):25–57, 2006
Andreas Wächter and Lorenz T Biegler. On the implementation of an interior-point filter line-search algorithm for large-scale nonlinear programming.Mathematical programming, 106(1):25–57, 2006. 60 Supplementary Material S1 Extended Results S1.1 Rank Heatmaps: Calibrated Sweep ...
2006
Reviewed August 1, 2026 · model on record in the stance chip above.
Discussion (0). Continue with ORCID to comment.