On the Burden of Achieving Fairness in Conformal Prediction
Pith reviewed 2026-05-19 17:03 UTC · model grok-4.3
The pith
Pooled calibration in conformal prediction creates irreducible group coverage distortion scaled by quantile heterogeneity and places equal coverage in direct conflict with equal set size.
A machine-rendered reading of the paper's core claim, the machinery that carries it, and where it could break.
Core claim
Through analysis of the underlying score distributions, the authors derive a conservation law and lower bound showing that pooled calibration incurs irreducible group-wise coverage distortion whose scale is set by cross-group quantile heterogeneity. They establish that the fairness definitions of Equalized Coverage and Equalized Set Size are fundamentally in tension, so that calibration policy choice determines whether the resulting distortion appears in the coverage dimension or the set-size dimension.
What carries the argument
The conservation law and lower bound on coverage distortion induced by cross-group quantile heterogeneity in the population score distributions.
If this is right
- Calibration policy determines the dimension in which cross-group heterogeneity manifests, either coverage or set size.
- Switching from pooled to group-specific calibration removes coverage distortion but changes relative set sizes across groups.
- The bidirectional trade-off between the two fairness criteria remains visible after finite-sample calibration on both synthetic and real data.
- No policy within the studied families eliminates cross-group heterogeneity; it only relocates the distortion.
Where Pith is reading between the lines
- Practitioners must explicitly choose which dimension to equalize based on whether coverage reliability or prediction-set size matters more for their use case.
- The lower bound supplies a concrete way to measure the minimum fairness cost imposed by a given dataset's group score differences before any calibration is chosen.
- The same conservation structure could be used to evaluate fairness trade-offs in other distribution-free uncertainty quantification procedures.
Load-bearing premise
The results rest on the assumption that population-level score distributions fully capture all relevant cross-group heterogeneity and that the derived bounds carry over to finite-sample calibration without extra effects.
What would settle it
A dataset in which pooled calibration is performed and the measured group-wise coverage deviations fall below the lower bound predicted from the groups' quantile differences, or in which both equal coverage and equal set sizes are observed simultaneously with no measurable trade-off.
Figures




read the original abstract
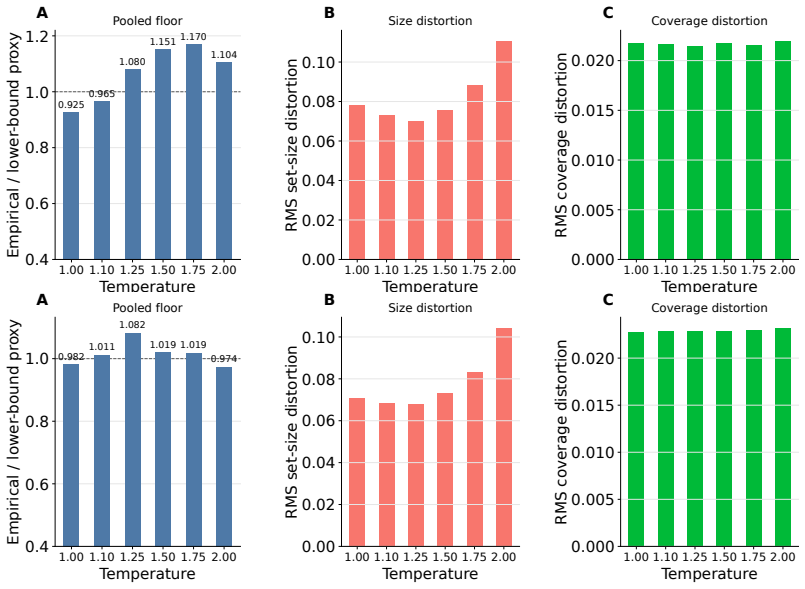
Conformal prediction is often calibrated with a single pooled threshold, but this can hide cross-group heterogeneity in score distributions and distort group-wise coverage. We study this phenomenon through the population score distributions underlying split conformal calibration. First, we derive a conservation law and lower bound showing that pooled calibration incurs irreducible group-wise coverage distortion at a scale set by cross-group quantile heterogeneity. Second, we demonstrate that the two leading fairness definitions for conformal prediction, Equalized Coverage and Equalized Set Size, are fundamentally in tension. Third, we quantify the cost of moving between policies which treat groups separately or pool them. Experiments on synthetic and real data confirm the same bidirectional trade-off after finite-sample calibration. Our results show that, for the policy families studied here, calibration choice does not remove cross-group heterogeneity; it determines whether the resulting distortion appears in the coverage or size dimension, providing a principled lens for analyzing fairness-oriented calibration choices in practice.
Editorial analysis
A structured set of objections, weighed in public.
Referee Report
Summary. The manuscript studies fairness issues in split conformal prediction arising from pooled calibration when score distributions differ across groups. It derives a conservation law and lower bound on irreducible group-wise coverage distortion from population score quantiles and their heterogeneity, shows that Equalized Coverage and Equalized Set Size are in fundamental tension, and quantifies the costs of moving between separate-group and pooled policies. Experiments on synthetic and real data are presented to confirm that the bidirectional trade-off persists after finite-sample calibration.
Significance. If the central results hold, the work supplies a useful theoretical lens for analyzing calibration choices in conformal prediction under group heterogeneity. The derivation of the conservation law directly from population score distributions (without reliance on fitted model parameters) is a clear strength, as is the explicit demonstration of tension between the two leading fairness notions and the quantification of policy costs. The experimental confirmation on real data adds practical relevance. These elements could help practitioners understand why fairness-oriented adjustments shift rather than eliminate distortion.
major comments (2)
- [theoretical derivation of the conservation law and lower bound] The conservation law and lower bound (derived from population score distributions and quantile heterogeneity) are asserted to characterize the distortion under finite-sample split conformal calibration. However, the manuscript provides no finite-sample error analysis or bound on the additional coverage distortion arising from the interaction between cross-group quantile heterogeneity and the sampling variability of empirical quantiles computed on the calibration set. This leaves open whether the population-level effect dominates the observed distortions or whether unmodeled finite-sample bias/variance is material.
- [analysis of tension between Equalized Coverage and Equalized Set Size] The claim that the two fairness definitions are fundamentally in tension is established at the population level. It is not shown whether this tension remains strict after replacing population quantiles with empirical ones, or whether finite-sample effects can partially alleviate or exacerbate the incompatibility between Equalized Coverage and Equalized Set Size.
minor comments (2)
- [methodology] Clarify the exact definition of the score function and how group membership is handled in the pooled versus separate calibration procedures to ensure reproducibility.
- [experiments] Add error bars or report the number of random trials and calibration-set sizes used in the synthetic and real-data experiments to allow assessment of variability.
Simulated Author's Rebuttal
We thank the referee for the constructive comments on our manuscript. The points raised regarding finite-sample considerations are well-taken and help sharpen the presentation of our population-level results. We address each major comment below and have revised the manuscript accordingly to clarify the scope of the theory and discuss empirical behavior.
read point-by-point responses
-
Referee: [theoretical derivation of the conservation law and lower bound] The conservation law and lower bound (derived from population score distributions and quantile heterogeneity) are asserted to characterize the distortion under finite-sample split conformal calibration. However, the manuscript provides no finite-sample error analysis or bound on the additional coverage distortion arising from the interaction between cross-group quantile heterogeneity and the sampling variability of empirical quantiles computed on the calibration set. This leaves open whether the population-level effect dominates the observed distortions or whether unmodeled finite-sample bias/variance is material.
Authors: We agree that the conservation law and lower bound are derived exactly at the population level from the true score distributions and their quantiles. The current manuscript does not include a rigorous finite-sample error analysis that bounds the additional distortion induced by the variability of empirical quantiles. This is a genuine limitation of the theoretical development. At the same time, the experiments (both synthetic, where distributions are known, and real-data) show that the observed group-wise coverage distortions track the population predictions closely for typical calibration sizes. In the revision we have added a paragraph in the discussion section that explicitly acknowledges the gap, invokes standard uniform convergence results for empirical quantiles to argue that the finite-sample distortion converges to the derived population bound as calibration-set size grows, and includes supplementary convergence plots in the appendix. revision: yes
-
Referee: [analysis of tension between Equalized Coverage and Equalized Set Size] The claim that the two fairness definitions are fundamentally in tension is established at the population level. It is not shown whether this tension remains strict after replacing population quantiles with empirical ones, or whether finite-sample effects can partially alleviate or exacerbate the incompatibility between Equalized Coverage and Equalized Set Size.
Authors: The proof that Equalized Coverage and Equalized Set Size are in fundamental tension is obtained by showing that, at the population level, satisfying one exactly forces the other to deviate unless cross-group quantile heterogeneity is zero. In finite samples the use of empirical quantiles introduces additional variability that could, in principle, create slack allowing partial satisfaction of both criteria simultaneously. Our experiments nevertheless demonstrate that the bidirectional trade-off persists under finite-sample calibration on both synthetic and real data, with the magnitude of the incompatibility scaling in line with the population prediction. In the revision we have added a short discussion paragraph clarifying that while finite-sample noise is present, the asymptotic incompatibility remains and is not alleviated by the empirical approximation; the experimental results are presented as supporting evidence that the tension is not an artifact of the population analysis. revision: yes
Circularity Check
No significant circularity; derivation is self-contained from population distributions
full rationale
The core claims rest on a direct derivation of a conservation law and lower bound from the population score distributions and their quantile heterogeneity, followed by an algebraic demonstration that Equalized Coverage and Equalized Set Size are in tension. Neither step reduces to a fitted parameter renamed as a prediction, a self-definitional loop, or a load-bearing self-citation whose content is itself unverified. The finite-sample extension is presented as an empirical confirmation rather than a mathematical reduction, and the paper does not invoke uniqueness theorems or ansatzes from prior author work to force its conclusions. The analysis therefore remains independent of its own outputs.
Axiom & Free-Parameter Ledger
axioms (1)
- domain assumption Population score distributions underlie split conformal calibration and capture cross-group heterogeneity.
Lean theorems connected to this paper
-
IndisputableMonolith/Cost/FunctionalEquation.leanwashburn_uniqueness_aczel unclear?
unclearRelation between the paper passage and the cited Recognition theorem.
Theorem 1. (Conservation law for pooled calibration) ... ∑ pg εg(q) = FS(q) − (1−α) =: δ(q). If FS is continuous at q, then δ(q)=0.
-
IndisputableMonolith/Foundation/AlphaCoordinateFixation.leanJ_uniquely_calibrated_via_higher_derivative unclear?
unclearRelation between the paper passage and the cited Recognition theorem.
Theorem 2. (Pooled-threshold uncertainty relation) Var(εG(q)) ≥ meff(q)² Var(qG).
What do these tags mean?
- matches
- The paper's claim is directly supported by a theorem in the formal canon.
- supports
- The theorem supports part of the paper's argument, but the paper may add assumptions or extra steps.
- extends
- The paper goes beyond the formal theorem; the theorem is a base layer rather than the whole result.
- uses
- The paper appears to rely on the theorem as machinery.
- contradicts
- The paper's claim conflicts with a theorem or certificate in the canon.
- unclear
- Pith found a possible connection, but the passage is too broad, indirect, or ambiguous to say the theorem truly supports the claim.
Reference graph
Works this paper leans on
-
[1]
Uncer- tainty sets for image classifiers using conformal prediction
Anastasios Nikolas Angelopoulos, Stephen Bates, Michael Jordan, and Jitendra Malik. Uncer- tainty sets for image classifiers using conformal prediction. InInternational Conference on Learning Representations, 2021
work page 2021
-
[2]
Francis Bach. A Convex Loss Function for Set Prediction with Optimal Trade-offs Between Size and Conditional Coverage.arXiv:2512.19142, 2025
-
[3]
Big Data 5(2), 153–163 (2017) https://doi.org/10.1089/big.2016.0047
Alexandra Chouldechova. Fair prediction with disparate impact: A study of bias in recidivism prediction instruments.Big data, 5(2):153–163, 2017. doi: 10.1089/big.2016.0047
-
[4]
Cresswell, Yi Sui, Bhargava Kumar, and Noël V ouitsis
Jesse C. Cresswell, Yi Sui, Bhargava Kumar, and Noël V ouitsis. Conformal prediction sets improve human decision making. InProceedings of the 41st International Conference on Machine Learning, 2024
work page 2024
-
[5]
Cresswell, Bhargava Kumar, Yi Sui, and Mouloud Belbahri
Jesse C. Cresswell, Bhargava Kumar, Yi Sui, and Mouloud Belbahri. Conformal prediction sets can cause disparate impact. InThe Thirteenth International Conference on Learning Representations, 2025
work page 2025
-
[6]
Dragan and Moritz Hardt , title =
Maria De-Arteaga, Alexey Romanov, Hanna Wallach, Jennifer Chayes, Christian Borgs, Alexan- dra Chouldechova, Sahin Geyik, Krishnaram Kenthapadi, and Adam Tauman Kalai. Bias in Bios: A Case Study of Semantic Representation Bias in a High-Stakes Setting. InProceedings of the Conference on Fairness, Accountability, and Transparency, page 120–128, 2019. ISBN ...
-
[7]
Aryeh Dvoretzky, Jack Kiefer, and Jacob Wolfowitz. Asymptotic minimax character of the sam- ple distribution function and of the classical multinomial estimator.The Annals of Mathematical Statistics, pages 642–669, 1956
work page 1956
-
[8]
Rina Foygel Barber, Emmanuel J Candès, Aaditya Ramdas, and Ryan J Tibshirani. The limits of distribution-free conditional predictive inference.Information and Inference: A Journal of the IMA, 10(2):455–482, 2021
work page 2021
-
[9]
Rina Foygel Barber, Emmanuel J Candès, Aaditya Ramdas, and Ryan J Tibshirani. De finetti’s theorem and related results for infinite weighted exchangeable sequences.Bernoulli, 30(4): 3004–3028, 2024
work page 2024
-
[10]
V olume optimality in conformal prediction with structured prediction sets
Chao Gao, Liren Shan, Vaidehi Srinivas, and Aravindan Vijayaraghavan. V olume optimality in conformal prediction with structured prediction sets. InProceedings of the 42nd International Conference on Machine Learning, volume 267, pages 18495–18527, 2025
work page 2025
-
[11]
Isaac Gibbs, John J Cherian, and Emmanuel J Candès. Conformal prediction with conditional guarantees.Journal of the Royal Statistical Society Series B: Statistical Methodology, 87(4): 1100–1126, 03 2025. ISSN 1369-7412. doi: 10.1093/jrsssb/qkaf008
-
[12]
Counterfactually fair conformal prediction
Ozgur Guldogan, Neeraj Sarna, Yuanyuan Li, and Michael Berger. Counterfactually fair conformal prediction. InProceedings of The 29th International Conference on Artificial Intelligence and Statistics, 2026
work page 2026
-
[13]
FACET: Fairness in computer vision evaluation benchmark
Laura Gustafson, Chloe Rolland, Nikhila Ravi, Quentin Duval, Aaron Adcock, Cheng-Yang Fu, Melissa Hall, and Candace Ross. FACET: Fairness in computer vision evaluation benchmark. InProceedings of the IEEE/CVF International Conference on Computer Vision, pages 20370– 20382, 2023
work page 2023
-
[14]
Equality of opportunity in supervised learning
Moritz Hardt, Eric Price, and Nati Srebro. Equality of opportunity in supervised learning. In Advances in Neural Information Processing Systems 29, pages 3315–3323, 2016
work page 2016
-
[15]
Inherent trade-offs in the fair determination of risk scores
Jon Kleinberg, Sendhil Mullainathan, and Manish Raghavan. Inherent trade-offs in the fair determination of risk scores. In8th Innovations in Theoretical Computer Science Conference, volume 67, pages 43:1–43:23, 2017. doi: 10.4230/LIPIcs.ITCS.2017.43
-
[16]
Claire Lazar Reich and Suhas Vijaykumar. A Possibility in Algorithmic Fairness: Can Calibra- tion and Equal Error Rates Be Reconciled? In2nd Symposium on Foundations of Responsible Computing, volume 192, pages 4:1–4:21, 2021. doi: 10.4230/LIPIcs.FORC.2021.4. 11
-
[17]
Meichen Liu, Lei Ding, Dengdeng Yu, Wulong Liu, Linglong Kong, and Bei Jiang. Conformal- ized fairness via quantile regression.Advances in Neural Information Processing Systems, 35: 11561–11572, 2022
work page 2022
- [18]
-
[19]
Learning Transferable Visual Models From Natural Language Supervision
Alec Radford, Jong Wook Kim, Chris Hallacy, Aditya Ramesh, Gabriel Goh, Sandhini Agar- wal, Girish Sastry, Amanda Askell, Pamela Mishkin, Jack Clark, Gretchen Krueger, and Ilya Sutskever. Learning Transferable Visual Models From Natural Language Supervision. In Proceedings of the 38th International Conference on Machine Learning, volume 139, pages 8748–8763, 2021
work page 2021
-
[20]
Yaniv Romano, Rina Foygel Barber, Chiara Sabatti, and Emmanuel Candès. With malice toward none: Assessing uncertainty via equalized coverage.Harvard Data Science Review, 2(2):4, 2020
work page 2020
-
[21]
DistilBERT, a distilled version of BERT: smaller, faster, cheaper and lighter
Victor Sanh, Lysandre Debut, Julien Chaumond, and Thomas Wolf. DistilBERT, a distilled version of BERT: smaller, faster, cheaper and lighter.arXiv:1910.01108, 2019
work page internal anchor Pith review Pith/arXiv arXiv 1910
-
[22]
A Tutorial on Conformal Prediction.Journal of Machine Learning Research, 9(12):371–421, 2008
Glenn Shafer and Vladimir V ovk. A Tutorial on Conformal Prediction.Journal of Machine Learning Research, 9(12):371–421, 2008
work page 2008
-
[23]
Bernard W Silverman.Density estimation for statistics and data analysis. Routledge, 2018
work page 2018
-
[24]
Davut Emre Tasar. The coverage-deferral trade-off: Fairness implications of conformal predic- tion in human-in-the-loop decision systems.Preprints, 2025. doi: 10.20944/preprints202512. 2631.v1
-
[25]
Vadlamani, Anutam Srinivasan, Pranav Maneriker, Ali Payani, and Srinivasan Parthasarathy
Aditya T. Vadlamani, Anutam Srinivasan, Pranav Maneriker, Ali Payani, and Srinivasan Parthasarathy. A generic framework for conformal fairness. InThe Thirteenth International Conference on Learning Representations, 2025
work page 2025
-
[26]
Mondrian confidence machine.Technical Report, 2003
Vladimir V ovk, David Lindsay, Ilia Nouretdinov, and Alex Gammerman. Mondrian confidence machine.Technical Report, 2003
work page 2003
-
[27]
Vladimir V ovk, Alexander Gammerman, and Glenn Shafer.Algorithmic learning in a random world. Springer, 2005
work page 2005
-
[28]
Fangxin Wang, Lu Cheng, Ruocheng Guo, Kay Liu, and Philip S Yu. Equal opportunity of coverage in fair regression.Advances in Neural Information Processing Systems, 36:7743–7755, 2023
work page 2023
-
[29]
A Broad-Coverage Challenge Corpus for Sentence Understanding through Inference
Adina Williams, Nikita Nangia, and Samuel Bowman. A broad-coverage challenge corpus for sentence understanding through inference. InProceedings of the 2018 Conference of the North American Chapter of the Association for Computational Linguistics: Human Language Technologies, Volume 1 (Long Papers), pages 1112–1122, 2018. doi: 10.18653/v1/N18-1101
-
[30]
Yanfei Zhou and Matteo Sesia. Conformal classification with equalized coverage for adaptively selected groups.Advances in Neural Information Processing Systems, 37:108760–108823, 2024. 12 Appendix Contents • Appendix A: Technical Discussion • Appendix B: Proofs of Theoretical Results • Appendix C: Additional Experimental Details • Appendix D:Bias in BiosE...
work page 2024
-
[31]
Under exact conservation,δ(q) = 0, we haveΩ o(q) Ωu(q)≥B 2 K. When q is the pooled population quantile and the mixture CDF FS is continuous at q, Theorem 1 givesδ(q) = 0, so the exact-conservation form in part 3 is the relevant pooled-calibration case. Theorem 6 refines Theorem 1 from a signed additive conservation law to a magnitude lower bound. The prod...
-
[32]
shows that in binary settings, when two groups have different base rates,πg =P(Y= 1|G=g) , predictive parity, i.e., equalPPVg =P(Y= 1| ˆY= 1, G=g) across groups, cannot generally hold simultaneously with equalized error profiles matching the false positive rates FPRg =P( ˆY= 1| Y= 0, G=g) and the true positive rates TPRg =P( ˆY= 1|Y= 1, G=g) . The incompa...
-
[33]
More precisely, for every g∈ H r \ {r},ℓ g(qg)−ℓ r(qr)≥c g >0
The group-wise thresholds {qg}g∈G, which achieve an exact group-wise coverage level 1−α , necessarily induce a nonzero cross-group disparity in expected set size. More precisely, for every g∈ H r \ {r},ℓ g(qg)−ℓ r(qr)≥c g >0. Consequently, max g,g ′∈G |ℓg(qg)−ℓ g′(qg′)| ≥max g∈Hr\{r} cg >0.(14) Therefore, exact group-wise coverage cannot simultaneously sa...
-
[34]
The restricted mean squared cross-group size disparity relative to the reference grouprsatisfies D2 r = X g∈Hr\{r} pg(ℓg(qg)−ℓ r(qr))2 ≥ X g∈Hr\{r} pgc2 g >0. (15) Proof. The group-wise thresholds {qg}g∈G achieve equalized coverage at level 1−α across groups. Now fix any g∈ H r \ {r}. By definition of Hr, we have qg ≥q r. Since t7→ℓ g(t) is non-decreasing...
-
[35]
Custom license, see dataset download agreement,
Under exact conservation,δ(q) = 0, we haveΩ o(q) Ωu(q)≥B 2 K. Proof. For any group with q≥q g, we have εg(q)≥m g(q−q g). Similarly, for any group with q≤q g, we haveε g(q)≤m g(q−q g). Therefore, we have Ωo(q)≥ X g wg(q−q g)+ =:A +(q) Ω u(q)≥ X g wg(qg −q) + =:A −(q).(37) At the crossing point¯qm, A+(¯qm) =A −(¯qm) = 1 2 X g wg|qg −¯qm|=B K.(38) Since A+(q...
work page 2000
discussion (0)
Sign in with ORCID, Apple, or X to comment. Anyone can read and Pith papers without signing in.