REVIEW 3 major objections 5 minor 80 references
Building a 39k-sample benchmark for end-to-end table extraction, the paper shows current methods lack generalization across document styles and produce unreliable confidence scores.
Reviewed by Pith at T0; open to challenge. T0 means a machine referee read the full paper against a public rubric. the ladder, T0–T4 →
T0 review · deepseek-v4-flash
2026-08-03 21:12 UTC pith:IBHVJMMF
load-bearing objection Solid end-to-end TE benchmark with two new datasets; the automatic ground truth for Table-arXiv is the main risk and needs independent validation before the ranking claims harden. the 3 major comments →
Benchmarking Table Extraction from Heterogeneous Scientific PDF Documents
The pith
A machine-rendered reading of the paper's core claim, the machinery that carries it, and where it could break.
Core claim
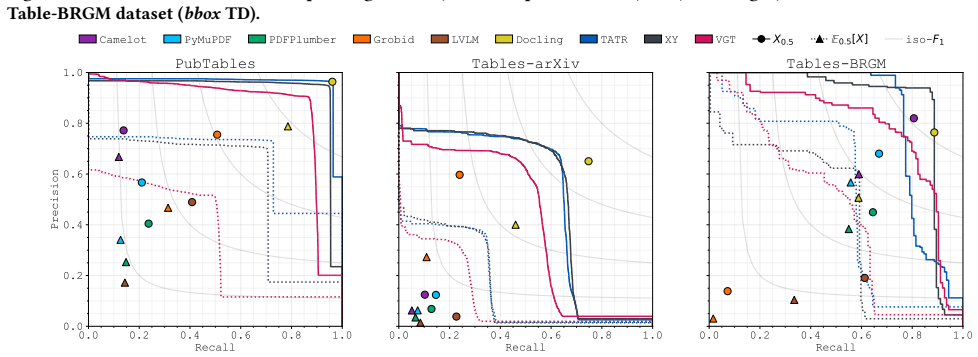
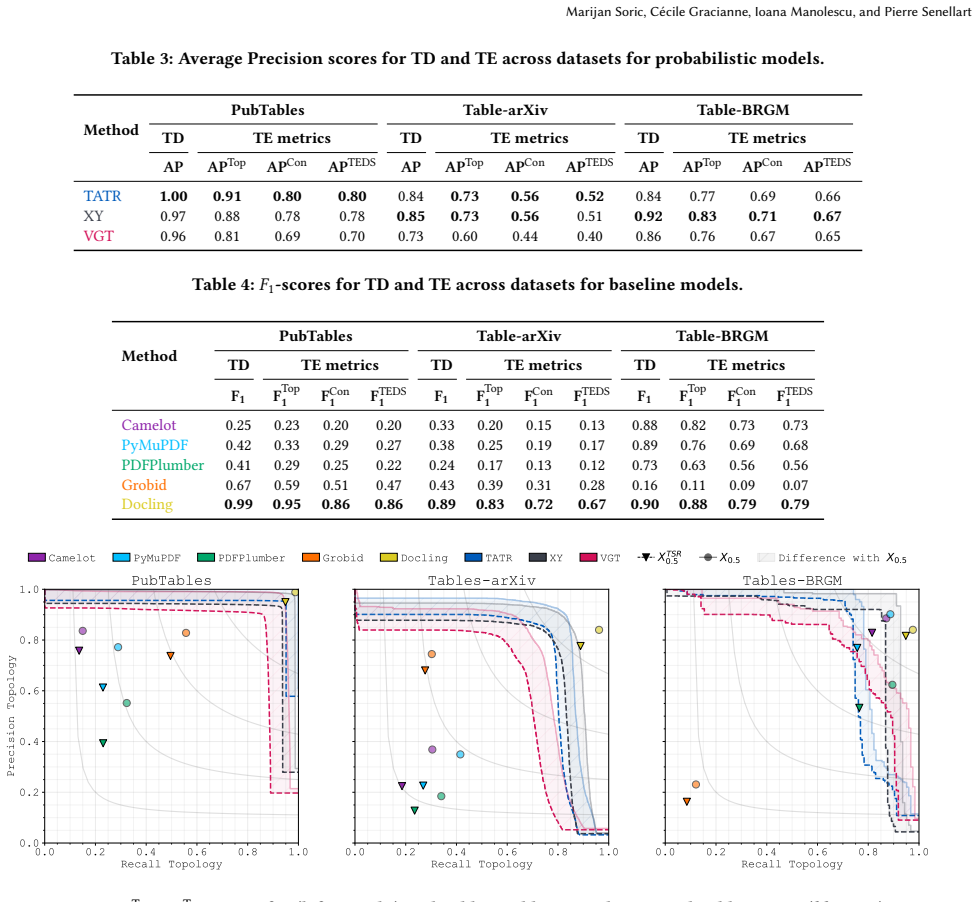
The central claim is that table extraction should be scored as a pipeline: only tables that are correctly detected (true positives by IoU or content similarity) are passed to structure recognition, so TSR|TD scores reflect real end-to-end quality. Under this protocol, detection-first methods show high detection precision on familiar layouts but sharp drops on the heterogeneous Table-arXiv set, while the vision-language model outputs plausible HTML yet cannot locate tables and occasionally hallucinates cell content. The paper also shows that detection confidence is often meaningless—for one detector on Table-arXiv, fewer than 2% of predictions with confidence in the 80–90% bin are true positi
What carries the argument
The evaluation machinery has four parts: (1) expected Precision/Recall metrics that treat the IoU matching threshold as a random variable with a triangular density (f0 or f0.5), giving threshold-stable scores; (2) content-Jaccard, a character 2-gram multiset overlap that lets models without bounding boxes, such as the vision-language model, be scored for detection; (3) TSR|TD, which computes structure metrics (GriTS, TEDS) only over true-positive detections, so detection errors propagate; and (4) two new ground-truth datasets, Table-arXiv (auto-instrumented LaTeX tabular environments plus LaTeXML to HTML) and a manually corrected geological-report dataset. Together these make subtask scores
Load-bearing premise
The entire evaluation rests on the correctness of the automatically generated ground truth: if instrumenting LaTeX tabular environments and converting with LaTeXML does not faithfully match the rendered PDF for tricky tables (macros, longtables, rotated tables), every reported score inherits those errors.
What would settle it
Take a random sample of 200 pages from Table-arXiv and have two independent human annotators draw table bounding boxes and transcribe cell content; if the human-agreement IoU or content F1 against the machine-generated ground truth falls below ~0.9, the benchmark's conclusions about model quality are not trustworthy.
If this is right
- Adopting end-to-end metrics (TSR|TD, expected P/R) will make published TD or TSR scores harder to inflate, since detection misses now cap structure scores.
- Model rankings depend on dataset style; a method can be nearly perfect on homogeneous biomedical pages and near-random on heterogeneous preprints, so evaluations need diverse corpora.
- Confidence scores should be part of the contract: only methods with calibrated confidence can support threshold choices or downstream uncertainty.
- The two new datasets—one heterogeneous automatic, one domain-specific manual—give the community public resources for measuring generalization.
- Tables embedded as images are currently invisible to token-based post-processing, a gap that end-to-end benchmarks expose.
Where Pith is reading between the lines
- The metric idea of integrating over a threshold distribution could transfer to other detection tasks (e.g., figure or formula extraction) where IoU thresholds are arbitrary.
- Because Table-arXiv is generated from LaTeX source, it would be straightforward to extend it to other source types or to perturb layouts, giving a testbed for robustness rather than just performance.
- The finding that a simple XY-cut preprocessor improves a DETR detector suggests cheap inference-time gains for many layout models; one could test whether similar segmentation helps other transformer detectors.
- The severe miscalibration result implies that practitioners should not read confidence as probability on specialized detectors; recalibration techniques could be benchmarked on this dataset.
Editorial analysis
A structured set of objections, weighed in public.
Referee Report
Summary. The paper proposes a benchmark for end-to-end table extraction (TE) from scientific PDFs. It introduces two new datasets, Table-arXiv (36,869 pages, auto-generated from LaTeX sources) and Table-BRGM (91 pages, manually corrected from model output), and reuses a subset of PubTables-1M as a third dataset. It defines new evaluation metrics: expected precision/recall over IoU thresholds, content-based TD, TSR|TD, and end-to-end TE metrics combining detection with GriTS/TEDS structure scores. Nine methods are evaluated, including Python libraries, Grobid, Docling, TATR-based pipelines, VGT+TATR, and an LVLM. The main empirical finding is that detection and structure recognition performance vary strongly across datasets, confidence scores are not always calibrated, and no method solves TE robustly.
Significance. If the datasets and the evaluation protocol are trustworthy, this is a useful contribution: it addresses a real gap by evaluating TE end-to-end rather than TD and TSR in isolation, it includes heterogeneous data, and it releases artifacts. The expected-metric derivation in Appendix B is a straightforward integral computation and is not circular; TSR|TD is an evaluation design choice, not a circular argument. The paper also provides a careful comparison of bbox-based and content-based detection, which is informative. However, the central generalizability claim currently rests on automatically generated ground truth that has not been validated, and on a content-based matching procedure with low recall on the largest new dataset. These issues are load-bearing, so the contribution is conditional pending validation or a substantial reframing.
major comments (3)
- [Section 3, Table-arXiv] The largest new dataset is annotated fully automatically: TD anchors are inserted by instrumenting LaTeX tabular environments, and TSR/TCR content is produced by LaTeXML from the LaTeX source. No human verification or error analysis is reported. LaTeXML parses source rather than the rendered PDF, so tables built with tabular*, longtable, tabularx, macros, package redefinitions, or nested environments can yield HTML that differs from what a user sees in the PDF, and anchor placement can fail. Every Table-arXiv score in Tables 3, 4, 6, 7 and in the figures inherits these potential errors. Since cross-dataset performance gaps are the basis for the 'lack of generalizability' conclusion, this is load-bearing. Please add a validation study, e.g., a random audit of 100-200 pages comparing generated annotations against the rendered PDFs, with error statistics by failure type, and make the genera
- [Section 6.2 and Appendix C.2] The TSR|TD results in Figure 7 are computed using content-based table matching, and Table 5 reports that the content-Jaccard classifier has recall 0.65 on Table-arXiv at the chosen threshold. This means roughly one third of true table detections are not matched on the largest new dataset, which can depress TSR scores for all models. The paper should make bboxTD-based TSR/TE results (already present in Appendix D.1/D.2) the primary evidence, or justify why the low recall of content matching does not bias the cross-dataset conclusions. At minimum, the main text should report both bboxTD and contentTD TSR results and discuss their divergence.
- [Section 3, Table-BRGM] Table-BRGM contains only 6 PDFs, 91 pages, and 124 tables, and its TSR annotations were produced by first running an end-to-end model and then manually correcting the output. This is a useful domain-specific pilot, but it is too small and too dependent on the seeding model to support strong comparative claims. A single table error changes an AP/F1 score by roughly 0.008, which is enough to affect some rankings. The paper should explicitly treat Table-BRGM as exploratory, and the heterogeneity/generalizability claims should rest primarily on Table-arXiv and PubTables.
minor comments (5)
- [Abstract / Table 1] The abstract says 86k pages and 39k new samples, but Table 1 sums to 83,902 pages and 36,960 new samples. Please reconcile these numbers.
- [Figures 4, 5, 15] Dataset names are inconsistent: Figures 4-5 use 'Tables-arXiv' and 'Tables-BRGM', while Figure 15 uses 'Test-arXiv'. Please standardize to 'Table-arXiv' and 'Table-BRGM'.
- [Section 5.2.3] Normalizing all HTML to <table>, <tr>, <td> discards thead/tbody distinctions. This is a reasonable choice for comparability, but the paper should state that TSR metrics therefore do not measure functional header/body analysis, since some methods are capable of it.
- [Section 7.2] The sentence 'As noted in [46], LVLM struggles with small text...' cites the GPT-4o mini product page. Please cite a peer-reviewed or arXiv study that actually evaluates this behavior.
- [Section 4.1.3] The paper honestly notes possible contamination for the LVLM, but the main text does not discuss how this could affect the rankings. A short paragraph on contamination risk would help readers interpret LVLM results.
Circularity Check
No significant circularity: the benchmark's ground truth, metrics, and evaluation protocol are independent of the models under test, and all metric composites are explicitly defined and their limitations acknowledged.
full rationale
Walking the derivation chain, no load-bearing step reduces to its own input by construction. (1) Ground truth is generated through channels independent of the evaluated methods: Table-arXiv TD/TSR annotations come from LaTeX-source instrumentation and LaTeXML (Section 3), an external parser; Table-BRGM is manually annotated (Section 3, with the caveat that manual correction follows model output, which is a data-quality concern, not circularity); PubTables-Test combines the externally built PubTables-1M coordinates with retrieved PDFs. None of these define GT in terms of any model's predictions. (2) The expected metrics (Section 5.1.1, Definition 1, Appendix B) are closed-form integral computations: E[1[J_i>theta_J]] = J_i^2 for f_0, and (4/3)(J_i^2 - 1/4)*1[J_i>0.5] for f_0.5. The densities f_0 and f_0.5 are explicitly chosen ('we chose two different functions'), not derived from a uniqueness theorem, so there is no disguised input. (3) The composite metrics TSR|TD and P^TSR/R^TSR (Definition 2, Section 6.2) are transparent compositions, and the paper itself flags their limitation: 'We can no longer directly compare TSR|TD results between models, since the input dataset P++|TSR is different for each model' (Section 6.2) and 'scores cannot be directly compared' (Section 7.3). No by-construction identity equates a detection score with a structure score. (4) There are no load-bearing self-citations: the derivation chain relies on external prior work (TATR/PubTables-1M [57], GriTS [59], TEDS [67], TableFormer [44], Docling [2]), none authored by the present authors, and no 'uniqueness' or rescaling ansatz is imported from the authors' own prior work. (5) In-scope limitation statements that must be weighed: Section 7.3 acknowledges that 'every tokenization method introduces biases, making it harder to closely match the GT', and Appendix C.2 reports that content-Jaccard as a TP/FP classifier has recall only 0.65 on Table-arXiv. These are measurement-fidelity caveats correctly identified as validity risks for contentTD and content-based TSR metrics; they weaken the rigor of specific comparisons but do not make any claimed value equal to its input. Likewise, the tuning of TATR/XY/VGT hyperparameters 'adjusted based on TATR-s' (Section 7.1) is in-sample tuning, a correctness/methodology risk, not a fitted parameter renamed as a prediction, and it cannot manufacture the central claim that TE remains challenging. Under the required standard — quote a specific reducti
Axiom & Free-Parameter Ledger
free parameters (4)
- TATR positive-prediction confidence threshold =
0.05
- XY-cut top-k predictions =
2
- padding sizes ppx,s and ppx,d =
100 px; 10 px
- content-Jaccard positive threshold =
0.5
axioms (5)
- domain assumption Instrumenting LaTeX tabular environments and LaTeXML produce accurate TD and TSR ground truth for Table-arXiv.
- domain assumption Tables can be modeled as axis-aligned rectangles, possibly rotated by exactly ±90 degrees.
- domain assumption Normalizing HTML to only <table>, <tr>, <td> discards only irrelevant markup.
- domain assumption IoU > 0.5 is a valid definition of table detection true-positive.
- domain assumption Confidence scores can be treated as probabilities for calibration analysis.
read the original abstract
Table Extraction (TE) consists in extracting tables from PDF documents, in a structured format enabling automatic processing. While numerous TE tools exist, the variety of methods and techniques makes it difficult for users to choose the most appropriate one. We propose a novel benchmark for assessing end-to-end TE methods (from PDF to the final table) over 86k pages. We contribute an analysis of TE evaluation metrics, and a novel, rigorous evaluation process, which allows scoring each TE sub-task as well as end-to-end TE, and captures model uncertainty. Along with prior datasets, our benchmark comprises two new heterogeneous datasets of 39k samples. We run our benchmark on diverse models, including off-the-shelf libraries, tools, computer vision-based models and modern approaches using general and specialized vision language models. The results demonstrate that TE remains challenging: current methods suffer from a lack of generalizability when facing heterogeneous data, and from limitations in robustness and interpretability.
Figures






Reference graph
Works this paper leans on
-
[1]
Amihood Amir, Tzvika Hartman, Oren Kapah, Braha Shalom, and Dekel Tsur
-
[2]
Christoph Auer, Maksym Lysak, Ahmed Nassar, Michele Dolfi, Nikolaos Livathi- nos, Panos Vagenas, Cesar Berrospi Ramis, Matteo Omenetti, Fabian Lindlbauer, Kasper Dinkla, Lokesh Mishra, Yusik Kim, Shubham Gupta, Rafael Teixeira de Lima, Valery Weber, Lucas Morin, Ingmar Meijer, Viktor Kuropiatnyk, and Peter W. J. Staar. 2024. Docling Technical Report. arXi...
Pith/arXiv arXiv 2024
-
[3]
Muhammad Imam Luthfi Balaka, David Alexander, Qiming Wang, Yue Gong, Adila Krisnadhi, and Raul Castro Fernandez. 2025. Pneuma: Leveraging LLMs for Tabular Data Representation and Retrieval.Proc. ACM Manag. Data3, 3 (2025), 200:1–200:28
2025
-
[4]
Galal M. Binmakhashen and Sabri A. Mahmoud. 2019. Document Layout Analysis: A Comprehensive Survey.ACM Comput. Surv.52, 6, Article 109 (Oct. 2019), 36 pages. https://doi.org/10.1145/3355610
doi:10.1145/3355610 2019
-
[5]
Zhaowei Cai and Nuno Vasconcelos. 2017. Cascade R-CNN: Delving into High Quality Object Detection. arXiv:1712.00726 [cs.CV] https://arxiv.org/abs/1712. 00726
Pith/arXiv arXiv 2017
-
[6]
Nicolas Carion, Francisco Massa, Gabriel Synnaeve, Nicolas Usunier, Alexan- der Kirillov, and Sergey Zagoruyko. 2020. End-to-End Object Detection with Transformers. arXiv:2005.12872 [cs.CV] https://arxiv.org/abs/2005.12872
Pith/arXiv arXiv 2020
-
[7]
Surekha Chandran and Rangachar Kasturi. 1993. Structural recognition of tabu- lated data. InProceedings of 2nd International Conference on Document Analysis and Recognition (ICDAR’93). IEEE, 516–519
1993
-
[8]
Zewen Chi, Heyan Huang, Heng-Da Xu, Houjin Yu, Wanxuan Yin, and Xian- Ling Mao. 2019. Complicated Table Structure Recognition.arXiv preprint arXiv:1908.04729(2019)
Pith/arXiv arXiv 2019
-
[9]
Cheng Da, Chuwei Luo, Qi Zheng, and Cong Yao. 2023. Vision Grid Transformer for Document Layout Analysis. arXiv:2308.14978 [cs.CV] https://arxiv.org/abs/ 2308.14978
Pith/arXiv arXiv 2023
-
[10]
Jacob Devlin, Ming-Wei Chang, Kenton Lee, and Kristina Toutanova. 2019. BERT: Pre-training of Deep Bidirectional Transformers for Language Understanding. arXiv:1810.04805 [cs.CL] https://arxiv.org/abs/1810.04805
Pith/arXiv arXiv 2019
-
[11]
Alexey Dosovitskiy, Lucas Beyer, Alexander Kolesnikov, Dirk Weissenborn, Xiaohua Zhai, Thomas Unterthiner, Mostafa Dehghani, Matthias Minderer, Georg Heigold, Sylvain Gelly, Jakob Uszkoreit, and Neil Houlsby. 2021. An Image is Worth 16x16 Words: Transformers for Image Recognition at Scale. arXiv:2010.11929 [cs.CV] https://arxiv.org/abs/2010.11929
Pith/arXiv arXiv 2021
-
[12]
Tapio Elomaa. 2013. Anssi Nurminen Algorithmic Extraction of Data in Tables in PDF Documents. https://api.semanticscholar.org/CorpusID:33157514
2013
-
[13]
Mark Everingham, Luc Van Gool, Christopher KI Williams, John Winn, and Andrew Zisserman. 2010. The pascal visual object classes (voc) challenge.Inter- national journal of computer vision88 (2010), 303–338
2010
-
[14]
Miao Fan and Doo Soon Kim. 2015. Detecting Table Region in PDF Documents Using Distant Supervision. arXiv:1506.08891 [cs.CV]
Pith/arXiv arXiv 2015
-
[15]
Felzenszwalb, Ross B
Pedro F. Felzenszwalb, Ross B. Girshick, David McAllester, and Deva Ramanan
-
[16]
Liangcai Gao, Yilun Huang, Hervé Déjean, Jean-Luc Meunier, Qinqin Yan, Yu Fang, Florian Kleber, and Eva Lang. 2019. ICDAR 2019 Competition on Table Detection and Recognition (cTDaR). In2019 International Conference on Document Analysis and Recognition (ICDAR). 1510–1515. https://doi.org/10.1109/ICDAR. 2019.00243
arXiv 2019
-
[17]
Perantonis
Basilios Gatos, Dimitrios Danatsas, Ioannis Pratikakis, and Stavros J. Perantonis
-
[18]
Max Göbel, Tamir Hassan, Ermelinda Oro, and Giorgio Orsi. 2012. A method- ology for evaluating algorithms for table understanding in PDF documents. In Proceedings of the 2012 ACM Symposium on Document Engineering(Paris, France) (DocEng ’12). Association for Computing Machinery, New York, NY, USA, 45–48. https://doi.org/10.1145/2361354.2361365
arXiv 2012
-
[19]
Chuan Guo, Geoff Pleiss, Yu Sun, and Kilian Q. Weinberger. 2017. On Calibration of Modern Neural Networks. arXiv:1706.04599 [cs.LG] https://arxiv.org/abs/ 1706.04599
Pith/arXiv arXiv 2017
-
[20]
Yuxiang Guo, Zhonghao Hu, Yuren Mao, Baihua Zheng, Yunjun Gao, and Mingwei Zhou. 2025. Birdie: Natural Language-Driven Table Discovery Us- ing Differentiable Search Index.ArXiv preprintabs/2504.21282 (2025). https: //arxiv.org/abs/2504.21282
Pith/arXiv arXiv 2025
-
[21]
Jaekyu Ha, R.M. Haralick, and I.T. Phillips. 1995. Recursive X-Y cut using bound- ing boxes of connected components. InProceedings of 3rd International Con- ference on Document Analysis and Recognition, Vol. 2. 952–955 vol.2. https: //doi.org/10.1109/ICDAR.1995.602059
arXiv 1995
-
[22]
Leipeng Hao, Liangcai Gao, Xiaohan Yi, and Zhi Tang. 2016. A table detection method for pdf documents based on convolutional neural networks. In2016 12th IAPR Workshop on Document Analysis Systems (DAS). IEEE, 287–292
2016
-
[23]
Gaurav Harit and Anukriti Bansal. 2012. Table detection in document images using header and trailer patterns. InProceedings of the Eighth Indian Conference on Computer Vision, Graphics and Image Processing(Mumbai, India)(ICVGIP ’12). Association for Computing Machinery, New York, NY, USA, Article 62, 8 pages. https://doi.org/10.1145/2425333.2425395
arXiv 2012
-
[24]
PMC Open Access Subset [Internet]. 2003. . Bethesda (MD): National Library of Medicine. Retrieved June 23, 2025 from https://pmc.ncbi.nlm.nih.gov/tools/ openftlist/
2003
-
[25]
Katsuhiko Itonori. 1993. Table structure recognition based on textblock arrange- ment and ruled line position. InProceedings of 2nd International Conference on Document Analysis and Recognition (ICDAR’93). IEEE, 765–768
1993
-
[26]
MAC Akmal Jahan and Roshan G Ragel. 2014. Locating tables in scanned documents for reconstructing and republishing. In7th International Conference on Information and Automation for Sustainability. IEEE, 1–6
2014
-
[27]
Dimosthenis Karatzas, Faisal Shafait, Seiichi Uchida, Masakazu Iwamura, Lluis Gomez i Bigorda, Sergi Robles Mestre, Joan Mas, David Fernandez Mota, Jon Al- mazàn Almazàn, and Lluís Pere de las Heras. 2013. ICDAR 2013 Robust Reading Competition. In2013 12th International Conference on Document Analysis and Recognition. 1484–1493. https://doi.org/10.1109/IC...
-
[28]
Thotreingam Kasar, Philippine Barlas, Sebastien Adam, Clément Chatelain, and Thierry Paquet. 2013. Learning to detect tables in scanned document images using line information. In2013 12th international conference on document analysis and recognition. IEEE, 1185–1189
2013
-
[29]
Aamod Khatiwada, Roee Shraga, and Renée J. Miller. 2026. Diverse Unionable Tuple Search: Novelty-Driven Discovery in Data Lakes. InProceedings 29th In- ternational Conference on Extending Database Technology, EDBT 2026, Tampere, Finland, March 24-27, 2026, Wolfgang Lehner, Vanessa Braganholo, Kostas Ste- fanidis, Zheying Zhang, Alexander Krause, and João ...
-
[30]
Thomas Kieninger and Andreas Dengel. 1998. The T-Recs Table Recognition and Analysis System, Vol. 1655. 255–269. https://doi.org/10.1007/3-540-48172-9_21
-
[31]
Ioannidis, Christos Faloutsos, George Karypis, and Asterios Katsifodimos
Christos Koutras, Jiani Zhang, Xiao Qin, Chuan Lei, Vassilis N. Ioannidis, Christos Faloutsos, George Karypis, and Asterios Katsifodimos. 2025. OmniMatch: Join- ability Discovery in Data Products.Proc. VLDB Endow.18, 11 (2025), 4588–4601. https://www.vldb.org/pvldb/vol18/p4588-koutras.pdf
2025
-
[32]
Fabian Kuppers, Jan Kronenberger, Amirhossein Shantia, and Anselm Haselhoff
-
[33]
Levenshtein
Vladimir I. Levenshtein. 1965. Binary codes capable of correcting deletions, insertions, and reversals.Soviet physics. Doklady10 (1965), 707–710. https: //api.semanticscholar.org/CorpusID:60827152
1965
-
[34]
Junlong Li, Yiheng Xu, Tengchao Lv, Lei Cui, Cha Zhang, and Furu Wei
-
[35]
Minghao Li, Lei Cui, Shaohan Huang, Furu Wei, Ming Zhou, and Zhoujun Li
-
[36]
Minghao Li, Lei Cui, Shaohan Huang, Furu Wei, Ming Zhou, and Zhoujun Li. 2020. TableBank: Table Benchmark for Image-based Table Detection and Recognition. InProceedings of the Twelfth Language Resources and Evaluation Conference, Nicoletta Calzolari, Frédéric Béchet, Philippe Blache, Khalid Choukri, Christopher Cieri, Thierry Declerck, Sara Goggi, Hitoshi...
2020
-
[37]
Chin-Yew Lin. 2004. ROUGE: A Package for Automatic Evaluation of Summaries. InText Summarization Branches Out. Association for Computational Linguistics, Barcelona, Spain, 74–81. https://aclanthology.org/W04-1013/
2004
-
[38]
Tsung-Yi Lin, Michael Maire, Serge J. Belongie, Lubomir D. Bourdev, Ross B. Gir- shick, James Hays, Pietro Perona, Deva Ramanan, Piotr Dollár, and C. Lawrence Zitnick. 2014. Microsoft COCO: Common Objects in Context.CoRRabs/1405.0312 (2014). arXiv:1405.0312 http://arxiv.org/abs/1405.0312
Pith/arXiv arXiv 2014
-
[39]
Tsung-Yi Lin, Priya Goyal, Ross Girshick, Kaiming He, and Piotr Dollár. 2018. Focal Loss for Dense Object Detection. arXiv:1708.02002 [cs.CV] https://arxiv. org/abs/1708.02002
Pith/arXiv arXiv 2018
-
[40]
Patrice Lopez. 2009. GROBID: Combining Automatic Bibliographic Data Recogni- tion and Term Extraction for Scholarship Publications. InResearch and Advanced Technology for Digital Libraries, Maristella Agosti, José Borbinha, Sarantos Kap- idakis, Christos Papatheodorou, and Giannis Tsakonas (Eds.). Springer Berlin Heidelberg, Berlin, Heidelberg, 473–474
2009
-
[41]
Maksym Lysak, Ahmed Nassar, Nikolaos Livathinos, Christoph Auer, and Peter Staar. 2023. Optimized Table Tokenization for Table Structure Recognition. In Document Analysis and Recognition - ICDAR 2023, Gernot A. Fink, Rajiv Jain, Koichi Kise, and Richard Zanibbi (Eds.). Springer Nature Switzerland, Cham, Benchmarking Table Extraction from Heterogeneous Sci...
2023
-
[42]
Chixiang Ma, Weihong Lin, Lei Sun, and Qiang Huo. 2023. Robust Table Detection and Structure Recognition from Heterogeneous Document Images.Pattern Recognition133 (Jan. 2023), 109006. https://doi.org/10.1016/j.patcog.2022.109006
arXiv 2023
-
[43]
Cooper, and Milos Hauskrecht
Mahdi Pakdaman Naeini, Gregory F. Cooper, and Milos Hauskrecht. 2015. Ob- taining well calibrated probabilities using bayesian binning. InProceedings of the Twenty-Ninth AAAI Conference on Artificial Intelligence(Austin, Texas)(AAAI’15). AAAI Press, 2901–2907
2015
-
[44]
Ahmed Nassar, Nikolaos Livathinos, Maksym Lysak, and Peter Staar. 2022. Table- Former: Table Structure Understanding With Transformers. InProceedings of the IEEE/CVF Conference on Computer Vision and Pattern Recognition (CVPR). 4614–4623. https://doi.org/10.1109/CVPR52688.2022.00457
arXiv 2022
-
[45]
Alexandru Niculescu-Mizil and Rich Caruana. 2005. Predicting good probabilities with supervised learning. InProceedings of the 22nd International Conference on Machine Learning(Bonn, Germany)(ICML ’05). Association for Computing Ma- chinery, New York, NY, USA, 625–632. https://doi.org/10.1145/1102351.1102430
arXiv 2005
-
[46]
2024.GPT-4o mini: advancing cost-efficient intelligence
OpenAI. 2024.GPT-4o mini: advancing cost-efficient intelligence. Retrieved May 26, 2025 from https://openai.com/index/gpt-4o-mini-advancing-cost-efficient- intelligence/?utm_source=chatgpt.com
2024
-
[47]
Kishore Papineni, Salim Roukos, Todd Ward, and Wei-Jing Zhu. 2002. Bleu: a Method for Automatic Evaluation of Machine Translation. InAnnual Meeting of the Association for Computational Linguistics. https://api.semanticscholar.org/ CorpusID:11080756
2002
-
[48]
Paton, Jiaoyan Chen, and Zhenyu Wu
Norman W. Paton, Jiaoyan Chen, and Zhenyu Wu. 2024. Dataset Discovery and Exploration: A Survey.ACM Comput. Surv.56, 4 (2024), 102:1–102:37. https: //doi.org/10.1145/3626521
doi:10.1145/3626521 2024
-
[49]
Mateusz Pawlik and Nikolaus Augsten. 2016. Tree edit distance: Robust and memory-efficient.Information Systems56 (2016), 157–173. https://doi.org/10. 1016/j.is.2015.08.004
2016
-
[50]
Pedregosa, G
F. Pedregosa, G. Varoquaux, A. Gramfort, V. Michel, B. Thirion, O. Grisel, M. Blondel, P. Prettenhofer, R. Weiss, V. Dubourg, J. Vanderplas, A. Passos, D. Cour- napeau, M. Brucher, M. Perrot, and E. Duchesnay. 2011. Scikit-learn : Aver- age precision score.Journal of Machine Learning Research12 (2011), 2825–
2011
-
[51]
Nassar, and Peter Staar
Birgit Pfitzmann, Christoph Auer, Michele Dolfi, Ahmed S. Nassar, and Peter Staar
-
[52]
Pyreddy and W
P. Pyreddy and W. B. Croft. 1997.TINTI: A System for Retrieval in Text Tables TITLE2:. Technical Report. USA
1997
-
[53]
Mahmoud Salaheldin Kasem, Abdelrahman Abdallah, Alexander Berendeyev, Ebrahem Elkady, Mohamed Mahmoud, Mahmoud Abdalla, Mohamed Hamada, Sebastiano Vascon, Daniyar Nurseitov, and Islam Taj-Eddin. 2024. Deep Learning for Table Detection and Structure Recognition: A Survey.ACM Comput. Surv.56, 12, Article 305 (Oct. 2024), 41 pages. https://doi.org/10.1145/3657281
-
[54]
Sebastian Schreiber, Stefan Agne, Ivo Wolf, Andreas Dengel, and Sheraz Ahmed
-
[55]
2025.pdfplumber
Jeremy Singer-Vine and The pdfplumber contributors. 2025.pdfplumber. https: //github.com/jsvine/pdfplumber
2025
-
[56]
2021.Table Transformer
Brandon Smock and Rohith Pesala. 2021.Table Transformer. https://github.com/ microsoft/table-transformer
2021
-
[57]
Brandon Smock, Rohith Pesala, and Robin Abraham. 2022. PubTables-1M: To- wards Comprehensive Table Extraction From Unstructured Documents. InPro- ceedings of the IEEE/CVF Conference on Computer Vision and Pattern Recognition (CVPR). 4634–4642
2022
-
[58]
Brandon Smock, Rohith Pesala, and Robin Abraham. 2023. Aligning Benchmark Datasets for Table Structure Recognition. InDocument Analysis and Recognition - ICDAR 2023, Gernot A. Fink, Rajiv Jain, Koichi Kise, and Richard Zanibbi (Eds.). Springer Nature Switzerland, Cham, 371–386
2023
-
[59]
DocLayNet: A Large Human-Annotated Dataset for Document-Layout Segmentation. InProceedings of the 28th ACM SIGKDD Conference on Knowledge Discovery and Data Mining(Washington DC, USA)(KDD ’22). Association for Computing Machinery, New York, NY, USA, 3743–3751. https://doi.org/10.1145/ 3534678.3539043
-
[60]
Zhi Tian, Chunhua Shen, Hao Chen, and Tong He. 2019. FCOS: Fully Con- volutional One-Stage Object Detection. arXiv:1904.01355 [cs.CV] https: //arxiv.org/abs/1904.01355
Pith/arXiv arXiv 2019
-
[61]
Yalin Wangt, Ihsin T Phillipst, and Robert Haralick. 2001. Automatic table ground truth generation and a background-analysis-based table structure extraction method. InProceedings of Sixth International Conference on Document Analysis and Recognition. IEEE, 528–532
2001
-
[62]
Yuxin Wu, Alexander Kirillov, Francisco Massa, Wan-Yen Lo, and Ross Girshick
-
[63]
Yiheng Xu, Minghao Li, Lei Cui, Shaohan Huang, Furu Wei, and Ming Zhou. 2019. LayoutLM: Pre-training of Text and Layout for Document Image Understanding. arXiv:1912.13318 [cs.CL]
Pith/arXiv arXiv 2019
-
[64]
Fan Yang, Lei Hu, Xinwu Liu, Shuangping Huang, and Zhenghui Gu. 2023. A large-scale dataset for end-to-end table recognition in the wild.Scientific Data 10, 1 (2023), 110
2023
-
[65]
Hao Zhang, Feng Li, Shilong Liu, Lei Zhang, Hang Su, Jun Zhu, Lionel M. Ni, and Heung-Yeung Shum. 2022. DINO: DETR with Improved DeNoising Anchor Boxes for End-to-End Object Detection. arXiv:2203.03605 [cs.CV] https://arxiv. org/abs/2203.03605
Pith/arXiv arXiv 2022
-
[66]
Yian Zhao, Wenyu Lv, Shangliang Xu, Jinman Wei, Guanzhong Wang, Qingqing Dang, Yi Liu, and Jie Chen. 2024. DETRs Beat YOLOs on Real-time Object Detec- tion. In2024 IEEE/CVF Conference on Computer Vision and Pattern Recognition (CVPR). 16965–16974. https://doi.org/10.1109/CVPR52733.2024.01605
arXiv 2024
-
[67]
Xu Zhong, Elaheh ShafieiBavani, and Antonio Jimeno Yepes. 2020. Image- based table recognition: data, model, and evaluation. arXiv:1911.10683 [cs.CV] https://arxiv.org/abs/1911.10683
Pith/arXiv arXiv 2020
-
[68]
Brandon Smock, Rohith Pesala, and Robin Abraham. 2023. GriTS: Grid table similarity metric for table structure recognition. arXiv:2203.12555 [cs.LG] https://arxiv.org/abs/2203.12555
Pith/arXiv arXiv 2023
-
[69]
Xingyi Zhou, Dequan Wang, and Philipp Krähenbühl. 2019. Objects as Points. arXiv:1904.07850 [cs.CV] https://arxiv.org/abs/1904.07850
Pith/arXiv arXiv 2019
-
[70]
Xizhou Zhu, Weijie Su, Lewei Lu, Bin Li, Xiaogang Wang, and Jifeng Dai. 2021. Deformable DETR: Deformable Transformers for End-to-End Object Detection. arXiv:2010.04159 [cs.CV] https://arxiv.org/abs/2010.04159 Marijan Soric, Cécile Gracianne, Ioana Manolescu, and Pierre Senellart A METHODS A.1 Methods pipelines We provide in this section some details abou...
Pith/arXiv arXiv 2021
-
[72]
https://github.com/facebookresearch/detectron2
Detectron2. https://github.com/facebookresearch/detectron2
-
[78]
Xu Zhong, Jianbin Tang, and Antonio Jimeno Yepes. 2019. PubLayNet: largest dataset ever for document layout analysis. arXiv:1908.07836 [cs.CL] https: //arxiv.org/abs/1908.07836
Pith/arXiv arXiv 2019
-
[2005]
InPattern Recognition and Data Mining, Sameer Singh, Maneesha Singh, Chid Apte, and Petra Perner (Eds.)
Automatic Table Detection in Document Images. InPattern Recognition and Data Mining, Sameer Singh, Maneesha Singh, Chid Apte, and Petra Perner (Eds.). Springer Berlin Heidelberg, Berlin, Heidelberg, 609–618
-
[2007]
Generalized LCS.Theoretical Computer Science409, 50–61. https://doi. org/10.1007/978-3-540-75530-2_5
-
[2010]
https://doi.org/10.1109/TPAMI.2009.167
Object Detection with Discriminatively Trained Part-Based Models.IEEE Transactions on Pattern Analysis and Machine Intelligence32, 9 (2010), 1627–1645. https://doi.org/10.1109/TPAMI.2009.167
-
[2017]
In2017 14th IAPR International Conference on Document Analysis and Recognition (ICDAR), Vol
DeepDeSRT: Deep Learning for Detection and Structure Recognition of Tables in Document Images. In2017 14th IAPR International Conference on Document Analysis and Recognition (ICDAR), Vol. 01. 1162–1167. https://doi.org/ 10.1109/ICDAR.2017.192
-
[2019]
TableBank: A Benchmark Dataset for Table Detection and Recognition. arXiv:1903.01949 [cs.CV]
Pith/arXiv arXiv 1903
-
[2020]
In2020 IEEE/CVF Conference on Computer Vision and Pattern Recognition Workshops (CVPRW)
Multivariate Confidence Calibration for Object Detection. In2020 IEEE/CVF Conference on Computer Vision and Pattern Recognition Workshops (CVPRW). IEEE. https://doi.org/10.1109/cvprw50498.2020.00171
arXiv 2020
-
[2022]
arXiv:2203.02378 [cs.CV] https://arxiv.org/abs/2203.02378
DiT: Self-supervised Pre-training for Document Image Transformer. arXiv:2203.02378 [cs.CV] https://arxiv.org/abs/2203.02378
-
[2830]
https://scikit-learn.org/1.5/modules/generated/sklearn.metrics.average_ precision_score.html
discussion (0)
Sign in with ORCID, Apple, or X to comment. Anyone can read and Pith papers without signing in.