REVIEW 3 major objections 5 minor 1 cited by
Searching for HI around MHONGOOSE Galaxies via Spectral Stacking
T0 review · 3 major / 5 minor · reviewed 2026-08-12 · deepseek-v4-flash
Pith's one-line read Stacked radio spectra of six galaxies show almost no neutral hydrogen outside their HI disks down to a column density of 10^17 cm^-2.
desk verdict Careful stacking study with a useful public method and an honest limitations section, but the headline null result is conditional on a kinematic prior validated on only two mocks. read the letter →
The pith
A machine-rendered reading of the paper's core claim, the machinery that carries it, and where it could break.
The reading
What carries the argument
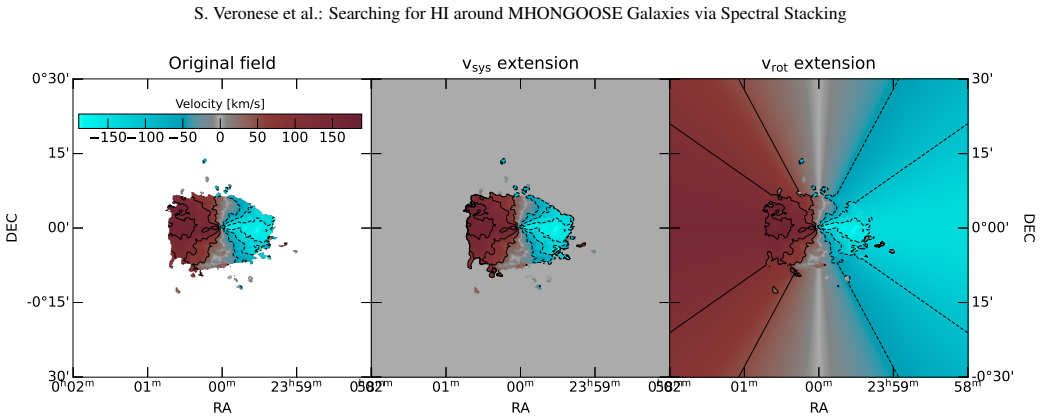
The load-bearing mechanism is the coupling of a spectral stacker (STACKER) with a one-dimensional line finder (FINDER). STACKER blanks the galaxy and known sources using a detection mask, shifts each line of sight to a reference velocity ('shuffle'), regrids to beam-sized pixels so that Gaussian noise decreases as $\sqrt{N}$ with the number of co-added spectra, and then co-adds spectra inside square cells of $5\times5$, $9\times9$, and $14\times14$ beams. FINDER applies a smooth-and-clip search on the stacked spectra and assigns each candidate a reliability based on the local density of positive versus negative noise peaks in the (peak, sum, mean) flux space, rejecting candidates whose stacked noise fails Gaussianity checks. The crucial kinematic choice is aligning every spectrum to the systemic velocity of the galaxy, which the authors test on two TNG50 mock galaxies and explicitly caution cannot be generalised to arbitrary geometries.
What would settle it
Re-analyse the same full-depth cubes after aligning spectra along the major axis with a flat-rotation-curve velocity field (or a best-fit tilted-ring model) instead of the systemic velocity; if reliable $\sim10^{17}$ cm$^{-2}$ detections appear that disappear under systemic-velocity stacking, the central non-detection is an artefact of the alignment assumption. Alternatively, a deep single-dish radial profile of one MHONGOOSE galaxy reaching below $10^{17}$ cm$^{-2}$ that shows an extended neutral envelope would falsify the claim that the neutral CGM/IGM is essentially absent.
Extended reading notes
Core claim
On its own terms, the paper's central claim is that unconstrained spectral stacking of the MHONGOOSE data yields essentially no reliable HI emission beyond the detected disks: 13 reliable sources in the full-depth cubes, only four of which have a clear visual counterpart in the data, at integrated fluxes well below what the mock observations would produce. When tested on two TNG50 mock galaxies, the same pipeline recovers only about 35% of the mock HI above $3.6\times10^{17}$ cm$^{-2}$ because the imposed signal-to-noise cut rejects faint stacked lines, so the procedure is not sensitive to everything the simulations put there; yet the mock data still return many more detections than the real data. The authors conclude that the amount of neutral hydrogen outside the HI disk is much smaller than simulations imply, and that the stacked column-density limit of about $\sim10^{17}$ cm$^{-2}$ makes direct emission detection of the neutral CGM/IGM challenging even with future radio telescopes.
Load-bearing premise
The stacking assumes that gas outside the HI disk moves at the galaxy's systemic velocity, so all spectra can be aligned without knowing the true kinematics; if the gas instead co-rotates with the disk or has complex motions, a real signal would be blurred out and the non-detection would not prove the gas is missing.
Editorial extensions
If this is right
- The neutral atomic hydrogen in the circum-galactic and inter-galactic medium of the six galaxies is below $\sim10^{17}$ cm$^{-2}$, so cool accreting gas is not directly visible as 21-cm emission with current stacking techniques.
- The HI radial profiles of these galaxies must drop sharply near the disk edge rather than extend as a diffuse neutral envelope, consistent with gas becoming ionised at the measured threshold.
- Future searches for cool gas accretion will need either absorption-line probes along background quasars or much deeper emission observations than current surveys can provide.
- The stacking-plus-reliability pipeline itself is transferable to the full MHONGOOSE sample and to other nearby-galaxy data sets once full-depth cubes are available.
Reading between the lines
- I infer that the systemic-velocity alignment likely sets a floor on what stacking can recover: if the circum-galactic gas co-rotates with the disk, a real signal would be smeared out and the $\sim10^{17}$ cm$^{-2}$ limit would be an artefact of the kinematic assumption rather than evidence of absence.
- A direct test of that assumption would be to redo the stacking on the same cubes with spectra aligned along the major axis using a flat rotation curve; if reliable detections appear that vanish under systemic-velocity stacking, the paper's non-detection is not the final word.
- The result, if general, pushes searches for cold accreting gas toward ionised-gas tracers and quasar absorption spectroscopy, since neutral-emission stacking appears to have reached a wall near $10^{17}$ cm$^{-2}$ even when thousands of spectra are co-added.
Editorial analysis
A structured set of objections, weighed in public.
Referee Report
Summary. This paper presents a spectral-stacking pipeline (STACKER and FINDER) for searching for low-column-density HI emission in the CGM/IGM around MHONGOOSE galaxies. The method is calibrated on two TNG50 mock galaxies, testing different stacking cell sizes, weighting schemes, and line-finder parameters, and comparing two kinematic priors for aligning spectra (systemic velocity vs. co-rotation with the disk). The authors conclude that the systemic-velocity alignment is preferable for their mocks and apply the method to 18 MHONGOOSE galaxies with inclination i≤60°, using single-track cubes for all of them and full-depth cubes for six after quality selection. They report very few reliable detections outside the SoFiA-2 masks, a stacked column-density sensitivity of ~10^17 cm^-2, and conclude that the amount of HI outside the disks is much smaller than predicted by simulations and that direct detection of the neutral CGM/IGM component will be challenging in the future.
Significance. Should the null result hold, it would provide a valuable observational constraint on the cold neutral gas content of the CGM/IGM of nearby galaxies, in a regime where simulations currently predict detectable HI. The paper is methodologically careful in several respects: the noise is checked for Gaussianity, the reliability of detections is assessed through positive-negative source statistics, the method is tested on mock observations, the code is publicly available, and each detection is visually inspected by three independent authors. However, the central inference is conditional on the adopted kinematic prior and on the recovery fraction of the stacking procedure, and the comparison to simulations is only qualitative. These caveats do not invalidate the method paper, but they require that the strongest claims in the abstract and conclusions be appropriately qualified.
major comments (3)
- [Sect. 4.2 and abstract] The central null result is conditional on the assumption that all gas outside the SoFiA-2 mask moves at the systemic velocity of the galaxy. The validation of this assumption is limited to two TNG50 mock galaxies, and the authors themselves caution that 'one should be careful not to generalise this result' (Sect. 4.2). For real galaxies with inclination up to 60°, plausible co-rotation of CGM gas with the disk would spread line emission over tens of km/s, lowering the stacked SNR below the FINDER threshold and making the stacked spectra appear empty. The abstract's claim that 'the amount of signal detected outside the HI disk is much smaller than implied by simulations' is therefore not established for the general MHONGOOSE population unless this kinematic dependency is explicitly acknowledged.
- [Sect. 4.3] The calibration in Sect. 4.3 shows that only ~35% of simulated emission above 3.6×10^17 cm^-2 is recovered, even under the adopted systemic-velocity prior. Consequently, the quoted ~10^17 cm^-2 stacked limit is a noise-equivalent sensitivity of the stacked spectra, not a demonstrated upper bound on the column density of any gas that may be present in compact or kinematically offset clouds. The abstract and conclusions should clearly distinguish between the sensitivity achieved and the physical limit that can be placed on CGM/IGM HI, otherwise the non-detection is easily overinterpreted.
- [Sect. 5.5 and Sect. 4] The statement that the observed signal is 'much smaller than implied by simulations' is not supported by a quantitative comparison. The paper uses two TNG50 galaxies to calibrate the method, but it does not compute an expected detection rate or a predicted stacked SNR for the MHONGOOSE sample from the simulations. The conclusion is therefore a qualitative impression based on two mock galaxies. A quantitative comparison, for example by applying the same stacking procedure to a statistical sample of mock galaxies with the same selection criteria, would be needed to support the claim in the abstract.
minor comments (5)
- [Abstract and Sect. 5] The abstract states that full-depth observations are available for '6 nearby star forming galaxies', while Sect. 5 states that full-depth cubes are available for ten galaxies, with six used after quality selection (Table A.1). Please make the wording consistent and explain the selection explicitly.
- [Sect. 5.2] The Gaussian tail probabilities appear to be off by a factor of 100: for a Gaussian distribution, P(|F| > 4σ) ≈ 0.0063%, not 0.000063%. The derived excess of ~8.8% is unaffected by this error, but the reported percentages (0.000063% and 0.000069%) should be corrected.
- [Throughout (Fig. 7, Fig. B.1, Table 1)] The TNG50 galaxy ID is given as 520885 in Table 1 and in most figure captions, but as 520855 in Fig. 7, Fig. B.1, and the accompanying text. Please unify the notation.
- [Sect. 3.2, Eq. (2)] Equation (2) presents a one-dimensional kernel density estimate, while the source parameters are three-dimensional (Fmax, Fsum, Fmean). Please clarify that the KDE is actually applied in the three-dimensional space, or provide the correct multivariate expression.
- [Fig. 3 caption] The caption does not explain what the grey-scale background and the black contours represent. Please specify that the background is the masked/regridded cube collapsed along the spectral axis and that the black contours enclose the SoFiA-2 mask.
Circularity Check
No circularity: the stacked null result is an observed measurement compared against external TNG50 predictions; no parameter fitted to the MHONGOOSE data is renamed as a prediction.
full rationale
The derivation chain is self-contained. The MHONGOOSE stacked spectra are actual observational data; the null result is not produced by fitting a parameter to those data. FINDER and STACKER parameters were calibrated on two TNG50 mock cubes, which are external simulation products (Ramesh et al. 2023; Marasco et al. in prep.) and not derived from the target MHONGOOSE galaxies. The kinematic prior (systemic velocity) is an explicit assumption tested on the mocks, with the paper itself cautioning that the result cannot be generalized (Sect. 4.2); this is a limitation on the inference, not a circular reduction of the conclusion to its inputs. The quoted column-density limit is a noise-equivalent sensitivity computed from the stacked noise and cell size, not a fitted quantity. The comparison to simulations is an external benchmark, and agreement with previous independent studies (Das et al. 2024; Xu et al. 2022; Liu et al. 2023) provides outside support. No equation or parameter in the paper reduces the headline claim to a prior definition or a fitted constant.
Assumptions & free parameters
free parameters (3)
- Minimum source SNR =
5
- Stacking cell sizes =
5x5, 9x9, 14x14 beams
- Line finder thresholds =
flux threshold 2.5 sigma; smoothing kernels [1,5,9] or [1,7,12]; min linewidth 5 to 7 channels; reliability 0.85
assumptions (4)
- domain assumption TNG50 mock cubes (Ramesh et al. 2023; Marasco et al. in prep.) are representative of real CGM and IGM HI distributions and kinematics for calibrating the stacking method
- domain assumption CGM and IGM gas in the MHONGOOSE sample moves at the systemic velocity of the host galaxy
- domain assumption The MHONGOOSE noise is Gaussian for the purpose of reliability statistics
- domain assumption The SoFiA-2 masks successfully remove all emission from the target galaxies and known companions
Cite this review
Pith. "Pith review of Searching for HI around MHONGOOSE Galaxies via Spectral Stacking." pith.science (2026). https://pith.science/paper/ISP2AP6O
@misc{pith2026241111584,
  author       = {Pith},
  title        = {Pith review of: Searching for HI around MHONGOOSE Galaxies via Spectral Stacking},
  year         = {2026},
  howpublished = {\url{https://pith.science/paper/ISP2AP6O}},
  note         = {Machine review of arXiv:2411.11584}
}
abstract
The observed star formation rates of galaxies in the Local Universe suggests that they are replenishing their gas reservoir across cosmic time. Cosmological simulations predict that this accretion of fresh gas can occur in a hot or a cold mode, yet the existence of low column density ($\sim10^{17}$ cm$^{-2}$) neutral atomic hydrogen (HI) tracing the cold mode has not been unambiguously confirmed by observations. We present the application of unconstrained spectral stacking to attempt to detect the emission from this HI in the Circum-Galactic Medium (CGM) and Inter-Galactic Medium (IGM) of 6 nearby star forming galaxies from the MHONGOOSE sample for which full-depth observations are available. Our stacking procedure consists of a standard spectral stacking algorithm coupled with a one-dimensional spectral line finder designed to extract reliable signal close to the noise level. In agreement with previous studies, we found that the amount of signal detected outside the HI disk is much smaller than implied by simulations. Furthermore, the column density limit that we achieve via stacking ($\sim10^{17}$ cm$^{-2}$) suggests that direct detection of the neutral CGM/IGM component might be challenging in the future, even with the next generation of radio telescopes.
Figures


Figures from the paper (8 more)



Forward citations
Cited by 1 Pith paper
-
A search for HI absorption in distant star-forming galaxies with ASKAP-FLASH - II. Direct observations and stacking of 21 cm line
One new associated HI 21 cm absorber is found at z=0.863; ordered stacking of associated non-detections yields only bootstrap-unsupported tentative features that vanish as fainter sources raise optical-depth noise, wh...
Reference graph
Works this paper leans on
-
[1]
2021, MNRAS, 501, 5575
Afruni, A., Fraternali, F., & Pezzulli, G. 2021, MNRAS, 501, 5575
2021
-
[2]
Afruni, A., Pezzulli, G., Fraternali, F., & Grønnow, A. 2023, MNRAS, 524, 2351
work page 2023
-
[3]
2023, ApJ, 947, 16 Astropy Collaboration, Price-Whelan, A
Amiri, M., Bandura, K., Chen, T., et al. 2023, ApJ, 947, 16 Astropy Collaboration, Price-Whelan, A. M., Lim, P. L., et al. 2022, apj, 935, 167 Astropy Collaboration, Price-Whelan, A. M., Sip˝ocz, B. M., et al. 2018, AJ, 156, 123 Astropy Collaboration, Robitaille, T. P., Tollerud, E. J., et al. 2013, A&A, 558, A33
work page 2023
-
[4]
G., Staveley-Smith, L., de Blok, W
Barnes, D. G., Staveley-Smith, L., de Blok, W. J. G., et al. 2001, MNRAS, 322, 486
2001
-
[5]
L., Larson, D., Weiland, J
Bennett, C. L., Larson, D., Weiland, J. L., & Hinshaw, G. 2014, ApJ, 794, 135
2014
-
[6]
Bera, A., Kanekar, N., Chengalur, J. N., & Bagla, J. S. 2023, ApJ, 950, L18
work page 2023
- [7]
-
[8]
2009, arXiv e-prints, arXiv:0912.1303
Cappellari, M. 2009, arXiv e-prints, arXiv:0912.1303
arXiv 2009
Show all 78 references
-
[9]
& Copin, Y
Cappellari, M. & Copin, Y . 2003, MNRAS, 342, 345
2003
-
[10]
2021, MNRAS, 508, 2758
Chen, Q., Meyer, M., Popping, A., et al. 2021, MNRAS, 508, 2758
2021
-
[11]
Chowdhury, A., Kanekar, N., & Chengalur, J. N. 2022, ApJ, 937, 103
2022
-
[12]
2015, MNRAS, 449, 2087
Danovich, M., Dekel, A., Hahn, O., Ceverino, D., & Primack, J. 2015, MNRAS, 449, 2087
2015
-
[13]
2024, MNRAS, 527, 10358
Das, S., Rickel, M., Leroy, A., et al. 2024, MNRAS, 527, 10358
2024
-
[14]
K., et al
Das, S., Sardone, A., Leroy, A. K., et al. 2020, ApJ, 898, 15 Davé, R., Rafieferantsoa, M. H., Thompson, R. J., & Hopkins, P. F. 2017, MN- RAS, 467, 115 de Blok, W. J. G., Athanassoula, E., Bosma, A., et al. 2020, A&A, 643, A147 de Blok, W. J. G., Healy, J., Maccagni, F. M., e...
2020
-
[15]
& Birnboim, Y
Dekel, A. & Birnboim, Y . 2006, MNRAS, 368, 2
2006
-
[16]
2009, Nature, 457, 451
Dekel, A., Birnboim, Y ., Engel, G., et al. 2009, Nature, 457, 451
2009
-
[17]
J., Staveley-Smith, L., & Boyle, B
Delhaize, J., Meyer, M. J., Staveley-Smith, L., & Boyle, B. J. 2013, MNRAS, 433, 1398
2013
-
[18]
2009, MNRAS, 399, 497
Dolag, K., Borgani, S., Murante, G., & Springel, V . 2009, MNRAS, 399, 497
2009
-
[19]
Dove, J. B. & Shull, J. M. 1994, ApJ, 423, 196
1994
-
[20]
English, J., Richardson, M. L. A., Ferrand, G., & Deg, N. 2024, CosmosCanvas: Useful color maps for different astrophysical properties, Astrophysics Source Code Library, record ascl:2401.005
2024
-
[21]
2011, MNRAS, 411, 993 Faucher-Giguère, C.-A
Fabello, S., Catinella, B., Giovanelli, R., et al. 2011, MNRAS, 411, 993 Faucher-Giguère, C.-A. & Oh, S. P. 2023, ARA&A, 61, 131
2011
-
[22]
2001, ApJ, 562, L47 Geréb, K., Maccagni, F
Fraternali, F., Oosterloo, T., Sancisi, R., & van Moorsel, G. 2001, ApJ, 562, L47 Geréb, K., Maccagni, F. M., Morganti, R., & Oosterloo, T. A. 2015a, A&A, 575, A44 Geréb, K., Morganti, R., & Oosterloo, T. A. 2014, A&A, 569, A35 Geréb, K., Morganti, R., Oosterloo, T. A., Hoppma...
2001
-
[23]
P., Kent, B
Giovanelli, R., Haynes, M. P., Kent, B. R., et al. 2007, AJ, 133, 2569
2007
-
[24]
2001, Kernel Methods (New York, NY: Springer New York), 165–192
Hastie, T., Friedman, J., & Tibshirani, R. 2001, Kernel Methods (New York, NY: Springer New York), 165–192
2001
-
[25]
2011, A&A, 526, A118
Heald, G., Józsa, G., Serra, P., et al. 2011, A&A, 526, A118
2011
-
[26]
L., Elson, E., et al
Healy, J., Blyth, S. L., Elson, E., et al. 2019, MNRAS, 487, 4901
2019
-
[27]
L., Verheijen, M
Healy, J., Blyth, S. L., Verheijen, M. A. W., et al. 2021, A&A, 650, A76
2021
-
[28]
F., Wetzel, A., Kereš, D., et al
Hopkins, P. F., Wetzel, A., Kereš, D., et al. 2018, MNRAS, 480, 800
2018
-
[29]
Ianjamasimanana, R., Walter, F., de Blok, W. J. G., Heald, G. H., & Brinks, E. 2018, AJ, 155, 233
2018
-
[30]
& MeerKAT Team
Jonas, J. & MeerKAT Team. 2016, in MeerKAT Science: On the Pathway to the SKA, 1 Józsa, G. I. G., White, S. V ., Thorat, K., et al. 2020, CARACal: Containerized Automated Radio Astronomy Calibration pipeline, Astrophysics Source Code Library, record ascl:2006.014
2016
-
[31]
H., et al
Kamphuis, P., Jütte, E., Heald, G. H., et al. 2022, A&A, 668, A182
2022
-
[32]
Kanekar, N., Sethi, S., & Dwarakanath, K. S. 2016, ApJ, 818, L28
2016
-
[33]
Kerp, J., Kalberla, P. M. W., Ben Bekhti, N., et al. 2016, A&A, 589, A120
2016
-
[34]
K., Di Matteo, T., et al
Khandai, N., Sethi, S. K., Di Matteo, T., et al. 2011, MNRAS, 415, 2580
2011
-
[35]
C., & Wakker, B
Lehner, N., Howk, J. C., & Wakker, B. P. 2015, ApJ, 804, 79
2015
-
[36]
Li, A., Marasco, A., Fraternali, F., Trager, S., & Verheijen, M. A. W. 2021, MN- RAS, 504, 3013
2021
-
[37]
2023, MNRAS, 523, 3905
Liu, Y ., Zhu, M., Yu, H., et al. 2023, MNRAS, 523, 3905
2023
-
[38]
S., et al
Lochhaas, C., Tumlinson, J., Peeples, M. S., et al. 2023, ApJ, 948, 43
2023
-
[39]
M., Morganti, R., Oosterloo, T
Maccagni, F. M., Morganti, R., Oosterloo, T. A., Geréb, K., & Maddox, N. 2017, A&A, 604, A43
2017
-
[40]
& Dickinson, M
Madau, P. & Dickinson, M. 2014, Annual Review of Astronomy and Astro- physics, 52, 415
2014
-
[41]
M., Blyth, S
Maddox, N., Hess, K. M., Blyth, S. L., & Jarvis, M. J. 2013, MNRAS, 433, 2613
2013
-
[42]
1993, ApJ, 414, 41
Maloney, P. 1993, ApJ, 414, 41
1993
-
[43]
Marasco, A., Fraternali, F., Lehner, N., & Howk, J. C. 2022, MNRAS, 515, 4176
2022
-
[44]
2019, Computational Astrophysics and Cosmology, 6, 2
Nelson, D., Springel, V ., Pillepich, A., et al. 2019, Computational Astrophysics and Cosmology, 6, 2
2019
-
[45]
S., Bigiel, F., et al
Neumann, L., den Brok, J. S., Bigiel, F., et al. 2023, A&A, 675, A104
2023
-
[46]
R., McKinley, B., Hurley-Walker, N., et al
Offringa, A. R., McKinley, B., Hurley-Walker, N., et al. 2014, MNRAS, 444, 606
2014
-
[47]
Offringa, A. R. & Smirnov, O. 2017, MNRAS, 471, 301
2017
-
[48]
2018, MNRAS, 473, 4077
Pillepich, A., Springel, V ., Nelson, D., et al. 2018, MNRAS, 473, 4077
2018
-
[49]
Popping, A., Davé, R., Braun, R., & Oppenheimer, B. D. 2009, A&A, 504, 15
2009
-
[50]
E., Orr, M
Porter, L. E., Orr, M. E., Burkhart, B., et al. 2022, MNRAS, 515, 3555
2022
-
[51]
E., Peek, J
Putman, M. E., Peek, J. E. G., & Joung, M. R. 2012, ARA&A, 50, 491
2012
-
[52]
& Nelson, D
Ramesh, R. & Nelson, D. 2024, MNRAS, 528, 3320
2024
-
[53]
2023, MNRAS, 518, 5754
Ramesh, R., Nelson, D., & Pillepich, A. 2023, MNRAS, 518, 5754
2023
-
[54]
Rubin, K. H. R., Hennawi, J. F., Prochaska, J. X., et al. 2015, ApJ, 808, 38
2015
-
[55]
2008, A&A Rev., 15, 189
Sancisi, R., Fraternali, F., Oosterloo, T., & van der Hulst, T. 2008, A&A Rev., 15, 189
2008
-
[56]
J., Pingel, N
Sardone, A., Pisano, D. J., Pingel, N. M., et al. 2021, ApJ, 910, 69
2021
-
[57]
A., Bower, R
Schaye, J., Crain, R. A., Bower, R. G., et al. 2015, MNRAS, 446, 521
2015
-
[58]
2015, MNRAS, 448, 1922
Serra, P., Westmeier, T., Giese, N., et al. 2015, MNRAS, 448, 1922
2015
-
[59]
Somerville, R. S. & Davé, R. 2015, ARA&A, 53, 51
2015
-
[60]
2010, MNRAS, 401, 791
Springel, V . 2010, MNRAS, 401, 791
2010
-
[61]
Stephens, M. A. 1974, Journal of the American Statistical Association, 69, 730
1974
-
[62]
Stephens, M. A. 1976, The Annals of Statistics, 4, 357
1976
-
[63]
Stephens, M. A. 1977, Biometrika, 64, 583
1977
-
[64]
Stephens, M. A. 1979, Biometrika, 66, 591
1979
-
[65]
K., Wilde, M
Tchernyshyov, K., Werk, J. K., Wilde, M. C., et al. 2023, ApJ, 949, 41
2023
-
[66]
A., Braun, R., Walterbos, R
Thilker, D. A., Braun, R., Walterbos, R. A. M., et al. 2004, ApJ, 601, L39
2004
-
[67]
S., & Werk, J
Tumlinson, J., Peeples, M. S., & Werk, J. K. 2017, ARA&A, 55, 389
2017
-
[68]
K., et al
Tumlinson, J., Thom, C., Werk, J. K., et al. 2013, ApJ, 777, 59
2013
-
[69]
L., Schaye, J., Steidel, C
Turner, M. L., Schaye, J., Steidel, C. C., Rudie, G. C., & Strom, A. L. 2014, MNRAS, 445, 794 van de V oort, F., Springel, V ., Mandelker, N., van den Bosch, F. C., & Pakmor, R. 2019, MNRAS, 482, L85 van der Hulst, J. M., Terlouw, J. P., Begeman, K. G., Zwitser, W., & Roelf- s...
2014
-
[70]
Veronese, S., de Blok, W. J. G., & Walter, F. 2023, A&A, 672, A55 V ogelaar, M. G. R. & Terlouw, J. P. 2001, in Astronomical Society of the Pa- cific Conference Series, V ol. 238, Astronomical Data Analysis Software and Systems X, ed. J. Harnden, F. R., F. A. Primini, & H. E. ...
2023
-
[71]
Walter, F., Brinks, E., de Blok, W. J. G., et al. 2008, AJ, 136, 2563
2008
-
[72]
2017, MNRAS, 465, 3291
Weinberger, R., Springel, V ., Hernquist, L., et al. 2017, MNRAS, 465, 3291
2017
-
[73]
K., Prochaska, J
Werk, J. K., Prochaska, J. X., Tumlinson, J., et al. 2014, ApJ, 792, 8
2014
-
[74]
Westmeier, T., Braun, R., Brüns, C., Kerp, J., & Thilker, D. A. 2007, New A Rev., 51, 108
2007
-
[75]
2021, MNRAS, 506, 3962
Westmeier, T., Kitaeff, S., Pallot, D., et al. 2021, MNRAS, 506, 3962
2021
-
[76]
A., Lockman, F
Wolfe, S. A., Lockman, F. J., & Pisano, D. J. 2016, ApJ, 816, 81
2016
-
[77]
A., Pisano, D
Wolfe, S. A., Pisano, D. J., Lockman, F. J., McGaugh, S. S., & Shaya, E. J. 2013, Nature, 497, 224
2013
-
[78]
K., Cheng, C., Appleton, P
Xu, C. K., Cheng, C., Appleton, P. N., et al. 2022, Nature, 610, 461 Article number, page 13 of 17 A&A proofs: manuscript no. mainv1 Appendix A: Stacking detections Table A.1. The used MHONGOOSE data cubes and the detections found in the stacked spectra. Galaxy Single-track De...
2022
Reviewed August 12, 2026 · model on record in the stance chip above.
Discussion (0). Continue with ORCID to comment.