REVIEW 3 major objections 5 minor 89 references
Probing planet formation and disk substructures in the inner disk of Herbig Ae stars with CO rovibrational emission
T0 review · 3 major / 5 minor · reviewed 2026-08-14 · deepseek-v4-flash
Pith's one-line read Two inner-disk configurations explain the CO vibrational dichotomy in Herbig Ae disks.
desk verdict A plausible two-family explanation for the CO v2/v1–radius trend, but the low-ratio branch rests on an inner-rim dissociation that the model itself does not predict. read the letter →
The pith
A machine-rendered reading of the paper's core claim, the machinery that carries it, and where it could break.
The reading
What carries the argument
The load-bearing machinery is a two-step modeling chain. First, analytic slab models and non-LTE radiative-transfer slab models map the vibrational ratio $v_2/v_1$ (the flux ratio between CO lines from the second and first vibrationally excited states) as a function of temperature, CO column, density, and infrared radiation field; this isolates the allowed parameter regions. Second, a grid of thermo-chemical disk models with varying inner radius (0.4–15 AU) and gas-to-dust ratio (10–10000) produces synthetic CO line profiles, fluxes, and ratios that are analysed exactly as the observations, including removal of the inner-rim contribution to isolate disk-surface emission. The central identity used throughout is the peak line-surface-brightness relation for a slab, which shows how optical depth in the $v_1$ line pushes the $v_2/v_1$ ratio up with column, and the requirement that gas and dust temperatures remain coupled in the emitting layer.
What would settle it
Search for CO rovibrational emission from the inner dust rim of a low-$v_2/v_1$ Herbig disk using high-angular-resolution 4.7 micron interferometry or spatially resolved spectroscopy: a detection of rim CO above the model's upper limits would break the thermal-dissociation premise.
Extended reading notes
Core claim
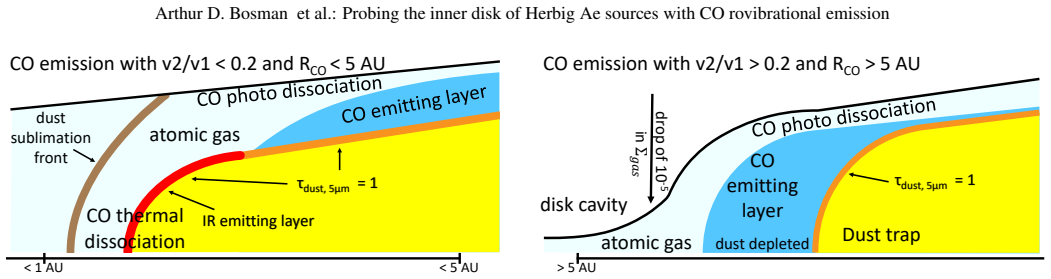
The central discovery claim is that the observed anti-correlation between the CO vibrational ratio $v_2/v_1$ and the emitting radius is not a smooth radial excitation gradient but a dichotomy between two inner-disk geometries. The paper argues that every low-$v_2/v_1$ source with CO inside 5 AU is best reproduced by emission from the disk surface at 400–1300 K, with moderate CO columns and gas-to-dust ratios below 1000, and that the inner dust rim contributes essentially no CO because gas at the sublimation radius is hot enough to be atomic. Every high-$v_2/v_1$ source with CO outside 5 AU requires a cavity in both gas and dust at least 5 AU wide, CO columns above $10^{18}$ cm$^{-2}$ at the cavity wall with gas-to-dust ratios above 10000, and a strong drop in gas surface density inside the cavity. In both regimes the CO excitation is nearly thermalized with the dust (roughly 20–50% temperature differences), and the high gas-to-dust ratios at cavity walls are interpreted as dust traps, consistent with planet-carved cavities.
Load-bearing premise
The argument depends on gas at the dust sublimation radius being hot enough (above roughly 3000 K) to destroy CO, and the paper itself says its model likely overestimates CO abundance there and that the temperature and chemistry are very uncertain.
Editorial extensions
If this is right
- For low-$v_2/v_1$ disks, CO rovibrational emission traces the disk surface rather than the inner rim, so the near-infrared continuum and CO lines probe different regions of the inner disk.
- For high-$v_2/v_1$ disks, the measured CO radius directly marks the inner edge of the molecular outer disk, because the cavity is almost devoid of CO and the steep line profiles come from a cavity wall.
- High gas-to-dust ratios above 10000 at cavity walls are naturally produced by dust traps, so the high-$v_2/v_1$ sources are prime candidates for giant planets carving the cavity.
- Group II disks with broad low-ratio lines must be geometrically flat or radially confined by inner substructures; smooth flared disks are ruled out for most of them.
- Observing CO rovibrational ratios can identify inner cavities and residual inner dust belts even without spatially resolving the disk, and future 3–5 micron integral-field observations should directly image the predicted rings and cavity walls.
Reading between the lines
- Extending the paper's logic, the radius at which CO rovibrational emission switches on could serve as a thermometer for the atomic-to-molecular transition in the inner disk, mapping gas temperatures at the sublimation front across a sample of sources.
- The observed dichotomy may be an evolutionary sequence: as a growing planet evacuates the inner disk, a source would move from the low-ratio surface-emission branch to the high-ratio cavity-wall branch, making narrow high-ratio lines a late-stage signature of planet carving.
- A similar modeling exercise applied to T Tauri disks could test whether the difference in UV spectral shape (continuum-dominated versus Lyman-alpha-dominated irradiation) is what prevents the same dichotomy there, since the paper argues Herbigs dissociate CO at small radii while T Tauris do not.
Signed reviews
Editorial analysis
A structured set of objections, weighed in public.
Referee Report
Summary. The paper studies CO rovibrational line emission in Herbig Ae disks, focusing on the observed dichotomy between the vibrational flux ratio v2/v1 and the inferred CO emitting radius RCO. It combines analytic LTE slab calculations, non-LTE RADEX slab models, and a grid of DALI thermo-chemical disk models with varying inner radius and gas-to-dust ratio, and compares simulated line profiles, fluxes, and radii directly to observed data. The authors conclude that broad CO lines with low v2/v1 originate from a warm (400–1300 K) inner disk surface with gas-to-dust ratio below 1000 and CO column below 1e18 cm^-2, with CO absent at the inner dust rim because of thermal dissociation; narrow lines with high v2/v1 require an inner cavity of at least 5 AU and a cool (100–300 K), high-column (N_CO > 1e18 cm^-2) molecular reservoir at a cavity wall with gas-to-dust ratio above 10000. The paper interprets these structures in terms of dust trapping and giant planets and provides simulated ELT-METIS images as observational predictions.
Significance. If the interpretation is correct, this paper would connect CO rovibrational excitation to inner-disk gas-to-dust structure, dust trapping, and cavity formation in Herbig systems, and would provide a useful observational diagnostic for disk substructures inside 10 AU. The methodological strengths are the clean analytic and RADEX slab analysis, the explicit comparison of model line profiles to the observed stacked spectra, the use of a full thermo-chemical code with an expanded CO model, and concrete predictions for ELT-METIS. However, the central physical mechanism—the absence of CO at the inner dust rim—is not self-consistently produced by the DALI models, and the quantitative gas-to-dust thresholds are effectively selected grid values rather than fitted constraints. The paper therefore currently has the status of a well-motivated but partially assumption-driven interpretation, rather than a fully established structural dichotomy.
major comments (3)
- [Sec. 4.2–4.3, Figs. 9 and 12] The low-v2/v1 branch, which is a central result of the paper, is not reproduced by the fiducial DALI models; Sec. 4.2 states that 'clearly none of these models reproduce the trends in the data.' The agreement in Fig. 12 is obtained only after manually removing the inner-rim contribution to the spectra (Sec. 4.3), which carries ≈ 40% of the v1 flux and ≈ 90% of the v2 flux. This subtraction is imposed rather than derived: Appendix F explicitly concedes that the CO abundance in the inner disk rim is probably overestimated by DALI and that the gas temperature and chemistry there are 'very uncertain,' and Fig. F.1 shows that the DALI kinetic network keeps CO abundant to higher temperatures than equilibrium chemistry. Because the absence of CO at the inner rim is the physical basis for the entire low-v2/v1 interpretation, the paper's central dichotomy currently rests on an unmodeled assumption rather than on a self-consistent model prediction.
- [Sec. 4.1 and Appendix E] The quantitative thresholds in the conclusions ('gas-to-dust ratios below 1000' and 'greater than 10000', 'cavity of at least 5 AU') are not obtained from a fit with uncertainties. The DALI grid samples gas-to-dust ratios of 10, 100, 1000, and 10000 and inner radii of 0.4–15 AU, and the models that match the data are simply those grid points that fall in the observed region. Moreover, the high-v2/v1 models in Appendix E require a specially shaped cavity wall with a Gaussian density profile inside Rin and gas-to-dust ratios of 2×10⁴–105, parameters introduced ad hoc to lower the v1 flux by about a factor of 50 and to cool the wall. The paper should present these as proof-of-concept models and refrain from claiming tight physical thresholds unless a fitting or marginalization is performed.
- [Sec. 5.1.1 and Sec. 3.1.3] The unique attribution of the low-v2/v1 inner-disk branch to thermal dissociation of CO near the sublimation radius is not established against competing mechanisms. In Sec. 3.1.3 the authors note that dust emission and absorption lower the v2 line more than the v1 line, so dust opacity can reduce v2/v1 by itself; in Sec. 5.1.1 they argue that even a small inner hole would leave atomic gas at the inner edge, but this is not modeled. The present data and models therefore cannot exclude alternatives such as a small dust-free gap, a slightly different inner-rim temperature structure, or dust opacity masking the rim. I would ask the authors to test at least one concrete alternative (e.g., rim models with dust extinction) and to strengthen the atomic-line observational test that they propose, before claiming that the dichotomy originates from CO dissociation.
minor comments (5)
- [Sec. 4.2.1] The text says that none of the fiducial models reproduce the observed trends, but later in the same section and in the caption of Fig. 9 the LTE models with small cavities are described as consistent with low v2/v1 sources; this apparent contradiction should be clarified.
- [Eq. (2)] The expression '1− exp−[ hν/kT ]' is missing a closing parenthesis or bracket; the equation is hard to read as typeset.
- [Fig. 4] The description 'area between the blue and white lines' in Sec. 3.4.1 is not self-explanatory; the figure should label the blue lines or the caption should explain how the v1-flux constraint is encoded.
- [Sec. 3.4.2] The two solution families in Fig. 6 are called 'Solution #1' and 'Solution #2' in the text but are not labeled in the figure; please add labels or a legend.
- [Sec. 4.1] The statement that noise is added to achieve a signal-to-noise ratio of about 200 lacks details (noise distribution, seed); this is not essential but would improve reproducibility.
Circularity Check
The low-v2/v1 branch's key 'no CO at the inner rim' condition is imposed by subtracting the rim component from DALI spectra and then read back as an inference; Appendix F concedes the rim CO abundance is only 'probably overestimated' by DALI.
-
fitted input called prediction
[Sections 4.2.2, 4.3, 5.1.1, and Appendix F]
"None of the observations show the broad plateau-like feature that is in our model line profiles with small Rin (< 2 AU). This indicates that the inner rim of the model disk needs to be adapted to fit the data. ... The inner rim region from which the line emission is removed originally produces ∼ 40% of the v1 flux and ∼90% of the v2 flux. ... The good match between the line profiles of disks without a contribution from the inner disk edge (Sec. 4.3) indicates that CO is not present within or around the dust sublimation radius in any of these disks."
The conclusion that CO is absent at the inner dust rim is the same operation as the model modification used to make the low-v2/v1 branch match: the inner-rim contribution is removed from the DALI spectra because the full model overproduces the broad plateau that the observations do not show, and the post-subtraction 'good match' is then cited as evidence for no CO at the rim. The match is therefore obtained by construction rather than independently predicted. The physical dissociation scenario is not produced by DALI; Appendix F states that 'the CO abundance in the inner disk rim is overestimated by DALI' is 'not unlikely', explicitly leaving the gas temperature and chemistry there uncertain. Thus the load-bearing low-ratio condition is an imposed input, not a derived output.
full rationale
The paper is largely an honest grid-fitting study: the LTE and RADEX slab models provide self-contained excitation constraints, and the DALI models are compared to the data using the same line-ratio and radius extraction methods as the observations. There is no load-bearing self-citation chain and no uniqueness theorem imported from the authors' prior work; the use of Banzatti et al. data and the DALI code is external or code-based evidence. However, the central dichotomy contains one partially circular step. The low-v2/v1 branch is rescued by manually subtracting the inner-rim line component that the fiducial DALI models produce, and the paper then presents the 'good match' of the rim-subtracted models as evidence that CO is absent inside/at the inner rim. Because the removal was motivated by the same absent plateau in the observed line profiles, the inference 'no CO at the rim' reduces to the imposed model alteration; Appendix F explicitly concedes this region is not modeled reliably. The gas-to-dust and cavity-radius thresholds are also read off from the parameter grid that was varied to match the observed v2/v1 and RCO, which is model fitting rather than independent prediction, but that alone would not be circular. The rim-subtraction step is the specific reduction that makes the low-ratio branch's physical interpretation partially circular, so the overall score is 6.
Assumptions & free parameters
free parameters (6)
- Gas-to-dust ratio =
< 1000 for low v2/v1 sources; > 10000 for high v2/v1 sources
- Inner disk radius Rin =
0.4 to 15 AU (grid), inferred cavity sizes ~5 AU for high v2/v1
- CO column density in slab models =
10^14 to 10^22 cm^-2 (grid)
- Gas temperature in slab models =
100 to 6000 K (grid)
- Emitting area in RADEX high-v2/v1 models =
free parameter, 0.01 to 100 AU^2
- Vertical scale height and flaring index =
hc = 0.1, psi = 0.25 fiducial; hc = 0.02-0.1, psi = 0.0-0.25 varied
assumptions (4)
- domain assumption CO-H2 and CO-H collisional rate coefficients from Yang et al. (2010) and Song et al. (2015) are accurate for the vibrational transitions.
- domain assumption The DALI thermo-chemical code correctly solves gas temperature, chemistry, and molecular excitation for these disks.
- domain assumption The observed v2/v1 line ratio measured from v2 P(4) and v1 P(10) is a suitable proxy for the v=2/v=1 vibrational population ratio.
- ad hoc to paper Gas near the dust sublimation radius is heated above 3000 K and becomes atomic, removing CO from the inner rim.
Cite this review
Pith. "Pith review of Probing planet formation and disk substructures in the inner disk of Herbig Ae stars with CO rovibrational emission." pith.science (2026). https://pith.science/paper/ISTTIITQ
@misc{pith2026190902031,
  author       = {Pith},
  title        = {Pith review of: Probing planet formation and disk substructures in the inner disk of Herbig Ae stars with CO rovibrational emission},
  year         = {2026},
  howpublished = {\url{https://pith.science/paper/ISTTIITQ}},
  note         = {Machine review of arXiv:1909.02031}
}
abstract
[abridged]CO rovibrational lines are efficient probes of warm molecular gas and can give unique insights into the inner 10 AU of proto-planetary disks. Recent studies have found a relation between the ratio of lines originating from the second and first vibrationally excited state, denoted as $v2/v1$, and the emitting radius of CO. In disks around Herbig Ae stars the vibrational excitation is low when CO lines come from close to the star, and high when lines only probe gas at large radii (more than 5 AU). We aim to find explanations for the observed trends between CO vibrational ratio, emitting radii, and NIR excess, and identify their implications in terms of the physical and chemical structure of inner disks around Herbig stars. Slab models and full disk thermo chemical models are calculated. Simulated observations from the models are directly compared to the data. Broad CO lines with low vibrational ratios are best explained by a warm (400-1300 K) inner disk surface with gas-to-dust ratios below 1000; no CO is detected within/at the inner dust rim, due to dissociation at high temperatures. In contrast, explaining the narrow lines with high vibrational ratios requires an inner cavity of a least 5 AU in both dust and gas, followed by a cool (100-300 K) molecular gas reservoir with gas-to-dust ratios greater than 10000 at the cavity wall. In all cases the CO gas must be close to thermalization with the dust. The high gas-to-dust ratios needed to explain high $v2/v1$ in narrow CO lines for a subset of group I disks can naturally be interpreted as due to the dust traps that have been proposed to explain millimeter dust cavities. The broad lines seen in most group II objects indicate a very flat disk in addition to inner disk substructures within 10 AU that can be related to the substructures recently observed with ALMA.
Figures


Figures from the paper (15 more)




Reference graph
Works this paper leans on
-
[1]
, " * write output.state after.block = add.period write newline
ENTRY address archiveprefix author booktitle chapter edition editor howpublished institution eprint journal key month note number organization pages publisher school series title type volume year label extra.label sort.label short.list INTEGERS output.state before.all mid.sentence after.sentence after.block FUNCTION init.state.consts #0 'before.all := #1 ...
-
[2]
write newline
" write newline "" before.all 'output.state := FUNCTION n.dashify 't := "" t empty not t #1 #1 substring "-" = t #1 #2 substring "--" = not "--" * t #2 global.max substring 't := t #1 #1 substring "-" = "-" * t #2 global.max substring 't := while if t #1 #1 substring * t #2 global.max substring 't := if while FUNCTION word.in bbl.in " " * FUNCTION format....
-
[3]
M., Huang , J., P \'e rez , L
Andrews , S. M., Huang , J., P \'e rez , L. M., et al. 2018, , 869, L41
2018
-
[4]
P., Schmid , H
Avenhaus , H., Quanz , S. P., Schmid , H. M., et al. 2017, , 154, 33
2017
-
[5]
2018, , 609, L2
Banzatti , A., Garufi , A., Kama , M., et al. 2018, , 609, L2
2018
-
[6]
& Pontoppidan , K
Banzatti , A. & Pontoppidan , K. M. 2015, , 809, 167
2015
-
[7]
M., Bruderer , S., Muzerolle , J., & Meyer , M
Banzatti , A., Pontoppidan , K. M., Bruderer , S., Muzerolle , J., & Meyer , M. R. 2015, , 798, L16
2015
-
[8]
M., Salyk , C., et al
Banzatti , A., Pontoppidan , K. M., Salyk , C., et al. 2017, , 834, 152
2017
Show all 89 references
-
[9]
J., Tennyson , J., Harris , G
Barber , R. J., Tennyson , J., Harris , G. J., & Tolchenov , R. N. 2006, , 368, 1087
2006
-
[10]
E., Brown , J
Bast , J. E., Brown , J. M., Herczeg , G. J., van Dishoeck , E. F., & Pontoppidan , K. M. 2011, , 527, A119
2011
-
[11]
W., Ajello , J
Beegle , L. W., Ajello , J. M., James , G. K., Dziczek , D., & Alvarez , M. 1999, , 347, 375
1999
-
[12]
2017, , 597, A42
Benisty , M., Stolker , T., Pohl , A., et al. 2017, , 597, A42
2017
-
[13]
Blake , G. A. & Boogert , A. C. A. 2004, , 606, L73
2004
-
[14]
2018, , 853, 162
Boehler , Y., Ricci , L., Weaver , E., et al. 2018, , 853, 162
2018
-
[15]
R., Feldt , M., Glasse , A., et al
Brandl , B. R., Feldt , M., Glasse , A., et al. 2014, in , Vol. 9147, Ground-based and Airborne Instrumentation for Astronomy V, 914721
2014
-
[16]
D., Carr , J
Brittain , S. D., Carr , J. S., & Najita , J. R. 2018, , 130, 074505
2018
-
[17]
D., Simon , T., Najita , J
Brittain , S. D., Simon , T., Najita , J. R., & Rettig , T. W. 2007, , 659, 685
2007
-
[18]
M., Herczeg , G
Brown , J. M., Herczeg , G. J., Pontoppidan , K. M., & van Dishoeck , E. F. 2012, , 744, 116
2012
-
[19]
M., Pontoppidan , K
Brown , J. M., Pontoppidan , K. M., van Dishoeck , E. F., et al. 2013, , 770, 94
2013
-
[20]
2013, , 559, A46
Bruderer , S. 2013, , 559, A46
2013
-
[21]
Bruderer , S., Harsono , D., & van Dishoeck , E. F. 2015, , 575, A94
2015
-
[22]
F., Doty , S
Bruderer , S., van Dishoeck , E. F., Doty , S. D., & Herczeg , G. J. 2012, , 541, A91
2012
-
[23]
& Sharma , A
Chandra , S. & Sharma , A. K. 2001, , 376, 356
2001
-
[24]
L., Stapelfeldt , K
Cieza , L., Padgett , D. L., Stapelfeldt , K. R., et al. 2007, , 667, 308
2007
-
[25]
& Kenyon , S
Currie , T. & Kenyon , S. J. 2009, , 138, 703
2009
-
[26]
2009, , 500, 1065
di Folco , E., Dutrey , A., Chesneau , O., et al. 2009, , 500, 1065
2009
-
[27]
& Bergin , E
Du , F. & Bergin , E. A. 2014, , 792, 2
2014
-
[28]
Dullemond , C. P. & Dominik , C. 2004, , 417, 159
2004
-
[29]
A., Hillenbrand , L
Eisner , J. A., Hillenbrand , L. A., & Stone , J. M. 2014, , 443, 1916
2014
-
[30]
& Pascucci , I
Ercolano , B. & Pascucci , I. 2017, Royal Society Open Science, 4, 170114
2017
-
[31]
& Josselin , E
Faure , A. & Josselin , E. 2008, , 492, 257
2008
-
[32]
R., et al
Fedele , D., Carney , M., Hogerheijde , M. R., et al. 2017, , 600, A72
2017
-
[33]
A., Roueff , E., & Abgrall , H
France , K., Schindhelm , E., Bergin , E. A., Roueff , E., & Abgrall , H. 2014, , 784, 127
2014
-
[34]
V., Schertl , D., et al
Garcia Lopez , R., Tambovtseva , L. V., Schertl , D., et al. 2015, , 576, A84
2015
-
[35]
2017, , 603, A21
Garufi , A., Meeus , G., Benisty , M., et al. 2017, , 603, A21
2017
-
[36]
& McBride , B
Gordon , S. & McBride , B. J. 1994, Computer Program for Calculation of Complex Chemical Equilibrium Compositions and Applications. Part 1: Analysis (Washington, DC: NASA)
1994
-
[37]
Gorti , U., Hollenbach , D., & Dullemond , C. P. 2015, , 804, 29
2015
-
[38]
2017, , 602, A94
Gravity Collaboration , Abuter , R., Accardo , M., et al. 2017, , 602, A94
2017
-
[39]
P., Kamp , I., Goto , M., et al
Hein Bertelsen , R. P., Kamp , I., Goto , M., et al. 2014, , 561, A102
2014
-
[40]
& McKee , C
Hollenbach , D. & McKee , C. F. 1979, , 41, 555
1979
-
[41]
M., Dullemond , C
Huang , J., Andrews , S. M., Dullemond , C. P., et al. 2018, , 869, L42
2018
-
[42]
Hunter, J. D. 2007, Computing in Science & Engineering, 9, 90
2007
-
[43]
D., Fairlamb , J., Oudmaijer , R
Ilee , J. D., Fairlamb , J., Oudmaijer , R. D., et al. 2014, , 445, 3723
2014
-
[44]
M., et al
Isella , A., Huang , J., Andrews , S. M., et al. 2018, , 869, L49
2018
-
[45]
2001--, SciPy : Open source scientific tools for Python , [Online; accessed 5 July 2001]
Jones, E., Oliphant, T., Peterson, P., et al. 2001--, SciPy : Open source scientific tools for Python , [Online; accessed 5 July 2001]
2001
-
[46]
2004, in , Vol
Kaeufl , H.-U., Ballester , P., Biereichel , P., et al. 2004, in , Vol. 5492, Ground-based Instrumentation for Astronomy, ed. A. F. M. Moorwood & M. Iye , 1218--1227
2004
-
[47]
P., & Pinilla , P
Kama , M., Folsom , C. P., & Pinilla , P. 2015, , 582, L10
2015
-
[48]
M., Honda , M., Waters , L
Maaskant , K. M., Honda , M., Waters , L. B. F. M., et al. 2013, , 555, A64
2013
-
[49]
McBride , B. J. & Gordon , S. 1996, Computer Program for Calculation of Complex Chemical Equilibrium Compositions and Applications II. User's Manual and Program Description, Vol. 19 (Washington, DC: NASA), 178
1996
-
[50]
S., Becklin , E
McLean , I. S., Becklin , E. E., Bendiksen , O., et al. 1998, in Society of Photo-Optical Instrumentation Engineers (SPIE) Conference Series, Vol. 3354, Infrared Astronomical Instrumentation, ed. A. M. Fowler , 566--578
1998
-
[51]
Meeus , G., Waters , L. B. F. M., Bouwman , J., et al. 2001, , 365, 476
2001
-
[52]
M., Blake , G
Meijerink , R., Pontoppidan , K. M., Blake , G. A., Poelman , D. R., & Dullemond , C. P. 2009, , 704, 1471
2009
-
[53]
2015, , 581, A107
Menu , J., van Boekel , R., Henning , T., et al. 2015, , 581, A107
2015
-
[54]
Mitchell, G. F. 1984, Astrophysical Journal Supplement Series, 54, 81
1984
-
[55]
S., & Mathieu , R
Najita , J., Carr , J. S., & Mathieu , R. D. 2003, , 589, 931
2003
-
[56]
2006--, NumPy : A guide to NumPy , USA: Trelgol Publishing, [Online; accessed 5 July 2019]
Oliphant, T. 2006--, NumPy : A guide to NumPy , USA: Trelgol Publishing, [Online; accessed 5 July 2019]
2006
-
[57]
Owen , J. E. 2016, , 33, e005
2016
-
[58]
2012, , 545, A81
Pinilla , P., Benisty , M., & Birnstiel , T. 2012, , 545, A81
2012
-
[59]
2016, , 585, A35
Pinilla , P., Klarmann , L., Birnstiel , T., et al. 2016, , 585, A35
2016
-
[60]
2018, , 859, 32
Pinilla , P., Tazzari , M., Pascucci , I., et al. 2018, , 859, 32
2018
-
[61]
M., Blake , G
Pontoppidan , K. M., Blake , G. A., & Smette , A. 2011 a , , 733, 84
2011
-
[62]
M., Boogert , A
Pontoppidan , K. M., Boogert , A. C. A., Fraser , H. J., et al. 2008, , 678, 1005
2008
-
[63]
M., Salyk , C., Blake , G
Pontoppidan , K. M., Salyk , C., Blake , G. A., et al. 2010, , 720, 887
2010
-
[64]
M., van Dishoeck , E., Blake , G
Pontoppidan , K. M., van Dishoeck , E., Blake , G. A., et al. 2011 b , The Messenger, 143, 32
2011
-
[65]
2016, in , Vol
Rayner , J., Tokunaga , A., Jaffe , D., et al. 2016, in , Vol. 9908, Ground-based and Airborne Instrumentation for Astronomy VI, 990884
2016
-
[66]
2013, Journal of Quantitative Spectroscopy and Radiative Transfer, 130, 4
Rothman, L., Gordon, I., Babikov, Y., et al. 2013, Journal of Quantitative Spectroscopy and Radiative Transfer, 130, 4
2013
-
[67]
A., Boogert , A
Salyk , C., Blake , G. A., Boogert , A. C. A., & Brown , J. M. 2011, , 743, 112
2011
-
[68]
M., Blake , G
Salyk , C., Pontoppidan , K. M., Blake , G. A., et al. 2008, , 676, L49
2008
-
[69]
A., Ratzka , T., Schuller , P
Schegerer , A. A., Ratzka , T., Schuller , P. A., et al. 2013, , 555, A103
2013
-
[70]
L., van der Tak , F
Sch\" o ier , F. L., van der Tak , F. F. S., van Dishoeck , E. F., & Black , J. H. 2005, , 432, 369
2005
-
[71]
M., et al
Song , L., Balakrishnan , N., Walker , K. M., et al. 2015, , 813, 96
2015
-
[72]
Spaans , M., Tielens , A. G. G. M., van Dishoeck , E. F., & Bakes , E. L. O. 1994, , 437, 270
1994
-
[73]
2016, , 595, A113
Stolker , T., Dominik , C., Avenhaus , H., et al. 2016, , 595, A113
2016
-
[74]
2017, , 840, 32
Tang , Y.-W., Guilloteau , S., Dutrey , A., et al. 2017, , 840, 32
2017
-
[75]
F., Williamson , R., Polyansky , O
Tennyson , J., Zobov , N. F., Williamson , R., Polyansky , O. L., & Bernath , P. F. 2001, Journal of Physical and Chemical Reference Data, 30, 735
2001
-
[76]
F., Kamp , I., Woitke , P., et al
Thi , W. F., Kamp , I., Woitke , P., et al. 2013, , 551, A49
2013
-
[77]
Thi , W.-F., van Dalen , B., Bik , A., & Waters , L. B. F. M. 2005, , 430, L61
2005
-
[78]
& Nakano , T
Umebayashi , T. & Nakano , T. 1988, Progress of Theoretical Physics Supplement, 96, 151
1988
-
[79]
F., Bruderer , S., et al
van der Marel , N., van Dishoeck , E. F., Bruderer , S., et al. 2016, , 585, A58
2016
-
[80]
F., Bruderer , S., et al
van der Marel , N., van Dishoeck , E. F., Bruderer , S., et al. 2013, Science, 340, 1199
2013
-
[81]
F., Bruderer , S., P \'e rez , L., & Isella , A
van der Marel , N., van Dishoeck , E. F., Bruderer , S., P \'e rez , L., & Isella , A. 2015, , 579, A106
2015
-
[82]
P., Ansdell , M., et al
van der Marel , N., Williams , J. P., Ansdell , M., et al. 2018, , 854, 177
2018
-
[83]
E., Waters , L
van der Plas , G., van den Ancker , M. E., Waters , L. B. F. M., & Dominik , C. 2015, , 574, A75
2015
-
[84]
M., M \'e nard , F., et al
van der Plas , G., Wright , C. M., M \'e nard , F., et al. 2017, , 597, A32
2017
-
[85]
van der Tak , F. F. S., Black , J. H., Sch \"o ier , F. L., Jansen , D. J., & van Dishoeck , E. F. 2007, , 468, 627
2007
-
[86]
M., Song , L., Yang , B
Walker , K. M., Song , L., Yang , B. H., et al. 2015, , 811, 27
2015
-
[87]
A., Boley , A
White , J. A., Boley , A. C., MacGregor , M. A., Hughes , A. M., & Wilner , D. J. 2018, , 474, 4500
2018
-
[88]
2009, , 501, 383
Woitke , P., Kamp , I., & Thi , W.-F. 2009, , 501, 383
2009
-
[89]
C., Balakrishnan , N., & Forrey , R
Yang , B., Stancil , P. C., Balakrishnan , N., & Forrey , R. C. 2010, , 718, 1062
2010
Reviewed August 14, 2026 · model on record in the stance chip above.
Discussion (0). Continue with ORCID to comment.