REVIEW 4 major objections 5 minor 25 references
Location Prior Generation via Multi-Source Urban Data Fusion for Low-Altitude Air Mobility
T0 review · 4 major / 5 minor · reviewed 2026-08-02 · deepseek-v4-flash
Pith's one-line read A three-tier fallback gives every building a height within roughly 5.5 meters.
desk verdict Worth reading: a quality-gated fusion pipeline for building heights that is honest about its limits, but the worst-case error claim needs a rewrite. read the letter →
The pith
A machine-rendered reading of the paper's core claim, the machinery that carries it, and where it could break.
The reading
What carries the argument
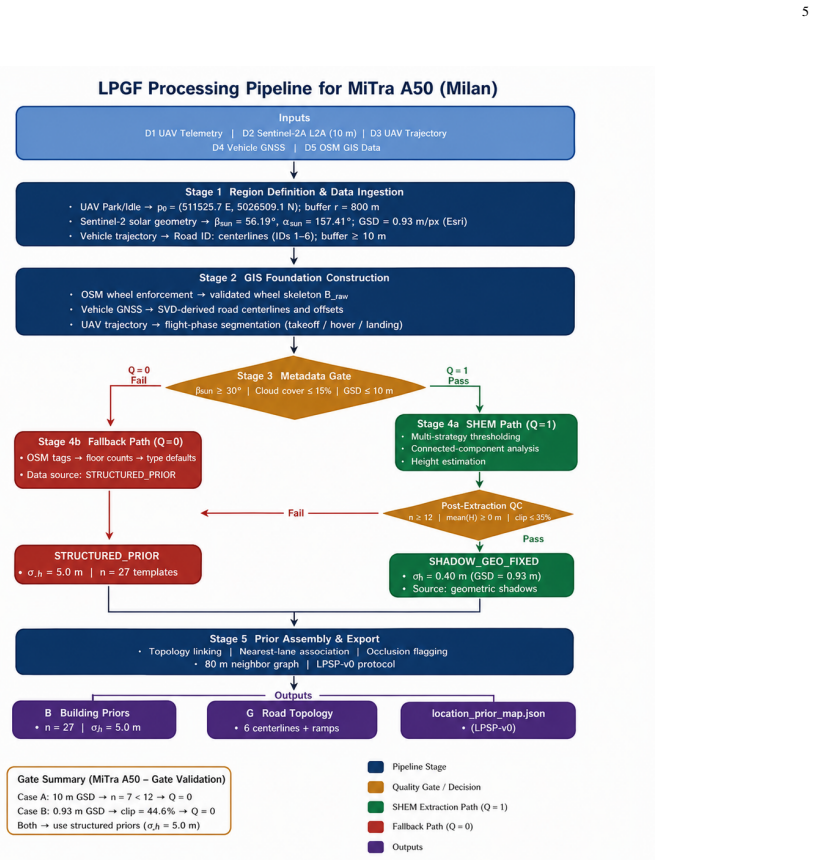
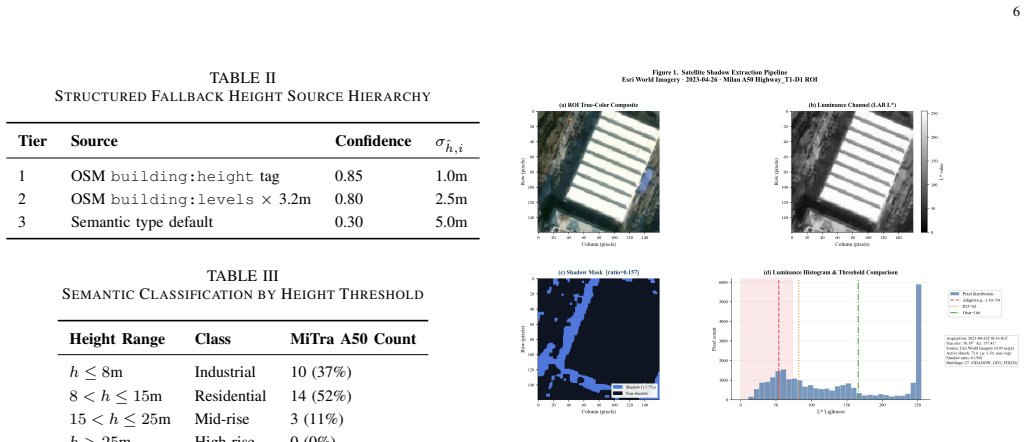
The central mechanism is the three-tier structured fallback hierarchy--explicit height tags, floor-count conversion at 3.2 m/story, and semantic type defaults--which guarantees completeness and bounded uncertainty for every building. It is governed by a boolean quality-gated selection rule: a four-criterion pre-extraction gate (solar elevation, cloud fraction, ground sample distance, shadow contrast) and a post-extraction validator (sample size, mean height, clipping ratio, variance) decide whether the optional shadow-based height estimator (SHEM) may run; otherwise the pipeline falls back to the structured hierarchy. Every output carries a confidence and an uncertainty value, serialized in
What would settle it
Measure true building heights with LiDAR or ground surveys in a different urban area with a different building mix; if the type-default Tier-3 MAE exceeds 5.0 m there, the claimed universal 5.5 m worst-case envelope fails.
Extended reading notes
Core claim
The central claim is that the three-tier structured fallback hierarchy is a sufficient height-assignment mechanism: it produces a height for every footprint, with a conservative worst-case error envelope of approximately 5.5 m, and with per-building uncertainty metadata that downstream planners can use to set safety margins. The paper also claims the quality-gated decision rule correctly identifies when shadow-based estimation would fail, and routes to fallback so that a useful prior is always produced. On a Milan motorway corridor, the gate rejected the shadow module under two distinct imaging failure modes yet the pipeline still emitted a consistent 27-building prior; Tier-3 type defaults
Load-bearing premise
The worst-case error bound assumes that the hand-set type-default heights (6.5 m, 9.0 m, 17.5 m) and the assigned per-tier uncertainties (1.0/2.5/5.0 m) actually bound the true height error for every building type and region, a premise validated only by 15 manual floor counts on the same corridor used to calibrate those defaults.
Editorial extensions
If this is right
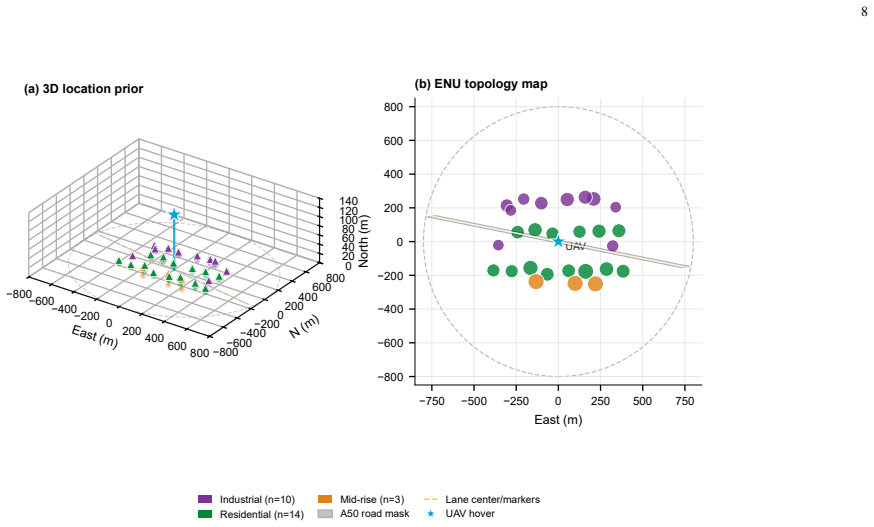
- A 3D scene prior with per-building height and uncertainty is generated for an 800-meter corridor in about 51 seconds on a consumer workstation, without any training data.
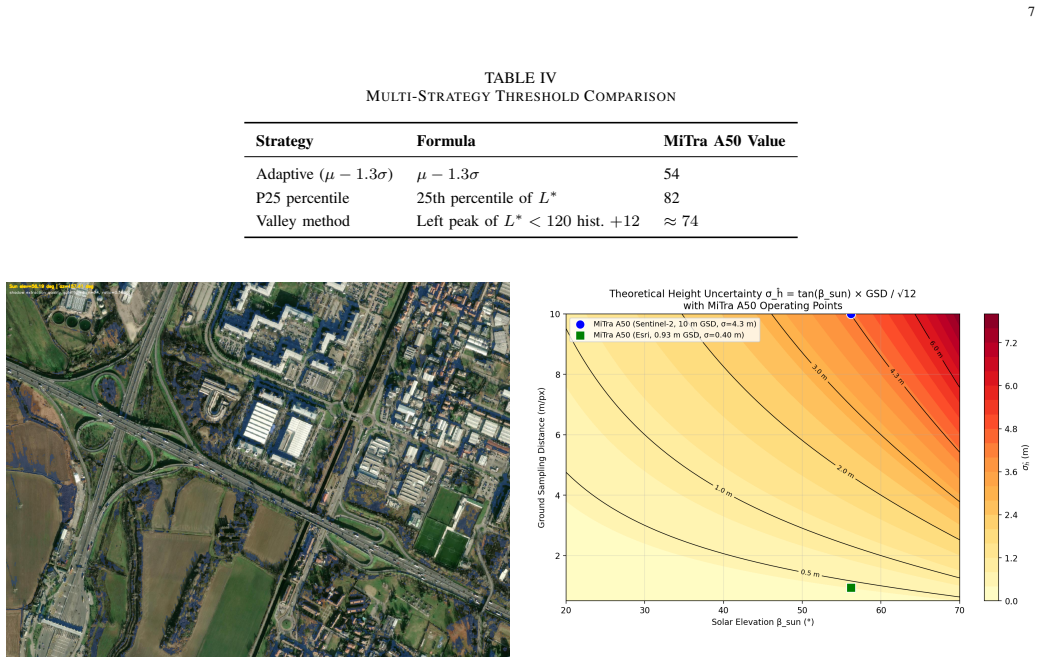
- Path planners can size obstacle-avoidance margins directly from per-building uncertainty (e.g., 8.6 m from 10 m GSD imagery), so pre-loaded geometry reduces the need for real-time LiDAR computation.
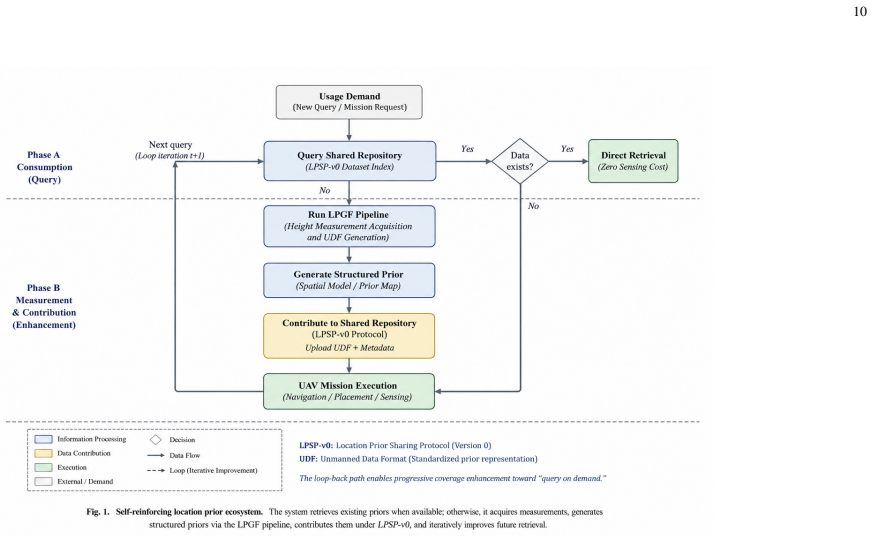
- Pre-loading the prior over an exchange format removes the need to transmit static building geometry during a mission, freeing bandwidth for dynamic obstacle updates.
- The same pipeline yields a bounded-error prior under cloudy, low-sun, or coarse-resolution conditions, not only under ideal satellite imaging.
- If multiple deployments contribute priors back to a shared repository, building-height coverage can accumulate over time, mirroring the growth model of volunteered geographic data.
Reading between the lines
- The universality of the ~5.5 m worst-case bound is an inference beyond the data: it holds for the calibration corridor's building stock, and generalizing it to other morphologies (towers, informal settlements) is not yet tested.
- Because the quality gate is tuned to mid-latitude solar geometry, high-latitude winter scenes would almost always trigger fallback; this is safe, but it also means the shadow module may never be exercised in the conditions it was built for.
- The paper's own manual count shows the type defaults are biased high by 2.6-3.3 m; a natural extension is an online calibration that updates the default table using occasional verified measurements, which the paper leaves to future work.
- A testable extension is to simulate repeated missions over one region and measure how quickly the blended prior's uncertainty drops as more tiers populate, which would validate the sharing-repository idea.
Editorial analysis
A structured set of objections, weighed in public.
Referee Report
Summary. The paper proposes LPGF, a multi-source data fusion pipeline that generates building height priors for low-altitude urban operations by integrating Sentinel-2 imagery, UAV telemetry, vehicle GPS trajectories, and OpenStreetMap footprints. Heights are assigned via a three-tier fallback hierarchy (OSM height tags, floor-count conversion, type defaults), with an optional shadow-based height estimation module (SHEM) gated by a four-criterion quality check. The authors claim a bounded worst-case error of about 5.5 m for the fallback, and validate the approach on the MiTra A50 Milan corridor, where both SHEM attempts were rejected by the gate, producing a consistent 27-building prior. Tier 3 defaults were validated against n=15 manual floor counts, achieving MAE=3.07 m within the stated 5.0 m uncertainty bound.
Significance. The problem is timely and relevant: building height data are missing for most structures, and a low-cost, open-data pipeline that produces structured priors with uncertainty metadata could support drone delivery, urban air mobility, and digital twin applications. The paper's strengths include an open-source release, the LPSP-v0 self-describing exchange format, the explicit per-building uncertainty output, and the demonstration of a quality gate that correctly rejects unsuitable satellite imagery in two distinct failure modes. The architectural idea of treating GIS footprints as the authoritative skeleton and satellite imagery as an optional, quality-controlled enhancement is sensible. However, the central quantitative claim—a bounded worst-case error of ~5.5 m—is not supported by the evidence, and the validation is largely circular. The framework may be valuable as a system design, but the stated guarantee must be reframed or substantiated with independent ground truth.
major comments (4)
- [Section V-A, C1 and Remark 1] The claim of 'worst-case error ≈5.5 m' is a mischaracterization. σ̂_{h,i}=5.0 m is a per-building standard deviation, not an error bound, and adding a 10% engineering margin does not convert a standard deviation into a worst-case envelope. With roughly normal errors, more than 30% of errors exceed 5 m, so 5.5 m cannot be called a bound. The validation in Table VII reports only MAE and RMSE, not the maximum error or any quantile. The abstract and conclusion repeat the 'worst-case' language even though Section VII-C item 1 acknowledges the absence of LiDAR ground truth. Please either replace 'worst-case' with 'nominal per-building uncertainty' or derive a genuine probabilistic bound (e.g., via Chebyshev) with a stated confidence.
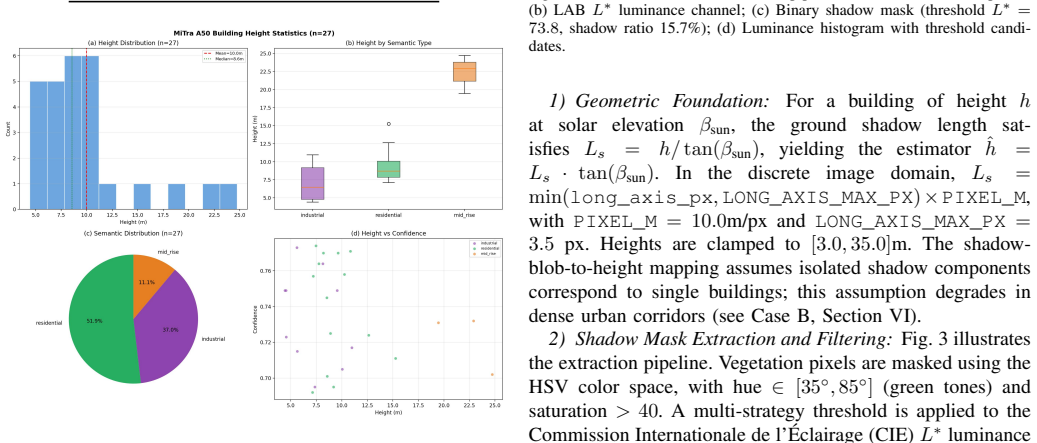
- [Section VI-F, Table VII] The Tier 3 validation is circular. The default heights (industrial 6.5 m, residential 9.0 m) are calibrated to the A50 corridor (Section V-A: 'calibrated to the A50 corridor's building stock') and then validated on manual floor counts from the same corridor. The 'measured' height is floors×3.2 m, the same conversion factor used in Tier 2, so the comparison is not independent. The sample is small (n=15), no confidence interval is given, and the manual-count uncertainty of ±0.5–1.0 m (Section VII-C item 6) is not propagated. That MAE=3.07 m falls below 5.0 m is vacuous because 5.0 m is an input assumption, not an empirically derived error bound.
- [Sections V-C and VI-B] The quality gate is only validated on negative cases: in both Case A and Case B, SHEM is rejected and the pipeline falls back. The positive path—where SHEM produces acceptable heights—is never tested or validated. The paper acknowledges this in Section V-C ('implementation and validation are deferred to future work') and Section VIII, but the Introduction and contribution list imply a more complete validation of the two-stage architecture. Please clarify in the contributions that only the rejection path is experimentally demonstrated, and that SHEM's accuracy under favorable conditions remains unvalidated.
- [Section V-A, Table II] The per-tier uncertainty values (1.0, 2.5, 5.0 m) and the 3.2 m/story factor are introduced without empirical justification or citation. These hand-assigned numbers directly determine the claimed 5.5 m envelope and the confidence values. Without a derivation or a sensitivity analysis, the entire uncertainty quantification is an assertion. Provide references for the conversion factor and uncertainty assignments, or perform a sensitivity analysis showing how the envelope changes with these parameters.
minor comments (5)
- [Section III-A] In the example, 's1 = residential' appears to be a semantic type, but the notation is not defined for s_i. Please define the semantic class field explicitly.
- [Section V-C] The parameter is written as 'Long_AXIS_MAX_PX' in the text but 'LONG_AXIS_MAX_PX' in the equation. Unify the capitalization.
- [Section VI-F, Table VII footnote] The footnote about mezzanine/attic levels and the alternative 1.5-story count is hard to follow. Consider moving this discussion to the main text and clarifying how the manual count was reconciled.
- [Table VI] The 'OSM-only' row uses default values but the note is terse. Explain in the table caption or text what 'default values' means and why OSM height tags are sparse in this area.
- [Throughout] Minor spacing issues with 'UA V' appear in several places; please use 'UAV' consistently.
Circularity Check
The claimed ≈5.5 m worst-case bound is 1.1× an assumed σ_max=5.0 m input, and the Tier 3 validation is performed on the same A50 corridor used to calibrate the defaults.
-
self definitional
[Section III-B, Constraint C1 & Remark 1; Section V-A]
"•(C1) Bounded Uncertainty: σ_hat,i ≤ σ_max, ∀i∈B, where σ_max = 5.0m for structured fallback ... [Remark 1] The 5.5m envelope is a conservative engineering margin above the formal per-building bound of σ_hat,i = 5.0m (constraint C1). See Section V-A for the full derivation ... [V-A] The formal worst-case per-building uncertainty is σ_hat,i = 5.0m (Tier 3, constraint C1). The conservative 5.5m envelope adopted throughout this paper adds a 10% engineering margin above the formal bound."
The claimed output ('worst-case error of approximately 5.5m') is not derived from data or from a statistical error model; it is created from the design input. Constraint C1 simply asserts σ_max = 5.0m for structured fallback, and Remark 1/V-A define the 5.5m envelope as 1.1 × σ_max. A chosen standard-deviation-style uncertainty does not cap individual errors, so calling this a guaranteed worst-case bound makes the prediction equal to the assumption by construction. The later validation using MAE/RMSE cannot convert an assumed sigma into a proven maximum error.
-
fitted input called prediction
[Section V-A (Tier 3) and Section VI-F, Table VII]
"The default values (industrial: 6.5m, residential: 9.0m, mid-rise: 17.5m) are calibrated to the A50 corridor’s building stock. ... The overall MAE of 3.07m is within the Tier 3 uncertainty bound of σ_hat,i = 5.0m (constraint C1), confirming that the structured fallback’s worst-case error envelope is conservative for this building stock."
Tier 3 default heights are described as calibrated to the A50 corridor, and the validation uses manual floor counts from the 800m research radius, i.e., the same corridor. The MAE = 3.07m is therefore an in-sample fit check, not an out-of-sample prediction. Reporting it as confirming the 5.0m/5.5m bound treats the fitted defaults and the chosen uncertainty as independent evidence, when the validation cohort is the calibration population and no LiDAR, held-out, or regional test is provided. The paper's own Section VII-C limitations concede no LiDAR ground truth and call the n=15 check a pilot study.
full rationale
The central quantitative claim is the 'worst-case error of approximately 5.5m' attributed to the three-tier fallback. On inspection this is not a derived result: Constraint C1 sets σ_max = 5.0m, and the 5.5m envelope is merely a 10% margin over that assigned number. Remark 1 explicitly labels it a 'conservative engineering margin.' The validation section then compares the MAE of Tier 3 defaults to that same 5.0m bound and declares it 'confirming' the envelope. This is a consistency check on an assumed parameter, not a prediction, and it does not establish a worst-case error bound: MAE/RMSE are not maxima, no confidence interval or maximum error is reported, and a 5.0m standard-deviation-style uncertainty implies some errors will exceed 5m. Furthermore, the Tier 3 defaults are 'calibrated to the A50 corridor's building stock' and the validation counts are drawn from the same 800m A50 radius, so the n=15 MAE is in-sample. The paper's own Section VII-C limitations (no LiDAR ground truth, 'pilot study' with n=15, manual-count uncertainty ±0.5–1.0m) reinforce that the 5.5m guarantee is an assumption rather than an established bound. I do not see load-bearing self-citation: the references appear external, and the shadow-height formula is correctly credited to earlier geometric shadow work [9]–[11]. The quality-gate experiments on two imaging failure modes, the SVD-based road extraction, and the LPSP-v0 serialization are independent, non-circular contributions. Hence the circularity is partial: the headline error bound reduces to an author-assigned input validated on its own calibration corridor, while the rest of the pipeline has independent content. Score 6.
Assumptions & free parameters
free parameters (5)
- Tier 3 default heights (industrial, residential, mid-rise) =
industrial 6.5m, residential 9.0m, mid-rise 17.5m
- Per-story conversion factor =
3.2 m/story
- Per-tier uncertainty bounds =
σ = 1.0, 2.5, 5.0 m
- Quality-gate thresholds =
β_sun≥30°, f_cloud≤0.15, GSD≤10m, κ≥2.0; validator: n≥12, h̄∈[4,20]m, clip_ratio≤0.35, σ_h≥1.5m
- Shadow extraction thresholds =
L*=73.8, area 100–20000 m², aspect ≤4.5, compactness ≥0.05, LONG_AXIS_MAX_PX=3.5, PIXEL_M=10.0
assumptions (4)
- standard math The shadow-length-to-height formula h = L_s · tan(β_sun) holds for each building (flat terrain, isolated shadow, known solar elevation).
- domain assumption OSM building footprints are a reliable structural skeleton with known positional error 2–5 m.
- domain assumption Manual Google Earth floor counts are an acceptable ground truth for building height.
- domain assumption MiTra A50 UAV and GPS telemetry are accurate enough to define the hover center and road topology.
Cite this review
Pith. "Pith review of Location Prior Generation via Multi-Source Urban Data Fusion for Low-Altitude Air Mobility." pith.science (2026). https://pith.science/paper/IWDH3H2G
@misc{pith2026260525530,
  author       = {Pith},
  title        = {Pith review of: Location Prior Generation via Multi-Source Urban Data Fusion for Low-Altitude Air Mobility},
  year         = {2026},
  howpublished = {\url{https://pith.science/paper/IWDH3H2G}},
  note         = {Machine review of arXiv:2605.25530}
}
read the original abstract
Building height, the third dimension (3D) of urban spatial data, is absent in over 95% of structures in global geospatial databases. For the emerging low-altitude economy, this data gap forces each aerial platform to rely on real-time onboard sensing rather than pre-computed 3D scene geometry. We present the Location Prior Generation Framework (LPGF), a multi-source data fusion pipeline that integrates Sentinel-2 imagery, UAV telemetry, vehicle GPS trajectories, and OpenStreetMap footprints into structured, reusable urban location priors. LPGF assigns building heights through a three-tier priority hierarchy: (1) explicit OSM height tags where available, (2) floor count multiplied by 3.2 m per story where recorded, and (3) building-type default heights otherwise, yielding a worst-case error of approximately 5.5 m. An optional shadow-based height estimation module (SHEM) is activated only when a four-criterion quality gate is satisfied; when any criterion fails, the pipeline routes to structured fallback. On the MiTra A50 Milan dataset, the quality gate correctly identified two imaging failure modes: sub-pixel shadows at 10 m GSD and ground shadow merging at 0.93 m GSD, producing a consistent 27-building prior in both cases. Tier 3 type-default heights were validated against manual floor counts (n=15), achieving MAE=3.07 m within the 5.0 m uncertainty bound. The framework demonstrates that structured, quality-gated fusion of universally available data streams can bootstrap 3D scene coverage for low-altitude urban operations.
Figures
Figures from the paper (3 more)
Reference graph
Works this paper leans on
-
[1]
OpenStreetMap Database,
OpenStreetMap Contributors, “OpenStreetMap Database,” 2024, [On- line]. Available: https://www.openstreetmap.org
2024
-
[2]
A spatio-temporal analysis investigating completeness and inequalities of global urban building data in OpenStreetMap,
B. Herfort, S. Lautenbach, J. P. de Albuquerque, J. Anderson, and A. Zipf, “A spatio-temporal analysis investigating completeness and inequalities of global urban building data in OpenStreetMap,”Nature Communications, vol. 14, p. 3985, 2023
2023
-
[3]
Emerging urban challenge: RPAS/UA Vs in cities,
L. Russell, R. Goubran, and F. Kwamena, “Emerging urban challenge: RPAS/UA Vs in cities,” inProc. 15th Int. Conf. Distrib. Comput. Sensor Syst. (DCOSS), 2019, pp. 546–553
2019
-
[4]
Age of information in UA V- assisted real-time IoT systems with obstacle avoidance,
X. Ma, B. Zhou, W. Wang, and Q. Wu, “Age of information in UA V- assisted real-time IoT systems with obstacle avoidance,” inProc. IEEE 23rd Int. Conf. Commun. Technol. (ICCT), 2023, pp. 1002–1007
2023
-
[5]
V osselman and H.-G
G. V osselman and H.-G. Maas,Airborne and Terrestrial Laser Scanning. Whittles Publishing, 2010
2010
-
[6]
‘Structure-from-Motion’ photogrammetry: A low-cost, effective tool for geoscience applications,
M. J. Westoby, J. Brasington, N. F. Glasser, M. J. Hambrey, and J. M. Reynolds, “‘Structure-from-Motion’ photogrammetry: A low-cost, effective tool for geoscience applications,”Geomorphology, vol. 179, pp. 300–314, 2012
2012
-
[7]
National-scale mapping of building height using Sentinel-1 and Sentinel-2 time series,
D. Frantz, F. Schug, A. Okujeni, C. Navacchi, W. Wagner, S. van der Linden, and P. Hostert, “National-scale mapping of building height using Sentinel-1 and Sentinel-2 time series,”Remote Sensing of Environment, vol. 252, p. 112128, 2021
2021
-
[8]
Building height esti- mation using shadow length in satellite imagery,
S. Chaudhry, M. Qureshi, S. Jabbar, and M. Taj, “Building height esti- mation using shadow length in satellite imagery,” 2024, arXiv preprint arXiv:2411.09411
arXiv 2024
Show all 25 references
-
[9]
Shadow detection and building- height estimation using IKONOS data,
Y . Shao, G. N. Taff, and S. J. Walsh, “Shadow detection and building- height estimation using IKONOS data,”Int. J. Remote Sens., vol. 32, no. 22, pp. 6929–6944, 2011
2011
-
[10]
Using shadows in high-resolution imagery to determine building height,
A. Comber, M. Umezaki, R. Zhou, Y . Ding, Y . Li, H. Fu, H. Jiang, and A. Tewkesbury, “Using shadows in high-resolution imagery to determine building height,”Remote Sens. Lett., vol. 3, no. 7, pp. 551–556, 2012
2012
-
[11]
Building height estimation from high resolution satellite images,
A. Rajji, A. Najine, A. Wafik, and A. Benmoussa, “Building height estimation from high resolution satellite images,”Int. J. Innov. Appl. Stud., vol. 35, no. 2, pp. 268–281, 2022
2022
-
[12]
Building detection in very high resolution multispectral data with deep learning features,
M. Vakalopoulou, K. Karantzalos, N. Komodakis, and N. Paragios, “Building detection in very high resolution multispectral data with deep learning features,” inProc. IEEE IGARSS, 2015, pp. 1873–1876
2015
-
[13]
Learning aerial image segmentation from online maps,
P. Kaiser, J. D. Wegner, A. Lucchi, M. Jaggi, T. Hofmann, and K. Schindler, “Learning aerial image segmentation from online maps,” IEEE Trans. Geosci. Remote Sens., vol. 55, no. 11, pp. 6054–6068, 2017
2017
-
[14]
Inferring road maps from GPS traces,
J. Biagioni and J. Eriksson, “Inferring road maps from GPS traces,” Transp. Res. Rec., vol. 2291, no. 1, pp. 61–71, 2012
2012
-
[15]
MiTra: A drone-based trajectory data for an all-traffic-state inclusive freeway with ramps,
A. A. Chaudhari, M. Treiber, and O. Okhrin, “MiTra: A drone-based trajectory data for an all-traffic-state inclusive freeway with ramps,” Scientific Data, vol. 12, p. 1174, 2025
2025
-
[16]
A GIS application for UA V flight planning,
M. Mangiameli, G. Muscato, G. Mussumeci, and C. Milazzo, “A GIS application for UA V flight planning,” inProc. 2nd IFAC Workshop RED- UAS, 2013, pp. 147–151
2013
-
[17]
Deep learning enabled semantic communication systems,
H. Xie, Z. Qin, G. Y . Li, and B. H. Juang, “Deep learning enabled semantic communication systems,”IEEE Trans. Signal Process., vol. 69, pp. 2663–2674, 2021
2021
-
[18]
Easy Access Rules for U-space,
EASA, “Easy Access Rules for U-space,” 2024, [Online]. Available: https://www.easa.europa.eu/en/document-library/easy-access-rules/ easy-access-rules-u-space
2024
-
[19]
Unmanned Aircraft Systems (UAS) Traffic Management (UTM) Concept of Operations v2.0,
FAA, “Unmanned Aircraft Systems (UAS) Traffic Management (UTM) Concept of Operations v2.0,” 2023, [Online]. Available: https://www. faa.gov/uas/research_development/traffic_management
2023
-
[20]
Data quality in Internet of Things: A state-of-the-art survey,
A. Karkouch, H. Mousannif, H. A. Moatassime, and T. Noel, “Data quality in Internet of Things: A state-of-the-art survey,”J. Netw. Comput. Appl., vol. 73, pp. 57–81, 2016
2016
-
[21]
Sentinel-2A Level-2A, Tile 32TNQ, 2023-04-26T10:16:01Z,
ESA, “Sentinel-2A Level-2A, Tile 32TNQ, 2023-04-26T10:16:01Z,” 2023, copernicus Open Access Hub
2023
-
[22]
How good is volunteered geographical information? A comparative study of OpenStreetMap and Ordnance Survey datasets,
M. Haklay, “How good is volunteered geographical information? A comparative study of OpenStreetMap and Ordnance Survey datasets,” Environ. Plann. B, vol. 37, no. 4, pp. 682–703, 2010
2010
-
[23]
Survey of advances in guidance, navigation, and control of unmanned rotorcraft systems,
F. Kendoul, “Survey of advances in guidance, navigation, and control of unmanned rotorcraft systems,”J. Field Robot., vol. 29, no. 2, pp. 315–378, 2012
2012
-
[24]
Semantic communications: Principles and challenges,
Z. Qin, X. Tao, J. Lu, and G. Y . Li, “Semantic communications: Principles and challenges,” 2022, arXiv preprint arXiv:2201.01389
2022 arXiv
-
[25]
Ap- plications of 3D city models: State of the art review,
F. Biljecki, J. Stoter, H. Ledoux, S. Zlatanova, and A. Coltekin, “Ap- plications of 3D city models: State of the art review,”ISPRS Int. J. Geo-Inf., vol. 4, no. 4, pp. 2842–2889, 2015. APPENDIX A. Schema Overview LPSP-v0 defines a standardized JSON exchange format. Each prior...
2015
Reviewed August 2, 2026 · model on record in the stance chip above.
Discussion (0). Continue with ORCID to comment.