GAGI: A Gini-Adjusted GDP-per-Capita Index for Distribution-Aware Macroeconomic Welfare Monitoring
Pith reviewed 2026-06-27 14:42 UTC · model grok-4.3
The pith
GAGI multiplies GDP per capita by (1 minus the Gini coefficient) and a price-level factor, then normalizes to 2010, to expose welfare shortfalls that aggregate output measures conceal.
A machine-rendered reading of the paper's core claim, the machinery that carries it, and where it could break.
Core claim
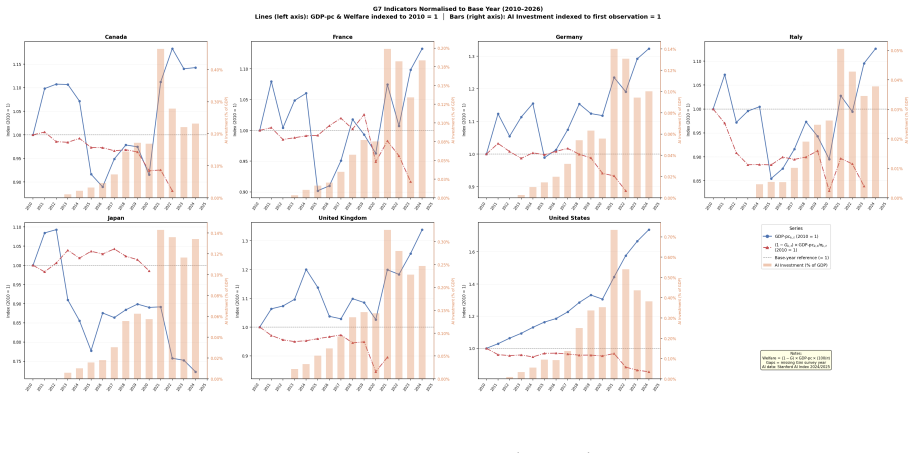
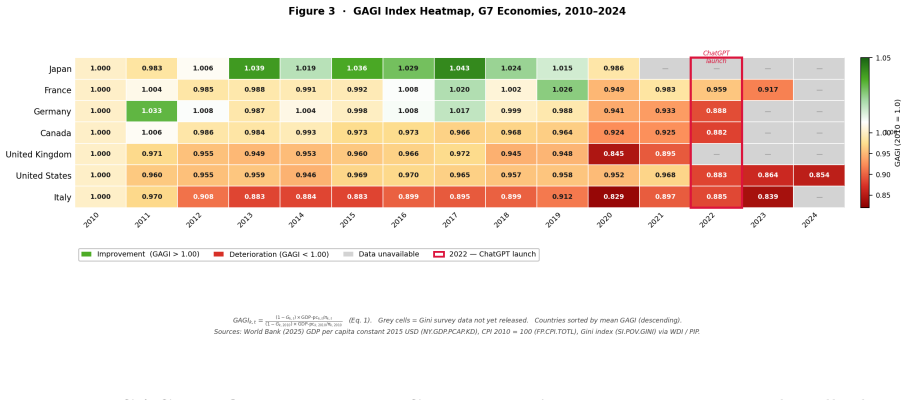
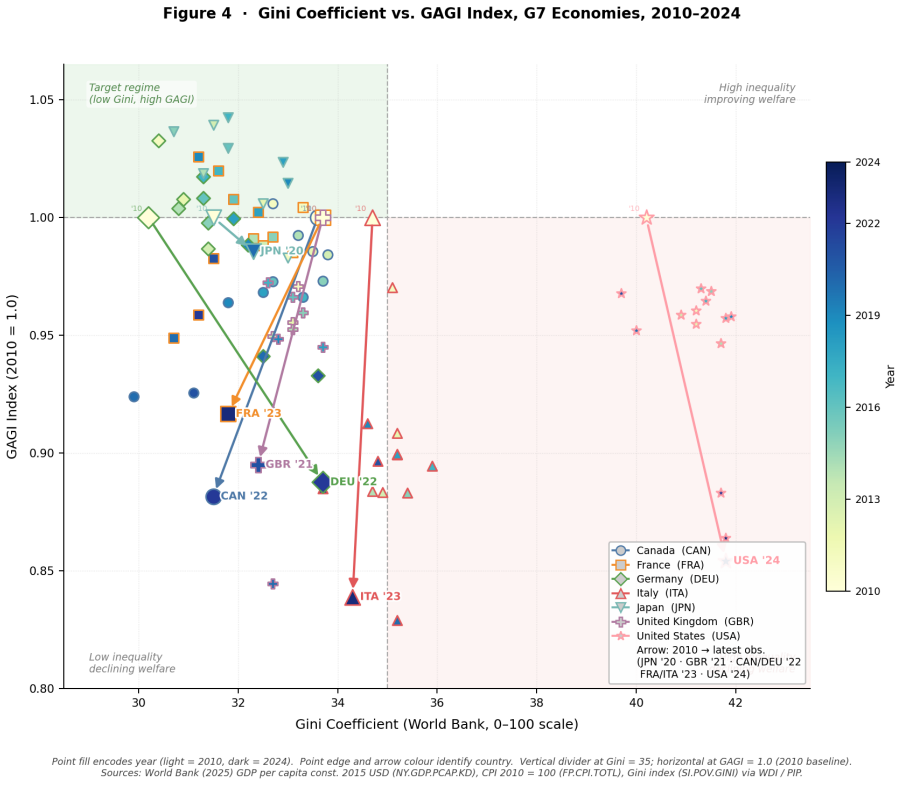
GAGI is defined by rescaling each country's GDP per capita by its inequality-adjustment factor (1-G) and its price level, then normalising the result to a 2010 baseline. When computed for the G7 over 2010-2026 the index shows welfare-adjusted prosperity diverging persistently and increasingly from headline GDP growth, with the divergence sharpening after 2022. The index is presented as a reproducible, publicly computable instrument applicable wherever welfare-adjusted prosperity must be tracked alongside output.
What carries the argument
The Gini-Adjusted GDP per Capita Index (GAGI), which multiplies GDP per capita by (1-G) and a price-level factor before normalisation to 2010.
If this is right
- Monitoring systems that track only aggregate output will miss distributional harm from automation even while reported growth stays strong.
- GAGI can be recomputed annually from public data without requiring additional modeling assumptions.
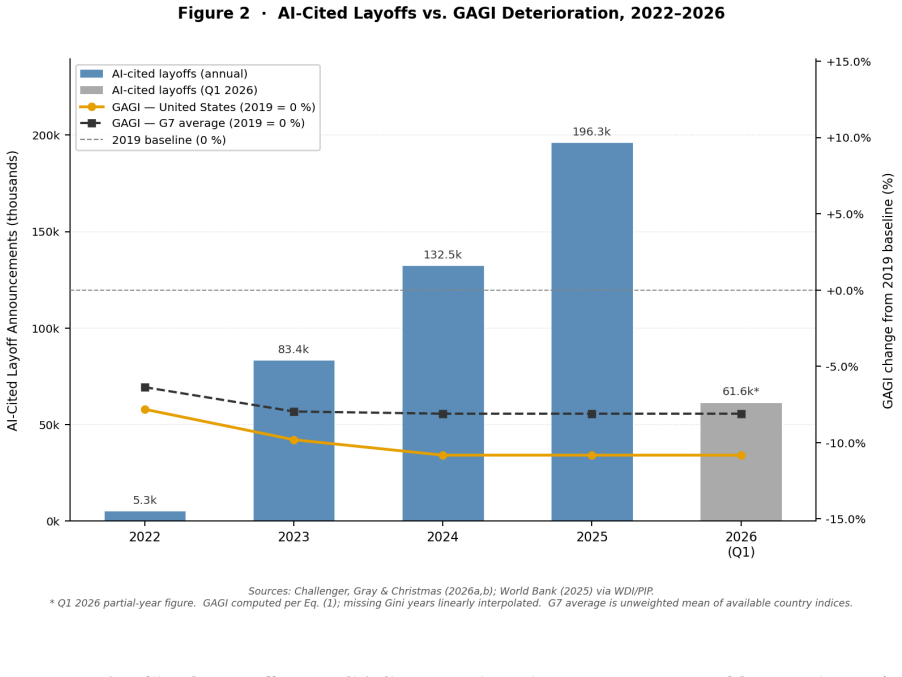
- In the G7 the gap between GAGI and GDP growth widened after 2022, temporally coincident with post-COVID and generative-AI developments.
- The same rescaling procedure applies to any setting in which welfare-adjusted prosperity needs tracking alongside output.
Where Pith is reading between the lines
- Countries could set GAGI thresholds that trigger automatic review of redistribution or automation policies when the index falls while GDP rises.
- Cross-country GAGI rankings might reveal which policy mixes best preserve broad-based prosperity during technological transitions.
- If price-level adjustments prove sensitive to different inflation measures, the index could be recomputed with alternative deflators to test robustness.
Load-bearing premise
That multiplying GDP per capita by (1-G) and a price-level factor then normalising to 2010 produces a transparent statistic regulators can use to detect distributional harm without further modeling.
What would settle it
A direct comparison in which GAGI and unadjusted GDP per capita move in lockstep across multiple countries during a documented period of rising inequality would falsify the claim that the adjustment reliably separates distributional effects from aggregate growth.
Figures
read the original abstract
GDP per capita is the default lens through which governibng bodies track the economic prosperity and consequences of economic events , yet it is blind to two first-order determinants of lived prosperity: income/wealth distribution and inflation impact. Inequality-adjusted income measures are themselves not new but What is missing from the macroeconomic monitoring toolkit specifically is not a welfare concept but an operational monitoring trigger: a statistic minimal enough to compute annually from public data, transparent enough to audit without modelling assumptions, and normalised so that year-on-year, cross-country change ? the quantity a regulator needs to act on? is legible. We assemble such an instrument, the Gini- Adjusted GDP per Capita Index (GAGI): a reproducible, publicly computable formulation that rescales each country's GDP per capita by its inequality-adjustment factor (1-G) and its price level, normalised to a 2010 baseline. GAGI is a general-purpose welfare index, not inherently specific to AI automation, applicable wherever welfare-adjusted prosperity needs tracking. Applying GAGI to the G7 economies over 2010-2026, we show that welfare-adjusted prosperity has diverged persistently and increasingly from headline GDP growth, that the divergence widens sharply after 2022, temporally coincident with, though not, on this evidence alone, demonstrated to be caused by the after effects of COVID and the acceleration of generative-AI deployment. We argue that GAGI is a necessary complement to GDP-based monitoring: any macroeconomic monitoring instrument that tracks only aggregate output will systematically miss the distributional harm that automation can cause even while reported growth remains strong.
Editorial analysis
A structured set of objections, weighed in public.
Referee Report
Summary. The paper proposes the Gini-Adjusted GDP-per-Capita Index (GAGI) as a minimal, publicly computable statistic that rescales each country's GDP per capita by its inequality-adjustment factor (1-G) and a price-level factor, then normalizes to a 2010 baseline. Applied to G7 economies over 2010-2026, GAGI reveals persistent divergence from headline GDP growth that widens sharply after 2022. The authors argue that GAGI is a necessary complement to GDP-based monitoring because aggregate output measures systematically miss distributional harms, such as those potentially caused by automation.
Significance. If the construction holds, GAGI supplies a reproducible, assumption-light monitoring trigger from public data series that could be directly usable by regulators to track welfare-adjusted prosperity. The reported post-2022 divergence constitutes a concrete, falsifiable observation that could inform policy discussion on distributional effects. The paper's explicit commitment to public data inputs and normalization is a strength that supports auditability.
major comments (1)
- [Abstract] Abstract: the claim that GAGI is 'transparent enough to audit without modelling assumptions' is not secured by the manuscript. The specific functional form (1-G) is a substantive modeling choice about the welfare penalty of inequality; the text provides no derivation, justification, or robustness comparison to alternatives such as Atkinson indices with different aversion parameters. This choice is load-bearing for the central necessity claim that GAGI functions as a minimal, assumption-light trigger.
minor comments (2)
- [Abstract] Abstract: typo 'governibng' should read 'governing'.
- [Abstract] Abstract: the phrasing 'year-on-year, cross-country change ? the quantity a regulator needs to act on? is legible' is unclear and requires rewording for readability.
Simulated Author's Rebuttal
We thank the referee for their careful reading of the manuscript and for highlighting this important point about the abstract's claims. We respond to the single major comment below.
read point-by-point responses
-
Referee: [Abstract] Abstract: the claim that GAGI is 'transparent enough to audit without modelling assumptions' is not secured by the manuscript. The specific functional form (1-G) is a substantive modeling choice about the welfare penalty of inequality; the text provides no derivation, justification, or robustness comparison to alternatives such as Atkinson indices with different aversion parameters. This choice is load-bearing for the central necessity claim that GAGI functions as a minimal, assumption-light trigger.
Authors: We agree that the (1-G) functional form is a substantive modeling choice that requires explicit justification and that the current manuscript does not provide a derivation or robustness checks against alternatives such as Atkinson indices. This does limit the strength of the 'without modelling assumptions' phrasing. In the revised version we will (i) qualify the relevant sentence in the abstract to acknowledge that GAGI employs a standard but chosen adjustment, (ii) insert a brief methods subsection that justifies the (1-G) form by reference to its use in existing welfare indices and its computational simplicity, and (iii) add a short robustness appendix comparing GAGI trajectories to an Atkinson-adjusted series with epsilon=1. These revisions will directly address the auditability concern while preserving the index's public-data construction. revision: yes
Circularity Check
No circularity: index is an explicit definition from public series
full rationale
The paper defines GAGI directly as GDP per capita rescaled by (1-G), a price-level factor, and normalized to the 2010 baseline. This is a construction from publicly available inputs with no fitted parameters, no predictions that reduce to those inputs by construction, and no load-bearing self-citations or uniqueness theorems. The observed divergence in G7 data is a direct computation of the defined index rather than a derived result that loops back to the definition. No steps match any of the enumerated circularity patterns.
Axiom & Free-Parameter Ledger
axioms (1)
- domain assumption Rescaling GDP per capita by (1-Gini) and price level yields a transparent welfare measure without additional modeling assumptions.
Reference graph
Works this paper leans on
-
[1]
The simple macroeconomics of AI.Economic Policy, 40(121):13–58, 2025
Daron Acemoglu. The simple macroeconomics of AI.Economic Policy, 40(121):13–58, 2025. doi: 10.3386/w32487. NBER Working Paper 32487, 2024
-
[2]
Daron Acemoglu and Pascual Restrepo. Automation and new tasks: How technology displaces and reinstates labor.Journal of Economic Perspectives, 33(2):3–30, 2019. doi: 10.1257/jep.33.2.3
-
[3]
Young workers’ employment drops in occupations with high AI exposure.Dallas Fed Economics, January 2026
Tyler Atkinson and Shane Yamco. Young workers’ employment drops in occupations with high AI exposure.Dallas Fed Economics, January 2026. URLhttps://www.dallasfed. org/research/economics/2026/0106. Federal Reserve Bank of Dallas. Official Reserve Bank research note. Underlying payroll data from Brynjolfsson, Chandar & Chen (2025, Stanford WP)
2026
-
[4]
Autor, Frank Levy, and Richard J
David H. Autor, Frank Levy, and Richard J. Murnane. The skill content of recent technolog- ical change: An empirical exploration.Quarterly Journal of Economics, 118(4):1279–1333,
-
[5]
doi: 10.1162/003355303322552801
-
[6]
The potentially large effects of artificial intelli- gence on economic growth
Joseph Briggs and Devesh Kodnani. The potentially large effects of artificial intelli- gence on economic growth. Technical report, Goldman Sachs Global Economics, March
-
[7]
300M full-time jobs
URLhttps://www.gspublishing.com/content/research/en/reports/2023/03/ 27/d64e052b-0f6e-45d7-967b-d7be35fabd16.html. Grey literature / investment-bank re- search note. “300M full-time jobs” is an exposure estimate, not a forecast of realized job losses. Sectoral task-automatable shares: Exhibit 5
2023
-
[8]
Pan- ton, Carlo Pizzinelli, Emma Rockall, and Marina M
Mauro Cazzaniga, Florence Jaumotte, Longji Li, Giovanni Melina, Augustus J. Pan- ton, Carlo Pizzinelli, Emma Rockall, and Marina M. Tavares. Gen-AI: Artificial intelli- gence and the future of work. Staff Discussion Note SDN/2024/001, International Mone- tary Fund, 2024. URLhttps://www.imf.org/-/media/files/publications/sdn/2024/ english/sdnea2024001.pdf
2024
-
[9]
2025 year-end job cut report: Highest Q4 layoffs since 2008; lowest YTD hiring since 2010
Challenger, Gray & Christmas. 2025 year-end job cut report: Highest Q4 layoffs since 2008; lowest YTD hiring since 2010. Technical report, Challenger, Gray & Christmas, Inc., January 2026. URLhttps://www.challengergray.com/blog/ 2025-year-end-challenger-report-highest-q4-layoffs-since-2008-lowest-ytd-hiring-since-2010/. Accessed April 2026. Monthly series...
2025
-
[10]
March 2026 job cuts report: AI leads reasons
Challenger, Gray & Christmas. March 2026 job cuts report: AI leads reasons. Technical report, Challenger, Gray & Christ- mas, Inc., apr 2026. URLhttps://www.challengergray.com/blog/ challenger-report-march-cuts-rise-25-from-february-ai-leads-reasons/. Ac- cessed April 2026
2026
-
[11]
The economic potential of generative AI: The next productivity frontier
Michael Chui, Eric Hazan, Roger Roberts, Alex Singla, Kevin Stryker, Lareina Yee, Rodney Zemmel, and Bryce Hall. The economic potential of generative AI: The next productivity frontier. Technical report, McKinsey Global Institute, June
-
[12]
Grey literature / industry research
URLhttps://www.mckinsey.com/capabilities/tech-and-ai/our-insights/ the-economic-potential-of-generative-ai-the-next-productivity-frontier. Grey literature / industry research. Automation timeline (midpoint 2045) and sectoral productiv- ity estimates are model projections, not observed outcomes
2045
-
[13]
Scott Davis
J. Scott Davis. AI is simultaneously aiding and replacing workers, wage data suggest.Dallas Fed Economics, February 2026. URLhttps://www.dallasfed.org/research/economics/ 2026/0224. Federal Reserve Bank of Dallas. Official Reserve Bank research note
2026
-
[14]
Tyna Eloundou, Sam Manning, Pamela Mishkin, and Daniel Rock. GPTs are GPTs: Labor market impact potential of large language models.Science, 384(6702):1306–1308, 2024. doi: 10.1126/science.adj0998
-
[15]
Labour force survey (LFS): Employment by sex, age and occupation (ISCO- 08)
Eurostat. Labour force survey (LFS): Employment by sex, age and occupation (ISCO- 08). Eurostat dataset lfsi_emp_a, 2024. URLhttps://ec.europa.eu/eurostat/web/lfs. EU-27 employment shares by skill level (ISCO 1-digit aggregated to high/medium/low), 2010–2023
2024
-
[16]
Harmonised index of consumer prices (HICP), all items, EU-27
Eurostat. Harmonised index of consumer prices (HICP), all items, EU-27. Eurostat dataset prc_hicp_aind, 2026. URLhttps://ec.europa.eu/eurostat/web/hicp. January 2019 and February 2026 index values used to compute 21.3% cumulative EU inflation. Accessed April 2026
2026
-
[17]
IFR Sta- tistical Department, Frankfurt, 2024
International Federation of Robotics.World Robotics 2024: Industrial Robots. IFR Sta- tistical Department, Frankfurt, 2024. URLhttps://ifr.org/ifr-press-releases/news/ robot-installations-rise-again. Robot density per 10,000 manufacturing employees, 2023 data. Denmark: 274; Sweden: 343; Germany: 415; Japan: 397; US: 295; South Korea: 1,012
2024
-
[18]
ISBN 978-92-2- 040791-7
International Labour Organization.Global Wage Report 2024–25: Is Wage Inequality Decreasing Globally?ILO, Geneva, 2024. ISBN 978-92-2- 040791-7. URLhttps://www.ilo.org/publications/flagship-reports/ global-wage-report-2024-25-wage-inequality-decreasing-globally. Official UN system flagship publication. Key data: Figures 3.1, 3.2; Statistical Annex Tables ...
2024
-
[19]
AI preparedness index dashboard, June 2024
International Monetary Fund. AI preparedness index dashboard, June 2024. URL https://www.imf.org/external/datamapper/AIPI. 174 economies; scores 0–1. Released 25 June 2024 (Melina, lead). Dimensions: digital infrastructure, human capital and labour- market policies, innovation and economic integration, regulation and ethics
2024
-
[20]
World economic outlook, october 2025, October 2025
International Monetary Fund. World economic outlook, october 2025, October 2025. URL https://www.imf.org/en/Publications/WEO/Issues/2025/10/. Statistical Appendix Ta- bles A.1–A.4. G7 real GDP per capita growth rates and CPI inflation, 2025 preliminary estimates. Official IMF publication. 12
2025
-
[21]
World economic outlook, april 2026, April 2026
International Monetary Fund. World economic outlook, april 2026, April 2026. URLhttps: //www.imf.org/en/Publications/WEO/Issues/2026/04/. G7 real GDP per capita and CPI partial-year projections, 2026. Official IMF publication
2026
-
[22]
The human utility factor: A computable welfare metric that reframes AI governance as a constrained optimisation problem
Sivasathivel Kandasamy. The human utility factor: A computable welfare metric that reframes AI governance as a constrained optimisation problem. Under review at Nature Machine Intelligence, 2026. Main companion paper
2026
-
[23]
Perspectives on the labor share.Journal of Economic Perspectives, 38(2):107–136, 2024
Loukas Karabarbounis. Perspectives on the labor share.Journal of Economic Perspectives, 38(2):107–136, 2024. doi: 10.1257/jep.38.2.107. Peer-reviewed. Working paper version: Federal Reserve Bank of Minneapolis WP 800, revised March 2024. Confirms continued decline post-2014; documents substantial cross-country heterogeneity
-
[24]
The global decline of the labor share.Quarterly Journal of Economics, 129(1):61–103, 2014
Loukas Karabarbounis and Brent Neiman. The global decline of the labor share.Quarterly Journal of Economics, 129(1):61–103, 2014. doi: 10.1093/qje/qjt032
-
[25]
Anton Korinek and Joseph E. Stiglitz. Artificial intelligence and its implications for income distribution and unemployment. In Ajay Agrawal, Joshua Gans, and Avi Goldfarb, editors, The Economics of Artificial Intelligence: An Agenda. University of Chicago Press, 2019. doi: 10.7208/9780226613475-014
-
[26]
Tech layoff tracker
Roger Lee. Tech layoff tracker. Technical report, Layoffs.fyi, 2026. URLhttps://layoffs. fyi. Crowd-aggregated; accessed April 2026. Annual totals cross-checked against Crunch- base and TechCrunch archives. Slight variation across snapshot dates reflects ongoing revi- sions
2026
-
[27]
How can it possibly fly? the paradox of a dynamic labour market in a scandinavian welfare state
Per Kongshøj Madsen. How can it possibly fly? the paradox of a dynamic labour market in a scandinavian welfare state. Working paper, Centre for Labour Market Research (CARMA), Aalborg University, 2006. Foundational reference on the Danish flexicurity model: flexible hiring/firing + generous unemployment benefits + active labour market policy
2006
-
[28]
The AI index 2024 annual re- port
Nestor Maslej, Loredana Fattorini, Raymond Perrault, Vanessa Parli, Anka Reuel, Erik Brynjolfsson, John Etchemendy, Katrina Ligett, Terah Lyons, James Manyika, Juan Car- los Niebles, Yoav Shoham, Russell Wald, and Jack Clark. The AI index 2024 annual re- port. Technical report, Institute for Human-Centered AI, Stanford University, April 2024. URLhttps://h...
arXiv 2024
-
[29]
The AI index 2025 annual report
Nestor Maslej, Loredana Fattorini, Raymond Perrault, et al. The AI index 2025 annual report. Technical report, Institute for Human-Centered AI, Stanford University, April 2025. URLhttps://hai.stanford.edu/ai-index/2025-ai-index-report. Chapter 4 (Econ- omy): private AI investment by country, 2014–2024 series. 2025 extrapolation anchor: USA $109B
2025
-
[30]
OECD.OECD Employment Outlook 2023: Artificial Intelligence and the Labour Market. OECD Publishing, Paris, 2023. doi: 10.1787/08785bba-en. Chapter 3, Figure 3.5: share of employment in occupations at highest automation risk, by OECD country
-
[31]
OECD employment outlook 2024: The net-zero transition and the labour market,
OECD. OECD employment outlook 2024: The net-zero transition and the labour market,
2024
-
[32]
Active labour market policy spending as % of GDP; Table 1.A3 country data
-
[33]
OECD Publishing, Paris,
OECD.OECD Compendium of Productivity Indicators 2025. OECD Publishing, Paris,
2025
-
[34]
Labour productivity, real labour compensation, and hours worked by country, 2000–2024
doi: 10.1787/d64d4b63-en. Labour productivity, real labour compensation, and hours worked by country, 2000–2024. Annual National Accounts indicator B1G_R_POP. 13
-
[35]
OECD/AIAS ICTWSS database on institutional characteristics of trade unions, wage setting, state intervention and social pacts, 2023
OECD/AIAS. OECD/AIAS ICTWSS database on institutional characteristics of trade unions, wage setting, state intervention and social pacts, 2023. URLhttps://www.oecd. org/employment/ictwss-database.htm. Collective-bargaining coverage and trade-union density, 2022 values
2023
-
[36]
Household income inequality, UK: Financial year ending 2024, 2024
Office for National Statistics (UK). Household income inequality, UK: Financial year ending 2024, 2024. URLhttps://www.ons.gov.uk/ peoplepopulationandcommunity/personalandhouseholdfinances/incomeandwealth/ bulletins/householdincomeinequalityfinancial/financialyearending2024. Real household disposable income per head, HDIHHQ series, FYE 2019–FYE 2024
2024
-
[37]
Bureau of Labor Statistics
U.S. Bureau of Labor Statistics. Occupational employment and wage statistics (OEWS), may 2024. BLS national industry-specific and cross-industry estimates, April 2025. URL https://www.bls.gov/oes/. Used to compute middle-wage occupation employment shares 2000–2024 per Autor-Dorn (2013) ISCO mapping
2024
-
[38]
Output Per Hour,
U.S. Bureau of Labor Statistics. Productivity and costs, fourth quarter and annual averages 2024: Major sector productivity. BLS News Release USDL-25-0401, March 2025. URL https://www.bls.gov/lpc/. Business-sector labour productivity and real compensation per hour, 2000–2024. Table A: “Output Per Hour,” “Real Hourly Compensation,” index 2017=100. Labor-sh...
2024
-
[39]
Bureau of Labor Statistics
U.S. Bureau of Labor Statistics. Consumer price index – all urban consumers (CPI-U), all items, U.S. city average. BLS Series CUUR0000SA0, April 2026. URLhttps://www.bls. gov/cpi/. Accessed April 2026. Index values January 2019 and March 2026 used to compute 24.6% cumulative inflation
2026
-
[40]
Census Bureau
U.S. Census Bureau. Income in the united states: 2023. Current Population Reports P60- 282, 2024. URLhttps://www.census.gov/library/publications/2024/demo/p60-282. html. Tables A-2, A-4a, H-3: Gini coefficients, income shares by quintile, and real median household income, 1967–2023
2023
-
[41]
Department of Labor, Wage and Hour Division
U.S. Department of Labor, Wage and Hour Division. History of federal minimum wage rates under the fair labor standards act, 1938–2009, 2024. URLhttps://www.dol.gov/ agencies/whd/minimum-wage/history. Federal minimum wage $7.25 since July 2009. Inflation-adjusted to 2024 dollars using BLS CPI-U series CUUR0000SA0
1938
-
[42]
Poverty and inequality platform (PIP), version 20250401, 2025
World Bank. Poverty and inequality platform (PIP), version 20250401, 2025. URLhttps: //pip.worldbank.org. Indicator SI.POV.GINI (Gini index). Accessed April 2026. Survey- year coverage varies by country; supplemented by OECD IDD for annual interpolation
2025
-
[43]
World development indicators (WDI), 2025
World Bank. World development indicators (WDI), 2025. URLhttps://databank. worldbank.org/source/world-development-indicators. Accessed April 2026. Indicators used:NY.GDP.PCAP.KD(GDP per capita, constant 2015USD) andFP.CPI.TOTL(Consumer Price Index, 2010=100), G7 economies, 2010–2024. Official statistics
2025
-
[44]
World Economic Forum, Geneva, January 2025
World Economic Forum.The Future of Jobs Report 2025. World Economic Forum, Geneva, January 2025. URLhttps://reports.weforum.org/docs/WEF_Future_of_Jobs_Report_ 2025.pdf. Grey literature; employer survey, 1,000+ firms, 14M workers, 22 industries, 55 economies. Net job projection (+78M) is sum of employer expectations, not a calibrated model forecast. 14 Fi...
2025
-
[45]
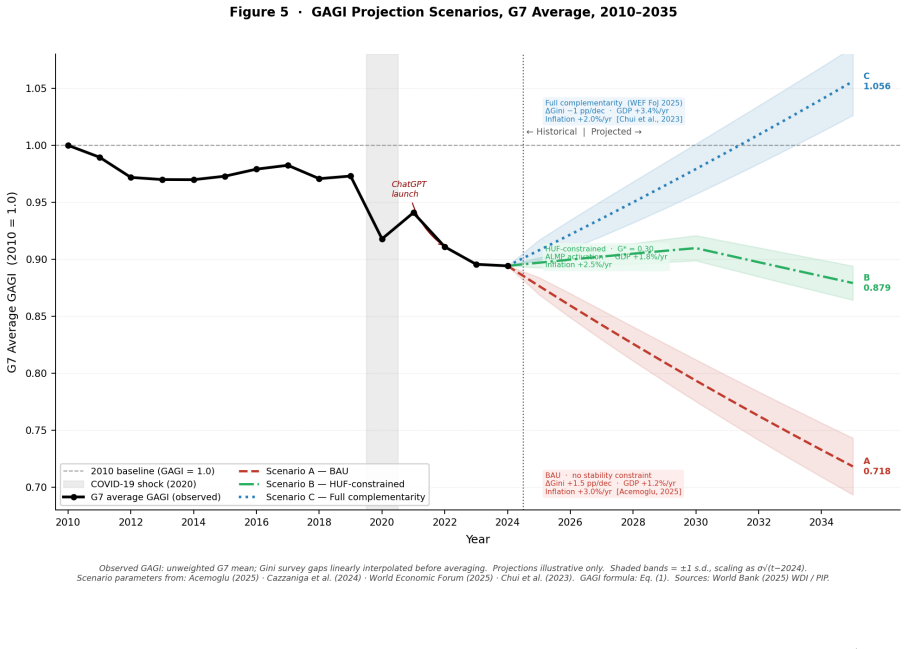
Scenario A (dashed red): business-as-usual, no stability constraint; Gini+1.5percentage points per decade; GDP growth at the Acemoglu ceiling [1]; inflation 3%/yr
are illustrative scenarios, not point forecasts; they bound the policy stakes.Solid black: observed G7-average GAGI (2010–2024) [37, 38]. Scenario A (dashed red): business-as-usual, no stability constraint; Gini+1.5percentage points per decade; GDP growth at the Acemoglu ceiling [1]; inflation 3%/yr. Scenario B (dash-dot green): governance-constrained; Gi...
2010
discussion (0)
Sign in with ORCID, Apple, or X to comment. Anyone can read and Pith papers without signing in.