REVIEW 4 major objections 5 minor 41 references
The Ongoing Decline in Activity of Comet 103P/Hartley 2
T0 review · 4 major / 5 minor · reviewed 2026-08-05 · deepseek-v4-flash
Pith's one-line read Comet Hartley 2 continues a steady fade, losing about 42% of its brightness each six-and-a-half-year return.
desk verdict The 2023 Hartley 2 photometry is valuable, but the paper's headline numbers do not reproduce from its own equations. read the letter →
The pith
A machine-rendered reading of the paper's core claim, the machinery that carries it, and where it could break.
The reading
What carries the argument
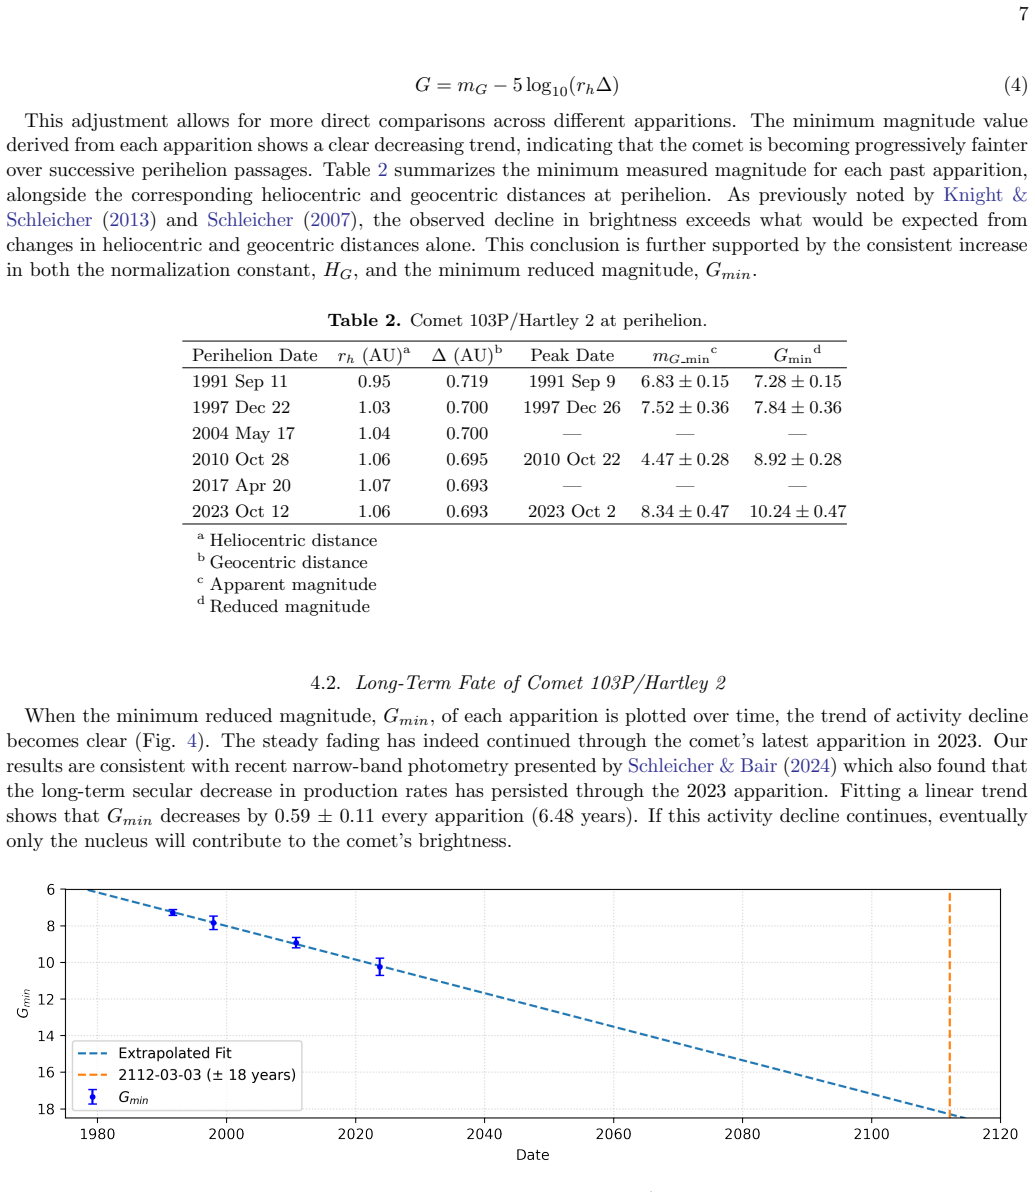
The load-bearing device is the reduced magnitude G = mG − 5 log10(rhΔ), which removes distance effects, applied to the upper envelope of each apparition's light curve. Brightness is fitted with mG = HG + 5 log10(rh) + k log10(Δ), with separate pre- and post-perihelion slopes; the minimum reduced magnitude from each fit is then regressed against apparition number to obtain the per-return decline. The flux ratio f = 10^(−0.4ΔGmin) and the assumption that active fraction scales linearly with coma flux convert the photometric trend into an activity trend.
What would settle it
A decisive check is to re-reduce the 2023 images using only frames whose surface-brightness profile shows no star-contamination spikes and a fixed aperture radius, then compare that Gmin with a same-passband series from the next apparition around 2030; if the 2023 Gmin moves by more than about 0.2 mag under the stricter reduction, or the next apparition does not come in about 0.6 mag fainter, the claimed per-return fading rate is not secure.
Extended reading notes
Core claim
The paper's central claim is that 103P/Hartley 2's activity is still declining on a human-observable timescale. Combining 2023 observations with archived photometry from earlier apparitions, the authors fit each apparition's light curve and track the minimum reduced magnitude Gmin—the brightness the comet would have if placed 1 AU from both the Sun and Earth. They find Gmin rose from 7.28 in 1991 to 10.24 in 2023, a linear trend of 0.59 ± 0.11 mag per 6.48-year orbit. Converting this to flux, each return delivers only 58% ± 6% of the previous apparition's peak outgassing, so peak activity is now lower than in 1991 by a factor of about 15, with a 1σ range of 9–26. Because coma brightness is t
Load-bearing premise
The trend assumes that unfiltered 2023 magnitudes, whose effective passband is closest to Gaia G, are directly comparable to the heterogeneous archived magnitudes from 1991, 1997, and 2010; a systematic passband or zero-point offset between apparitions would change the fitted ΔGmin and the active-fraction conclusion.
Editorial extensions
If this is right
- Hartley 2's peak brightness in 2023 was about 15 times lower than in 1991, with a 1σ range of roughly 9–26 times lower.
- The comet's effective active surface fraction dropped from about 1.17 at the 2010 perihelion to roughly 0.4 in 2023, so it no longer meets the definition of a hyperactive comet.
- If the linear trend continues, Hartley 2 will reach bare-nucleus magnitude around 2112 ± 18, with about 13 more active orbits as a lower limit; activity more likely fades asymptotically.
- The broadband decline of 42% ± 6% per orbit agrees with the roughly 40% per-orbit drop in water production reported previously, supporting progressive volatile depletion rather than observing geometry as the cause.
- Because the unfiltered flux includes a gas contribution of roughly 15–25%, dust mass-loss estimates from this photometry are upper limits.
Reading between the lines
- Beyond the paper's claims: if the trend is real, Hartley 2 could become a live example of a comet crossing from hyperactive to ordinary and eventually dormant, giving observers a rare chance to watch the end stages of a Jupiter-family comet over just a few decades.
- A cleaner test than fitting heterogeneous archived magnitudes would be a single-passband, aperture-matched photometric program across the next apparition around 2030, plus contemporaneous narrowband water-production measurements; the prediction is another ~0.6 mag fainter Gmin and a commensurate drop in gas production.
- The upper-envelope approach assumes the brightest points are uncontaminated; if any of those points are background-star blends, Gmin would be biased. Checking the 2023 frames for star-free windows against the surface-brightness spike filter would tighten the result.
- The active-fraction numbers assume constant nucleus size and a linear flux–production scaling over five orbits; both are approximations, so the 'no longer hyperactive' conclusion should be read as a quantitative estimate with systematic uncertainty comparable to the reported statistical error.
Editorial analysis
A structured set of objections, weighed in public.
Referee Report
Summary. The paper reports a 2023 observing campaign of comet 103P/Hartley 2 by Unistellar/AFA citizen astronomers, presents unfiltered broadband photometry, and fits an upper-envelope lightcurve to the 2023 data. The fitted minimum apparent magnitude is normalized to a reduced magnitude G_min = 10.24 ± 0.47. Combining this value with COBS-based fits for the 1991, 1997, and 2010 apparitions, the authors derive a linear secular fading of ΔG_min = 0.59 ± 0.11 mag per apparition, corresponding to a ~42% flux loss per orbit. From this they estimate that the active fraction has dropped by an order of magnitude since 1991 and that the comet may no longer be hyperactive. The paper interprets the trend as progressive volatile depletion and projects a nuclear-magnitude endpoint around 2112.
Significance. If the quantitative claim is correct, the paper provides a valuable, citizen-science-enabled confirmation of secular fading in a well-studied JFC on human-observable timescales. The public data table and the explicit comparison with the independent narrowband result of Schleicher & Bair (2024) are strengths. However, the central reduction chain has serious internal inconsistencies as printed: the G_min values in Table 2 do not follow from Eq. (4) with the quantities given, and the Table 1 fit parameters do not reproduce the tabulated m_G,min values. Because the headline slope, flux-loss fraction, and active-fraction statements are arithmetic on those tabulated values, the quantitative claims are not currently supported. The qualitative fading trend is plausible and consistent with prior work, but the paper's headline numbers need to be re-derived transparently before publication.
major comments (4)
- [§4.1, Table 2, Eq. (4)] The reduced magnitudes in Table 2 are not reproducible from Eq. (4) and the tabulated perihelion distances. For 2023: 8.34 − 5log10(1.06×0.693) = 9.01, not 10.24. For 2010: 4.47 − 5log10(1.06×0.695) = 5.13, not 8.92. For 1991: 6.83 − 5log10(0.95×0.719) = 7.66, not 7.28. The 2023 and 2010 values are approximately recovered if one uses the geocentric distance at the stated “Peak Date” (e.g., Δ≈0.39 AU on 2023 Oct 2; Δ≈0.12 AU on 2010 Oct 22) rather than the tabulated perihelion Δ. If that is the intended procedure, the table caption and column headings are wrong, and the 1991/1997 entries must be recomputed and shown. Since Fig. 4 and the ΔG_min = 0.59±0.11 fit are based directly on these four G_min values, the slope and all derived quantities (flux ratio f, active-fraction decline, “no longer hyperactive”) are not supported as printed.
- [§3, Eq. (3), Table 1] The fitted lightcurve parameters are inconsistent with the dataset they are supposed to describe. For 2023, using Table 1 (HG=9.85, k_pre=17.89) in Eq. (3) at the October 2 peak (rh≈1.07, Δ≈0.39) gives m_G ≈ 9.85 + 0.15 − 7.32 ≈ 2.7 mag, which is ~5.6 mag brighter than the tabulated m_G,min = 8.34 and ~4.9 mag brighter than the brightest Table 3 point near that date (7.60). Similar large discrepancies occur for 1991 and 2010 when the perihelion or perigee geometry is used. This suggests a sign error in Eq. (3), a mismatch between the quantity actually fitted (apparent vs. reduced magnitude), or an error in Tables 1–2. The authors need to supply a worked reduction example or fit diagnostics (residuals, fitted curves over data) so the chain from raw magnitudes to G_min and ΔG_min is checkable.
- [§2.1/§4.1] The quantitative slope assumes that the unfiltered 2023 magnitudes (described as “most comparable to the Gaia G filter”) are directly comparable to COBS broadband magnitudes from 1991, 1997, and 2010, with no passband or zero-point correction. A systematic offset of only ~0.2–0.3 mag between apparitions would change ΔG_min by 0.05–0.08 mag/orbit and the derived “order of magnitude” active-fraction decline by a factor of roughly 1.5–2. The formal 1σ error of ±0.11 mag does not include such systematics. I request a sensitivity analysis that shifts the 2023 (or each historical) point by a plausible passband/zero-point range and recomputes the slope, or an explicit anchoring of the 2023 photometry to a common photometric system (e.g., comparison with contemporaneous COBS or narrowband magnitudes on the same nights).
- [§4.2] The active-fraction estimates factive(2017)≈0.7 and factive(2023)≈0.4 are not independent measurements: they are obtained by applying the same fitted slope that is under question, and they also assume factive ∝ flux and constant nucleus size. This is acceptable arithmetic, but should be phrased as a model projection rather than a new observational constraint. The paper's wording (“we can estimate active fractions directly from the measured flux ratios”) is stronger than justified. Please label these as derived from the assumed trend.
minor comments (5)
- [Table 2] The caption says “at perihelion” and gives rh and Δ at perihelion, but the G_min values apparently use peak-date distances. Clarify both in the caption and in the column headers (e.g., “r_h at peak” vs. “Δ at peak”), and state explicitly which distances enter Eq. (4).
- [§3] The phrase “minimum magnitude in each bin” should be “minimum numerical magnitude (i.e., brightest)” to avoid ambiguity; this is standard but should be stated because the paper is aimed at a broad citizen-science audience.
- [§5] In the second bullet, “The minimum reduced magnitude, m_G,min” should be G_min (the symbol m_G,min is used for the apparent minimum magnitude elsewhere). This typo also appears in the Conclusions bullet list.
- [Table 3] Several entries have no reported uncertainty or photometric radius (e.g., many AFA rows). Please indicate whether these were intentionally omitted because errors were not recorded, and give at least a representative description of how the AFA pipeline assigned errors.
- [Eq. (5)] The color transformation from V to G is cited to Jordi et al. (2010), but the equation as written appears to have no unit/zero-point explanation. A one-line sanity check would help: with B−V=0.75, V−R=0.43, the offset is −0.0176 −0.005 −0.074 = −0.097, so G≈V−0.10; confirm this is the intended sign and magnitude for the cited transformation.
Circularity Check
No significant circularity: the fading trend is an empirical fit, and the derived flux-loss, active-fraction, and 2112 extrapolation values are transparent arithmetic on that fit rather than independent predictions.
full rationale
I walked the derivation chain. The 2023 peak reduced magnitude Gmin = 10.24 is obtained from new Unistellar + AFA photometry via the Eq. (3) fit to the bright envelope (Sec. 3), while the 1991, 1997, and 2010 Gmin values come from applying the same equation to COBS data (Sec. 4.1, Tables 1 and 2). The secular slope ΔGmin = 0.59 ± 0.11 is a least-squares fit to these four empirical minima (Sec. 4.2, Fig. 4). The '42% flux loss per orbit' is the identity f = 10^{-0.4ΔGmin}; the 'order-of-magnitude' active-fraction change is (0.58)^5; the factive values are f scaled from the external Lisse et al. (2009) normalization; and the 2112 date is a linear extrapolation of the same fit. None of these is a separate prediction that is fed back into the fit, so there is no fitted-input-called-prediction or self-definitional loop. Previous apparitions rest on the external COBS database, and the 2023 result is checked against COBS and against Schleicher & Bair (2024) narrow-band photometry, providing independent support. The only self-citation (Marchis et al. 2020, for the eVscope platform) is descriptive and not load-bearing for the comet's decline. There is no uniqueness theorem, no ansatz smuggled via self-citation, and no renaming of a known result as new organization. The paper explicitly flags its own limitations (unfiltered passband comparability, radial-symmetry assumption, upper-envelope selection), which are observational systematics, not circular reasoning. I note outside circularity that Table 2's Gmin values do not reproduce from Eq. (4) and the tabulated m_Gmin, r_h, Δ (e.g., 2010 gives 5.13 instead of 8.92; 2023 gives 9.01 instead of 10.24). That is a reproducibility/correctness concern for the fitted slope, not a circularity, and under the hard rules it does not raise the circularity score.
Assumptions & free parameters
free parameters (5)
- HG (lightcurve normalization) =
1991: 7.61±0.15, 1997: 7.83±0.36, 2010: 8.40±0.28, 2023: 9.85±0.47
- kpre, kpost (geometry slopes) =
pre: 25.6, 21.8, 26.7, 17.9; post: 12.7, 6.8, 11.5, 14.7 across 1991, 1997, 2010, 2023
- ΔGmin (per-orbit fading rate) =
0.59 ± 0.11 mag/orbit
- Gmin trend intercept =
not reported explicitly (implied ~7.3 at 1991)
- 9-day bin width =
9 days
assumptions (5)
- domain assumption Coma is radially symmetric for the surface-brightness integration (Eq. 1).
- domain assumption The brightest (minimum-magnitude) points in each bin represent the comet's intrinsic brightness; fainter points are observational artifacts.
- domain assumption Unfiltered eVscope and AFA photometry are on the same magnitude scale as Gaia G and as the historical COBS photometry.
- domain assumption Comet magnitude follows m = HG + 5 log10(rh) + k log10(Δ) (Eq. 3) and reduced magnitude uses G = m - 5 log10(rh Δ) (Eq. 4).
- domain assumption Broadband flux is proportional to active fraction: flux ∝ Q and Q ∝ factive.
Cite this review
Pith. "Pith review of The Ongoing Decline in Activity of Comet 103P/Hartley 2." pith.science (2026). https://pith.science/paper/J3BD6KMI
@misc{pith2026250820215,
  author       = {Pith},
  title        = {Pith review of: The Ongoing Decline in Activity of Comet 103P/Hartley 2},
  year         = {2026},
  howpublished = {\url{https://pith.science/paper/J3BD6KMI}},
  note         = {Machine review of arXiv:2508.20215}
}
abstract
We report photometric observations of Comet 103P/Hartley 2 during its 2023 apparition. Our campaign, conducted from August through December 2023, combined data from a global network of citizen astronomers coordinated by Unistellar and the Association Fran\c{c}aise d'Astronomie. Photometry was derived using an automated pipeline for eVscope observations in partnership with the SETI Institute and aperture photometry via AstroLab Stellar. We find that the comet's peak reduced brightness, measured at $G_{\rm min} = 10.24 \pm 0.47$, continues a long-term fading trend since 1991. The decline in activity follows a per-apparition minimum magnitude increase of $\Delta G_{\rm min} = 0.59 \pm 0.11$ mag, corresponding to an approximately $42\%$ reduction in brightness each return. This trend implies that the comet's active fraction has declined by about an order of magnitude since 1991 and may indicate that Hartley 2 is no longer hyperactive by definition. The fading is consistent with progressive volatile depletion rather than orbital effects. These results offer insight into the evolutionary processes shaping Jupiter-family comets.
Figures


Figures from the paper (1 more)
Reference graph
Works this paper leans on
-
[1]
AF A. 2024, Com` ete Hartley 2, https://web.archive.org/web/20241214183058/https: //www.afastronomie.fr/comete-hartley-2 A’Hearn, M. F., Millis, R. C., Schleicher, D. O., Osip, D. J., & Birch, P. V. 1995, Icarus, 118, 223, doi: 10.1006/icar.1995.1190 A’Hearn, M. F., Belton, M. J. S., Delamere, W. A., et al. 2005, Science, 310, 258, doi: 10.1126/science.11...
-
[2]
Bauer, J. M., Walker, R. G., Mainzer, A. K., et al. 2011, ApJ, 738, 171, doi: 10.1088/0004-637X/738/2/171
-
[3]
Belton, M. J. S., Thomas, P., Li, J.-Y., et al. 2013, Icarus, 222, 595, doi: 10.1016/j.icarus.2012.06.037
-
[4]
1994, Icarus, 108, 265, doi: 10.1006/icar.1994.1061 COBS
Chen, J., & Jewitt, D. 1994, Icarus, 108, 265, doi: 10.1006/icar.1994.1061 COBS. 2024, Comet Observation Database. https://cobs.si
-
[5]
Combi, M. R., Bertaux, J. L., Qu´ emerais, E., Ferron, S., & M¨ akinen, J. T. T. 2011, ApJL, 734, L6, doi: 10.1088/2041-8205/734/1/L6
-
[6]
Combi, M. R., M¨ akinen, T., Bertaux, J. L., et al. 2020, PSJ, 1, 72, doi: 10.3847/PSJ/abb026 Dello Russo, N., Vervack, Jr., R. J., Lisse, C. M., et al. 2011, ApJL, 734, L8, doi: 10.1088/2041-8205/734/1/L8 Di Sisto, R. P., Fern´ andez, J. A., & Brunini, A. 2009, Icarus, 203, 140, doi: 10.1016/j.icarus.2009.05.002 Fern´ andez, J. A., Gallardo, T., & Brunin...
arXiv 2020
-
[7]
F., Fitzsimmons, A., Denneau, L., et al
Gillan, A. F., Fitzsimmons, A., Denneau, L., et al. 2024, PSJ, 5, 25, doi: 10.3847/PSJ/ad1394 15
-
[8]
2004, A&A, 419, 375, doi: 10.1051/0004-6361:20040073
Groussin, O., Lamy, P., Jorda, L., & Toth, I. 2004, A&A, 419, 375, doi: 10.1051/0004-6361:20040073
Show all 41 references
-
[9]
1986, IAUC, 4197, 1
Hartley, M. 1986, IAUC, 4197, 1
1986
-
[10]
2017, Le e-learning informel?: Des apprentissages diffus et discontinus (Google Books)
Heutte, J. 2017, Le e-learning informel?: Des apprentissages diffus et discontinus (Google Books). https://books.google.com/books?hl=en&lr=&id= UJo5DwAAQBAJ&oi=fnd&pg=PA237
2017
-
[11]
2017, A&A, 604, A114, doi: 10.1051/0004-6361/201629910
Hu, X., Shi, X., Sierks, H., et al. 2017, A&A, 604, A114, doi: 10.1051/0004-6361/201629910
2017 doi
-
[12]
2022, AJ, 164, 158, doi: 10.3847/1538-3881/ac886d
Jewitt, D. 2022, AJ, 164, 158, doi: 10.3847/1538-3881/ac886d
2022 doi
-
[13]
Jewitt, D. C. 2004, in Comets II, ed. M. C. Festou, H. U. Keller, & H. A. Weaver, 659
2004
-
[14]
M., et al
Jordi, C., Gebran, M., Carrasco, J. M., et al. 2010, A&A, 523, A48, doi: 10.1051/0004-6361/201015441
2010 doi
-
[15]
U., Mottola, S., Hviid, S
Keller, H. U., Mottola, S., Hviid, S. F., et al. 2017, MNRAS, 469, S357, doi: 10.1093/mnras/stx1726
2017 doi
-
[16]
S., Lindler, D
Kelley, M. S., Lindler, D. J., Bodewits, D., et al. 2013, Icarus, 222, 634, doi: 10.1016/j.icarus.2012.09.037
2013 doi
-
[17]
Schleicher, D. G. 2015, AJ, 150, 22, doi: 10.1088/0004-6256/150/1/22
2015 doi
-
[18]
M., & Schleicher, D
Knight, M. M., & Schleicher, D. G. 2011, AJ, 141, 183, doi: 10.1088/0004-6256/141/6/183 —. 2013, Icarus, 222, 691, doi: 10.1016/j.icarus.2012.06.004
2011 doi
-
[19]
M., Schleicher, D
Knight, M. M., Schleicher, D. G., & Farnham, T. L. 2021, PSJ, 2, 104, doi: 10.3847/PSJ/abef6c
2021 doi
-
[20]
2025, Research Notes of the American Astronomical Society, 9, 68, doi: 10.3847/2515-5172/adc4e7
Lehmann, T. 2025, Research Notes of the American Astronomical Society, 9, 68, doi: 10.3847/2515-5172/adc4e7
2025 doi
-
[21]
F., & Duncan, M
Levison, H. F., & Duncan, M. J. 1997, Icarus, 127, 13, doi: 10.1006/icar.1996.5637
1997
-
[22]
F., et al
Li, J.-Y., Besse, S., A’Hearn, M. F., et al. 2013, Icarus, 222, 559, doi: 10.1016/j.icarus.2012.11.001
2013 doi
-
[23]
M., Fernandez, Y
Lisse, C. M., Fernandez, Y. R., Reach, W. T., et al. 2009, PASP, 121, 968, doi: 10.1086/605546
2009 doi
-
[24]
2020, Acta Astronautica, 166, 23, doi: 10.1016/j.actaastro.2019.09.028
Arbouch, E. 2020, Acta Astronautica, 166, 23, doi: 10.1016/j.actaastro.2019.09.028
2020 doi
-
[25]
J., Kelley, M
Meech, K. J., Kelley, M. S., A’Hearn, M. F., & DIXI Observing Team. 2011, in American Astronomical Society Meeting Abstracts, Vol. 217, American Astronomical Society Meeting Abstracts #217, 306.07
2011
-
[26]
J., Bonev, B
Mumma, M. J., Bonev, B. P., Villanueva, G. L., et al. 2011, ApJL, 734, L7, doi: 10.1088/2041-8205/734/1/L7
2011 doi
-
[27]
Rahe, J., Vanysek, V., & Weissman, P. R. 1994, in Hazards Due to Comets and Asteroids, ed. T. Gehrels, M. S. Matthews, & A. M. Schumann, 597
1994
-
[28]
Sykes, M. V. 2009, Icarus, 203, 571, doi: 10.1016/j.icarus.2009.05.027
2009 doi
-
[29]
A., & Gustafson, B
Rickman, H., Fernandez, J. A., & Gustafson, B. A. S. 1990, A&A, 237, 524
1990
-
[30]
L., & Gersch, A
Farnham, T. L., & Gersch, A. 2011, ApJL, 734, L3, doi: 10.1088/2041-8205/734/1/L3
2011 doi
-
[31]
2024, 56, 314.06
Schleicher, D., & Bair, A. 2024, 56, 314.06
2024
-
[32]
Schleicher, D. G. 2007, Icarus, 190, 406, doi: 10.1016/j. icarus.2007.04.01310.1016/j.icarus.2007.04.039
2007 arXiv
-
[33]
V., Galad, A., Bohnhardt, H., et al
Scotti, J. V., Galad, A., Bohnhardt, H., et al. 1996, IAUC, 6301, 1 The Schools’ Observatory. 2024, AstroLab Stellar: Photometric Analysis for Citizen Astronomers. https://schoolsobservatory.org
1996
-
[34]
C., A’Hearn, M
Thomas, P. C., A’Hearn, M. F., Veverka, J., et al. 2013, Icarus, 222, 550, doi: 10.1016/j.icarus.2012.05.034
2013 doi
-
[35]
A., Feldman, P
Weaver, H. A., Feldman, P. D., McPhate, J. B., et al. 1994, ApJ, 422, 374, doi: 10.1086/173732
1994 doi
-
[36]
A., Lisse, C
Weaver, H. A., Lisse, C. M., Mutchler, M. J., et al. 2006, in AAS/Division for Planetary Sciences Meeting Abstracts, Vol. 38, AAS/Division for Planetary Sciences Meeting Abstracts #38, 06.02
2006
-
[37]
1989, in Asteroids II, ed
Rickman, H. 1989, in Asteroids II, ed. R. P. Binzel, T. Gehrels, & M. S. Matthews, 880–920
1989
-
[38]
2006, Icarus, 183, 101, doi: 10.1016/j.icarus.2006.02.016
Whitman, K., Morbidelli, A., & Jedicke, R. 2006, Icarus, 183, 101, doi: 10.1016/j.icarus.2006.02.016
2006 doi
-
[39]
Ye, Q., Kelley, M. S. P., Bauer, J. M., et al. 2023, PSJ, 4, 47, doi: 10.3847/PSJ/acbfbb
2023 doi
-
[40]
G., & Wiegert, P
Ye, Q.-Z., Brown, P. G., & Wiegert, P. A. 2016a, ApJL, 818, L29, doi: 10.3847/2041-8205/818/2/L29
-
[41]
G., et al
Ye, Q.-Z., Hui, M.-T., Brown, P. G., et al. 2016b, Icarus, 264, 48, doi: 10.1016/j.icarus.2015.09.003
2015 doi
Reviewed August 5, 2026 · model on record in the stance chip above.
Discussion (0). Continue with ORCID to comment.