REVIEW 4 major objections 5 minor 20 references
Data Curation Matters: Model Collapse and Spurious Shift Performance Prediction from Training on Uncurated Text Embeddings
T0 review · 4 major / 5 minor · reviewed 2026-08-06 · deepseek-v4-flash
Pith's one-line read Training tabular classifiers on uncurated text embeddings can silently collapse them into single-class prediction, and the collapse manufactures a spurious Accuracy-on-the-Line correlation that falsely reads as OOD predictability.
desk verdict A real and easily reproduced failure mode for LLM-embedding tabular pipelines, with the caveat that the headline prevalence number depends on hyperparameter grids inherited from raw-tabular training. read the letter →
The pith
A machine-rendered reading of the paper's core claim, the machinery that carries it, and where it could break.
The reading
What carries the argument
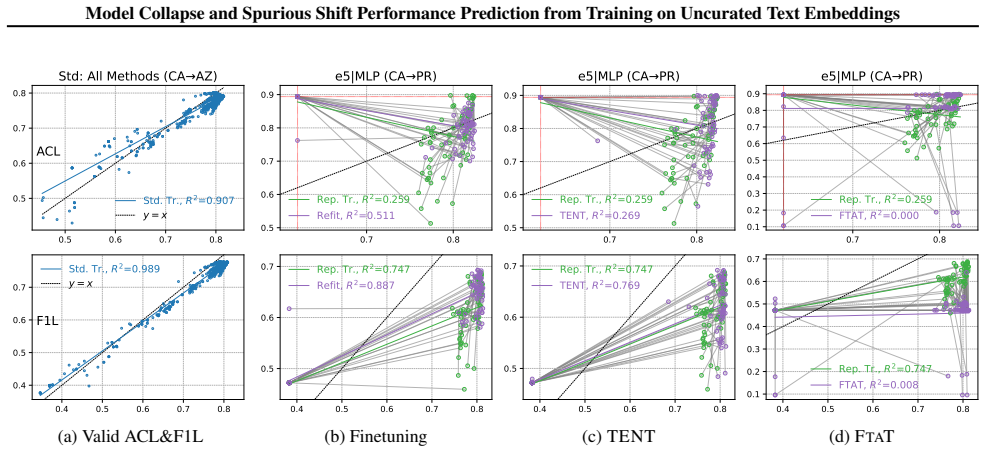
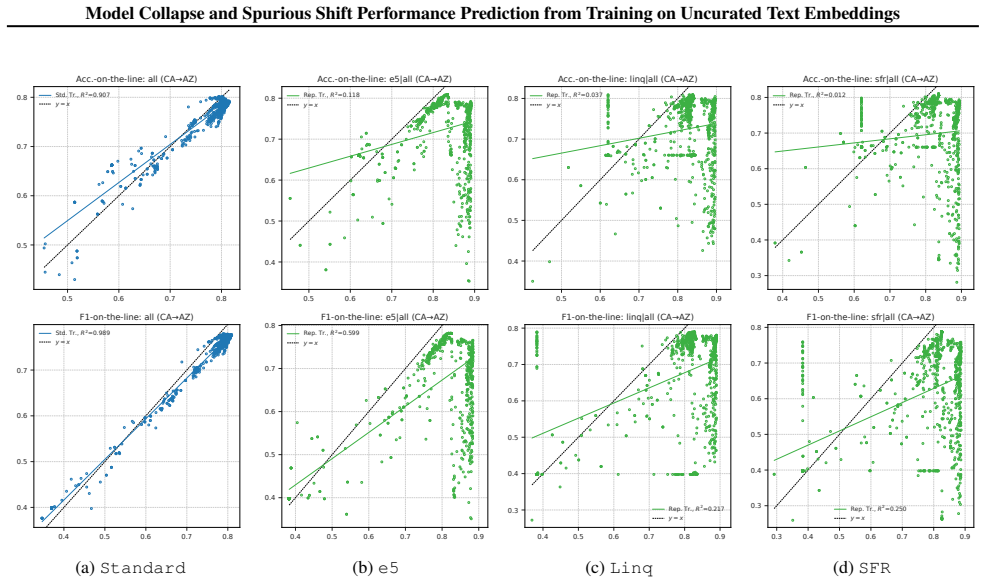
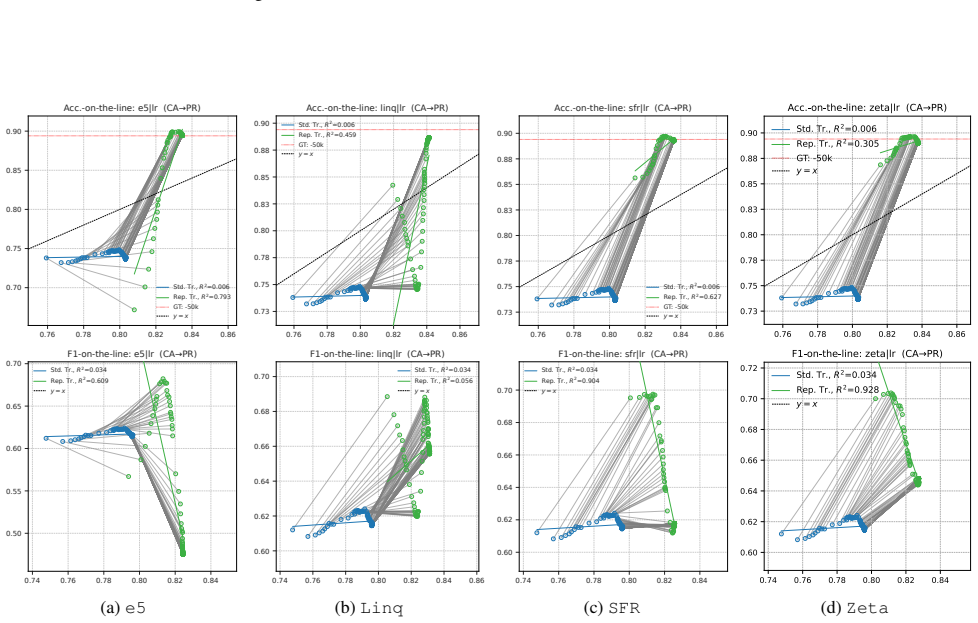
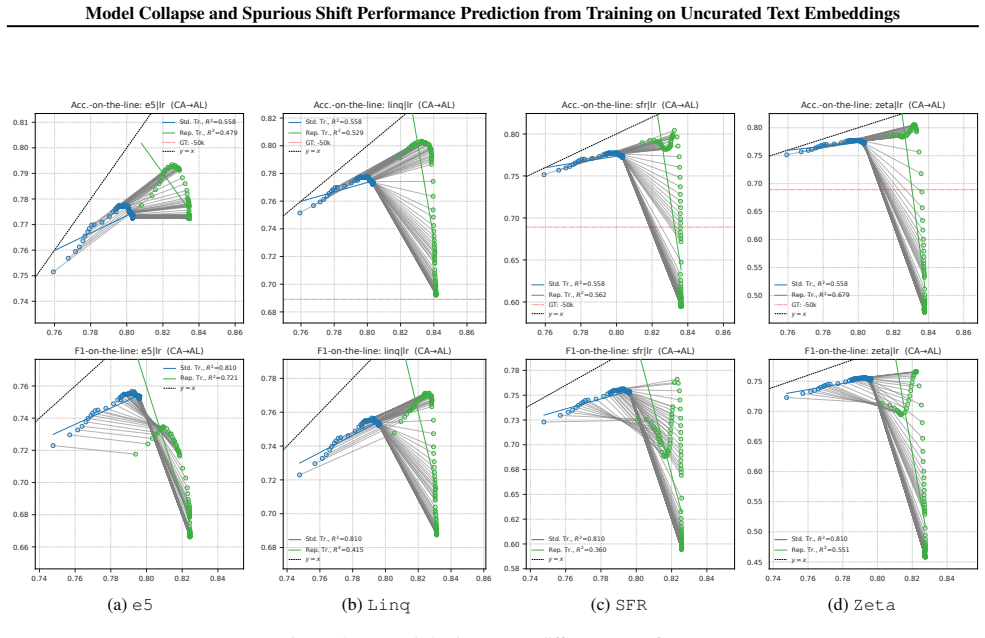
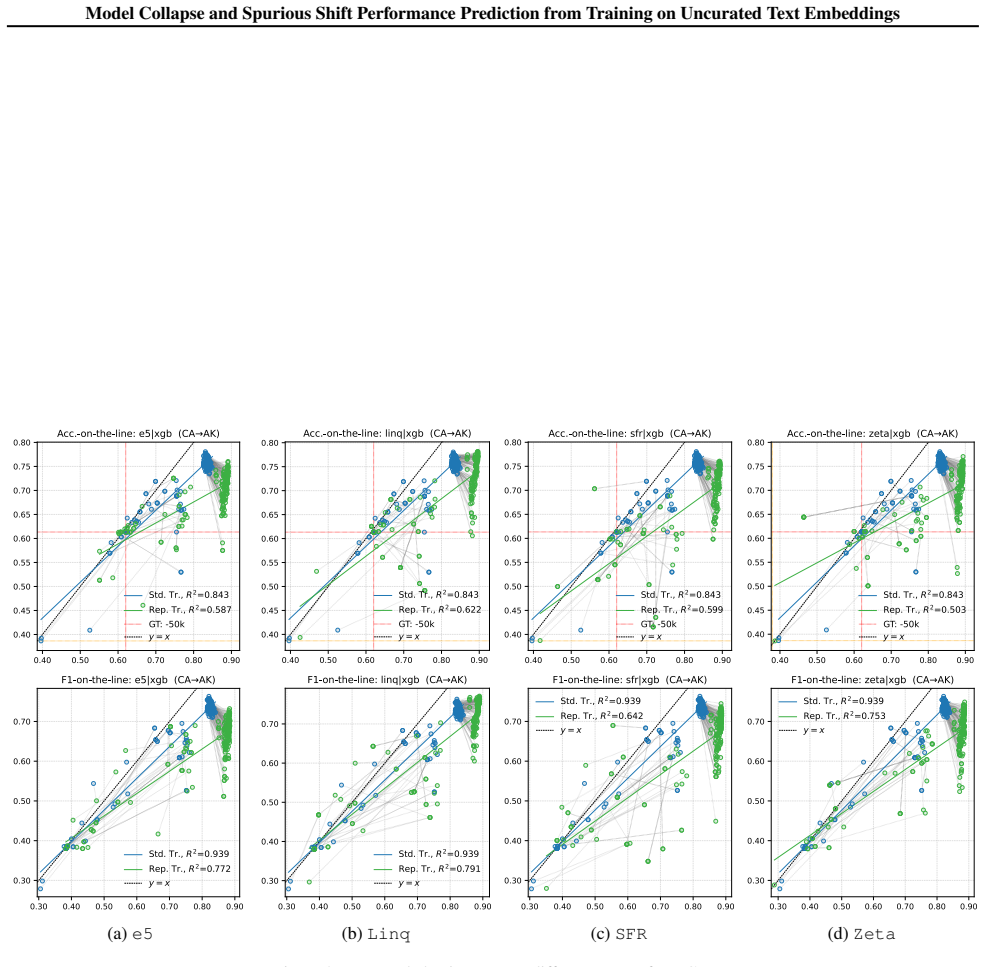
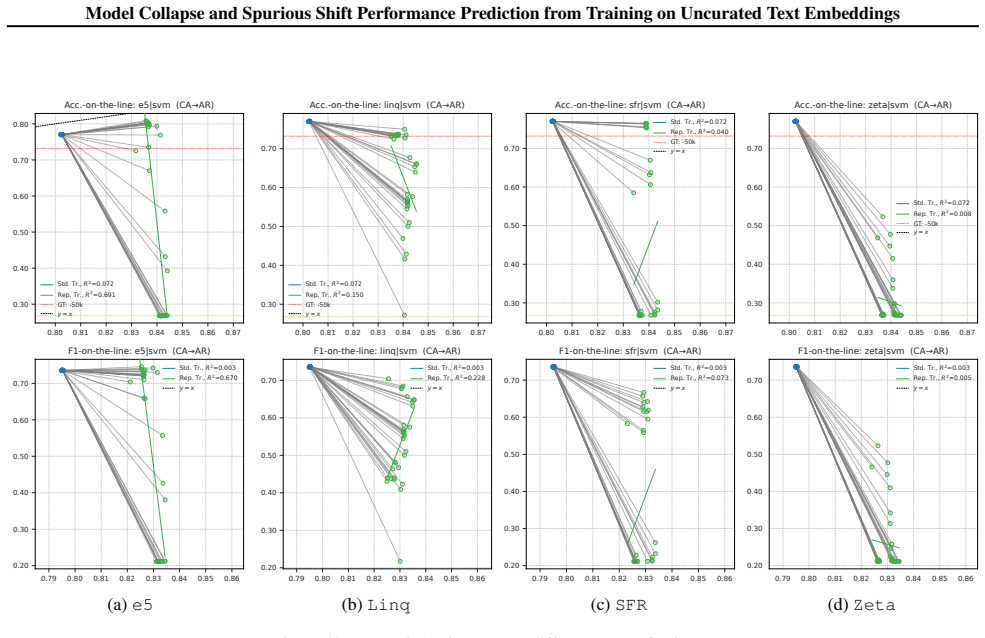
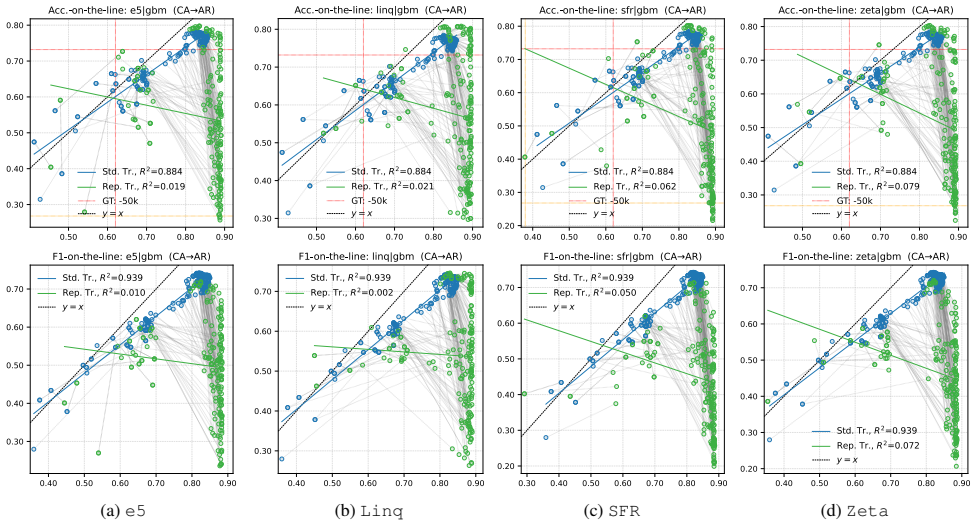
The central instrument is the bound-pair on-the-line plane. For each hyperparameter configuration $c$, the authors train one model on raw tabular data and a twin model on the LLM embeddings of the same rows, then plot both in the plane whose axes are in-distribution and out-of-distribution scores, binding each pair with a straight segment. Collapse is defined by counting predictions: a model is collapsed on a test set if it predicts only one class, and near-collapsed if its true-negative plus false-negative rates fall below a threshold $\varepsilon$. The collapse ratio $\mathrm{CR}^{S}_{HP}$ is the fraction of configurations in a hyperparameter set (chosen non-collapsing on raw tabular data) that become single-class predictors when trained on embeddings; the strong-collapse ratio $\mathrm{CR}_s$ and projection ratio $\mathrm{CR}_p$ count configurations collapsing on both test sets or on at least one. These ratios expose a spurious Accuracy-on-the-Line: when many embedding-trained models stack on the class-ratio point, the fitted $R^2$ rises while the non-collapsed remainder shows no linear trend.
What would settle it
Retrain every collapsing configuration on the same embeddings using a hyperparameter grid designed for high-dimensional inputs, such as lower learning rates, stronger regularization, weight decay, or embeddings projected to a matched dimension, and recompute the collapse ratios. If $\mathrm{CR}_s$ falls to near zero across all four encoders, the reported collapse is a grid-mismatch artifact rather than a property of text embeddings. A second check is to run the identical bound-pair analysis on random Gaussian features of dimension 4096; if those collapse at comparable rates, the failure is about dimensionality and optimization, not about the semantic content of embeddings.
Extended reading notes
Core claim
The central discovery is that model collapse is a characteristic failure mode of training on uncurated text embeddings, and that this collapse contaminates the standard diagnostic used to claim out-of-distribution predictability. When a hyperparameter configuration that produces a functioning classifier on raw tabular data is reused on LLM-embedded rows, the resulting model frequently predicts one class regardless of input, so its in-distribution and out-of-distribution accuracies both sit at the test set's positive-class ratio. Many such collapsed points overlap in the Accuracy-on-the-Line plane, mechanically raising the $R^2$ of the linear fit even though the surviving models follow no discernible line; the paper exhibits a case where collapsed models yield $R^2 \approx 0.38$ on accuracy and $0.87$ on macro-F1 while the non-collapsed points are scattered. The authors conclude that Accuracy-on-the-Line, and OOD performance prediction built on it, is only meaningful when collapse is measured and excluded, and they frame the collapse ratio as the diagnostic that should accompany any such claim.
Load-bearing premise
The load-bearing premise is that the hyperparameter configurations chosen for raw tabular models are a fair test of the embedding-based pipeline; if those same settings are simply a poor match for 4096-dimensional inputs, the observed single-class predictions could be an artifact of the grid rather than a property of uncurated text embeddings.
Editorial extensions
If this is right
- Every reported Accuracy-on-the-Line $R^2$ for an embedding-trained model should be read alongside a collapse ratio; a high $R^2$ with a high strong-collapse ratio is evidence of degeneracy, not of transfer.
- Pipelines that predict out-of-distribution accuracy from in-distribution accuracy should reject the prediction whenever models already collapse on the source domain, which the paper shows happens with text embeddings.
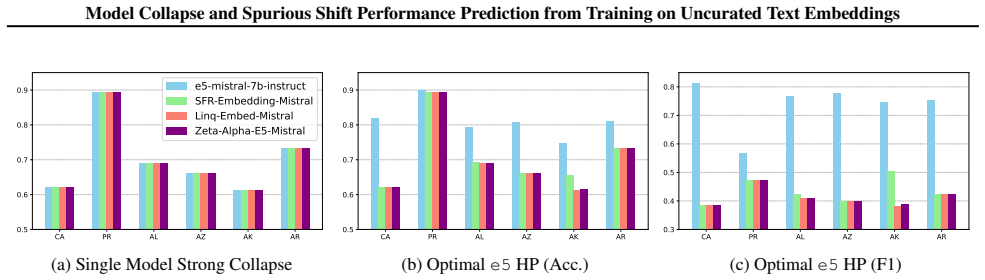
- Embedding leaderboard rankings are not a proxy for data-curation quality under tabular shift, since the lowest-ranked of the four encoders tested was the most robust on this task.
- Using a different encoder at test time than at training time is itself a distribution shift that provokes collapse, even for configurations that behave well on embeddings from the training encoder.
- Test-time adaptation methods, including entropy minimization and a tabular-specific variant, do not restore a valid on-the-line relation for embedding-trained models.
Reading between the lines
- A testable extension: check whether the collapse ratio tracks the intrinsic dimension or spectral structure of the embedding space; if it does, the metric becomes a cheap, OOD-label-free way to pick between embedding models.
- The same bound-pair collapse analysis could be applied to vision or audio features; if single-class collapse appears there too, the phenomenon is a general property of training on high-dimensional pretrained representations rather than something specific to text.
- The near-collapse threshold $\varepsilon$ is chosen per experiment after the fact; a fixed, pre-registered threshold would make the collapse ratios usable as a transferable benchmark metric, as the paper's appendix leaves that choice open.
- The spurious-ACL mechanism implies an audit rule for earlier work: any accuracy-on-the-line claim computed over a set where several models sit exactly at the class-ratio point deserves discounting, because those points raise $R^2$ by geometry rather than by semantics.
Editorial analysis
A structured set of objections, weighed in public.
Referee Report
Summary. The paper studies binary tabular classification from the ACS Income dataset, comparing models trained on raw tabular features with models trained on 4096-dimensional text embeddings produced by four off-the-shelf LLMs under identical hyperparameter configurations. It defines collapse metrics based on the fraction of configurations that yield single-class predictors, reports that such collapse is common in embedding-trained models, and argues that strong collapse can artificially inflate Accuracy-on-the-Line (ACL) R² values, producing a misleading signal of OOD predictability. It also compares MTEB rankings with downstream OOD performance and studies cross-LLM embedding transfer. The experiments cover seven model families, four encoders, and five target states, with additional test-time adaptation results.
Significance. If the central empirical claim is confirmed, the paper identifies a practically important failure mode: using general-purpose text embeddings as a data-curation layer for tabular data can produce degenerate single-class predictors, and the resulting ACL correlations are not trustworthy evidence of OOD generalization. The proposed collapse metrics are simple, interpretable, and potentially reusable, and the paper is honest that the study is an 'initial investigation' and 'far from being comprehensive' (Section 4, Conclusion). However, the evidence currently rests on one binary dataset, a single training state, one run per configuration, and hyperparameter grids inherited from raw-tabular pipelines; these limitations are load-bearing for the generality of the abstract's claims. The paper would be strengthened by a formal link between collapse ratios and R² inflation, by an embedding-adapted hyperparameter control, and by additional datasets or seeds.
major comments (4)
- [Section 4.1, Table 6] The central comparison assumes that the hyperparameter grids designed for raw tabular models are a fair baseline for 4096-dimensional embeddings. The grids in Table 6 come from low-dimensional tabular pipelines (e.g., MLP hidden sizes 16-128, LR regularization on the raw feature scale), with no feature normalization or dimension-aware regularization for the embedding space. Under such a mismatch, trivial majority-class convergence is expected. This concern is not hypothetical: Section 4.2 shows that the single configuration c2, tuned on e5 embeddings, avoids collapse on all e5-encoded states but collapses when transferred to other LLMs' embeddings, demonstrating extreme sensitivity to the HP-input match. To support the claim that uncurated text embeddings inherently induce collapse, the authors should run a control with an embedding-adapted search (e.g., standardized embeddings, larger capacity, dimension-aware regularization) and report the resulting collapse ratios; if those ratios are near zero, the main claim is not established.
- [Section 4.1, 'Strong Model collapse induces spurious ACL'] The claim that strong collapse induces spurious ACL is supported by visual inspection of Figure 2b rather than by a formal comparison. The paper states that the R² of the green points is 'significantly higher' and attributes this to overlapping collapsed points, but it does not quantify the effect. Please compute R² on the non-collapsed subset of configurations, or report the difference between R² with and without collapsed points across all LLM/model/state combinations, and relate that difference to the collapse ratios. Without such a test, the warning about spurious ACL remains an illustrative observation rather than an established property.
- [Section 4.1, Section 3.4] The collapse metrics are defined only for 'well-defined' hyperparameter sets, i.e., sets that do not collapse on raw tabular data. However, Table 6 marks XGB and RF as not well-defined, and Section 4.1 still reports collapse patterns and ratios for these families (including the RF discussion and Figure 13). This is an internal inconsistency in the metric-based evidence. Either restrict the collapse-ratio analysis to the well-defined subsets for XGB and RF, or formally extend the definitions to cover non-well-defined baseline sets and state the implications for interpretation.
- [Section 4.1, Experimental setup] The abstract and Section 4.1 claim that collapse is a 'consistent failure mode' across LLM-embedding training, but the evidence is from a single binary dataset (ACS Income), a single training state (CA), a single LLM per embedding modality, and one run per configuration with no error bars. The paper's own wording concedes an 'initial investigation' and prioritizes 'qualitative insights,' which is appropriate for a workshop-scale study but not sufficient for the generality claimed in the abstract. At minimum, add a second tabular dataset and a small number of seeds to quantify variance, or revise the claims to be explicitly scoped to the ACS Income setup.
minor comments (5)
- [Section 3.2] Typo: 'pics' should be 'picks' in the sentence 'Our method pics a set of training Hyper-Parameter Configurations'.
- [Section 3.4] Typo: 'de ratio of configurations' should be 'the ratio of configurations'.
- [Appendix A.2] The near-collapse threshold epsilon is stated to 'vary from one experiment to the next' and is chosen 'with consideration to the overall shape' of the scatter. Since epsilon is a free parameter, please report sensitivity of the near-collapse ratios to epsilon or fix a single value across all experiments and justify it.
- [Table 6] For methods with grids larger than 200, the paper says 200 configurations are randomly sampled, but no random seed is reported; the stability of the collapse ratios under this sampling should be discussed.
- [Section 3.3] The sentence 'one should not be overlooked the fact that...' is grammatically awkward and should be rephrased for clarity.
Circularity Check
No significant circularity: the study is an empirical measurement using explicitly defined descriptive metrics, and no prediction reduces to its inputs by construction.
full rationale
The paper's central claims are empirical findings, not derivations. The collapse metrics in Section 3.4 are definitional ratios (e.g., CR_S_HP = 1/|HP| sum of indicator functions over strict single-class predictions), and the reported ACL R2 values are computed directly from measured ID/OOD accuracy coordinates. No fitted parameter is later renamed as a prediction, and no stated result is equivalent to an input by construction. The comparison with raw tabular models uses shared hyperparameter configurations as a controlled baseline; any concern that those grids are poorly matched to 4096-dimensional embeddings is a validity or correctness threat, not a circularity, because the paper does not claim to derive collapse from the grids and does not fit anything to force the collapse counts. The only experimenter-chosen quantity is the near-collapse epsilon, and the paper explicitly acknowledges that 'The value of ε varies from one experiment to the next' (Appendix A.2), while also reporting strict collapse counts that do not depend on epsilon. Citations to Zeng et al. (2024) supply the embedding procedure, hyperparameter grids, and the reference optimal MLP configuration; these are external prior works with no author overlap with the present paper, so they are independent evidence rather than self-citation. The paper also explicitly frames itself as an initial investigation 'picked to exemplify our findings rather than to propose exhaustive numerical experiments,' which is an acknowledged scope limitation, not circular reasoning. Overall, the manuscript is self-contained as an empirical study against external data and benchmarks, so no circular step is present.
Assumptions & free parameters
free parameters (1)
- epsilon (near-collapse threshold) =
0.1 (varies per experiment)
assumptions (3)
- domain assumption The embedding and serialization pipeline of Zeng et al. (2024) is correctly re-implemented and its hyperparameter grids are appropriate for both modalities.
- standard math Macro F1 over the two classes is a suitable companion metric to accuracy for imbalanced binary shifts.
- ad hoc to paper The 'well-defined' HP sets (configs that do not collapse on raw tabular data) are a fair reference set for measuring embedding-induced collapse.
Cite this review
Pith. "Pith review of Data Curation Matters: Model Collapse and Spurious Shift Performance Prediction from Training on Uncurated Text Embeddings." pith.science (2026). https://pith.science/paper/JAQKJF4G
@misc{pith2026250617989,
  author       = {Pith},
  title        = {Pith review of: Data Curation Matters: Model Collapse and Spurious Shift Performance Prediction from Training on Uncurated Text Embeddings},
  year         = {2026},
  howpublished = {\url{https://pith.science/paper/JAQKJF4G}},
  note         = {Machine review of arXiv:2506.17989}
}
read the original abstract
Training models on uncurated Text Embeddings (TEs) derived from raw tabular data can lead to a severe failure mode known as model collapse, where predictions converge to a single class regardless of input. By comparing models trained with identical hyper-parameter configurations on both raw tabular data and their TE-derived counterparts, we find that collapse is a consistent failure mode in the latter setting. We introduce a set of metrics that capture the extent of model collapse, offering a new perspective on TE quality as a proxy for data curation. Our results reveal that TE alone does not effectively function as a curation layer - and that their quality significantly influences downstream learning. More insidiously, we observe that the presence of model collapse can yield artificially inflated and spurious Accuracy-on-the-Line correlation. These findings highlight the need for more nuanced curation and evaluation of embedding-based representations, particularly in out-of-distribution settings.
Figures


Figures from the paper (40 more)












Reference graph
Works this paper leans on
-
[1]
Alvarez-Melis, D. and Fusi, N. Robustness and Gen- eralization via Algorithmic Stability.arXiv preprint arXiv:2002.08791,
arXiv 2002
-
[6]
Sets of shared hyper-parameter combinations used in all experiments.⋄for methods with the total grid size above 200, we randomly sample 200 configurations for fair comparisons. The column ”Well-defined” refers to empirical observation that the corresponding HP sets do not collapse for the tabular modality in our setting. Model # of HPs Well-Defined Hyperp...
work page 1944
-
[7]
Mitigating Modality Collapse via Explicit Basis Reallocation.arXiv preprint arXiv:2505.22483,
Chaudhuri, S., Yang, Y ., Yan, J., Khan, S., Shah, M., and Liu, Z. Mitigating Modality Collapse via Explicit Basis Reallocation.arXiv preprint arXiv:2505.22483,
-
[9]
Strong Model Collapse from Weak Synthetic Data.arXiv preprint arXiv:2410.04840,
Dohmatob, E., Tarres, P., and Thomas, V . Strong Model Collapse from Weak Synthetic Data.arXiv preprint arXiv:2410.04840,
-
[10]
Collision Avoidance Detour for Multi-Agent Trajectory Forecasting
Gardner, J., Popovic, M., and Schmidt, M. TableShift: Quantifying Distribution Shift in Tabular Data.arXiv preprint arXiv:2306.11638,
-
[13]
Koyama, M. and Yamaguchi, S. When Is Invariance Use- ful In An Out-Of-Distribution Generalization Problem? arXiv preprint arXiv:2008.01883,
arXiv 2008
-
[14]
MTEB: Massive Text Embedding Benchmark
Muennighoff, N., Tazi, N., Magne, L., and Reimers, N. MTEB: Massive Text Embedding Benchmark. InPro- ceedings of the 17th Conference of the European Chap- ter of the Association for Computational Linguistics, pp. 2014–2037,
work page 2014
-
[15]
Slack, D. and Singh, S. Tablet: Learning from Instructions for Tabular Data.arXiv preprint arXiv:2304.13188,
Show all 20 references
-
[16]
Improving Text Embeddings with Large Language Models.arXiv preprint arXiv:2401.00368,
Wang, L., Yang, N., Huang, X., Yang, L., Majumder, R., and Wei, F. Improving Text Embeddings with Large Language Models.arXiv preprint arXiv:2401.00368,
-
[17]
LLM Em- beddings Improve Test-time Adaptation to TabularY|X - Shifts
11 Model Collapse and Spurious Shift Performance Prediction from Training on Uncurated Text Embeddings Zeng, Y ., Liu, J., Lam, H., and Namkoong, H. LLM Em- beddings Improve Test-time Adaptation to TabularY|X - Shifts. InNeurIPS 2024 Third Table Representation Learning Workshop,
2024
-
[19]
and (Zeng et al., 2024). Table
2024
-
[2013]
Tab- transformer: Tabular Data Modeling Using Contextual Embeddings.arXiv preprint arXiv:2012.06678,
Huang, X., Khetan, A., Cvitkovic, M., and Karnin, Z. Tab- transformer: Tabular Data Modeling Using Contextual Embeddings.arXiv preprint arXiv:2012.06678,
2012 arXiv
-
[2016]
Linq-Embed-Mistral Technical Report.arXiv preprint arXiv:2412.03223,
Choi, C., Kim, J., Lee, S., Kwon, J., Gu, S., Kim, Y ., Cho, M., and yong Sohn, J. Linq-Embed-Mistral Technical Report.arXiv preprint arXiv:2412.03223,
-
[2017]
Baek, C., Jiang, Y ., Raghunathan, A., and Kolter, J. Z. Agreement-on-the-Line: Predicting the Performance of Neural Networks under Distribution Shift.arXiv preprint arXiv:2206.13089,
-
[2019]
Unifying Dis- tributionally Robust Optimization via Optimal Transport Theory.arXiv preprint arXiv:2308.05414,
Blanchet, J., Kuhn, D., Li, J., and Taskesen, B. Unifying Dis- tributionally Robust Optimization via Optimal Transport Theory.arXiv preprint arXiv:2308.05414,
-
[2021]
Invariant Risk Minimization.arXiv preprint arXiv:1907.02893,
Arjovsky, M., Bottou, L., Gulrajani, I., and Lopez-Paz, D. Invariant Risk Minimization.arXiv preprint arXiv:1907.02893,
1907 arXiv
-
[2022]
J., Bouchacourt, D., and Sagun, L
Bell, S. J., Bouchacourt, D., and Sagun, L. Reassessing the Validity of Spurious Correlations Benchmarks.arXiv preprint arXiv:2409.04188,
-
[2023]
T., Namkoong, H., and Yadlowsky, S
Cai, T. T., Namkoong, H., and Yadlowsky, S. Diagnos- ing Model Performance Under Distribution Shift.arXiv preprint arXiv:2303.02011,
-
[2024]
doi: 10.1038/s41586-024-07566-y. Hu, Z. and Hong, L. J. Kullback-Leibler Divergence Con- strained Distributionally Robust Optimization.Optimiza- tion Online, 1(2):9,
-
[2025]
ToEdit: Token-Level Editing Prevents Non-Iterative Model Collapse on Synthetic Data.arXiv preprint arXiv:2412.14689,
Zhu, P., Dai, X., Yao, Z., Dou, D., and Yang, D. ToEdit: Token-Level Editing Prevents Non-Iterative Model Collapse on Synthetic Data.arXiv preprint arXiv:2412.14689,
Reviewed August 6, 2026 · model on record in the stance chip above.
Discussion (0). Sign in to comment.