REVIEW 3 major objections 5 minor 39 references
Disentangling Linguistic Features with Dimension-Wise Analysis of Vector Embeddings
T0 review · 3 major / 5 minor · reviewed 2026-08-16 · deepseek-v4-flash
Pith's one-line read This paper claims that a weighted score combining Wilcoxon p-values, mutual information, and recursive feature elimination ranks BERT embedding dimensions so that most linguistic properties reach near-full classifier accuracy with fewer…
desk verdict Useful dataset and composite metric, but the key results for negation and factuality are confounded by mean pooling over unequal-length pairs, and the control p-values point to a likely Wilcoxon bug. read the letter →
The pith
A machine-rendered reading of the paper's core claim, the machinery that carries it, and where it could break.
The reading
What carries the argument
The load-bearing object is the Embedding Dimension Importance (EDI) score, defined for each dimension $d$ and linguistic property $lp$ as $EDI_{d,lp}=0.6(-\log p_{d,lp})+0.2\,M_{d,lp}+0.2\,R_{d,lp}$, where $p$ is the signed-rank p-value over paired sentence embeddings, $M$ is the mutual information between the quantile-binned dimension and the sentence-position label, and $R$ is the absolute logistic-regression weight after recursive feature elimination, set to zero if the dimension is eliminated. The score ranks all dimensions per property, and the evaluation trains logistic classifiers on the top-ranked or bottom-ranked slices to test whether EDI actually separates informative coordinates from uninformative ones. The second load-bearing object is the LDSP-10 dataset: one thousand sentence pairs per property constructed so that each pair differs in exactly one linguistic feature, which is what makes dimension-wise attribution possible. Sentence embeddings are produced by mean-pooling the final hidden layer over tokens.
What would settle it
Construct control sentence pairs identical in structure but with a neutral word of the same length inserted in place of the property word, then compute EDI scores for those controls; if the top-scoring dimensions for the real pairs and the filler pairs largely coincide, the localization finding is an artifact of length rather than of the linguistic property.
Extended reading notes
Core claim
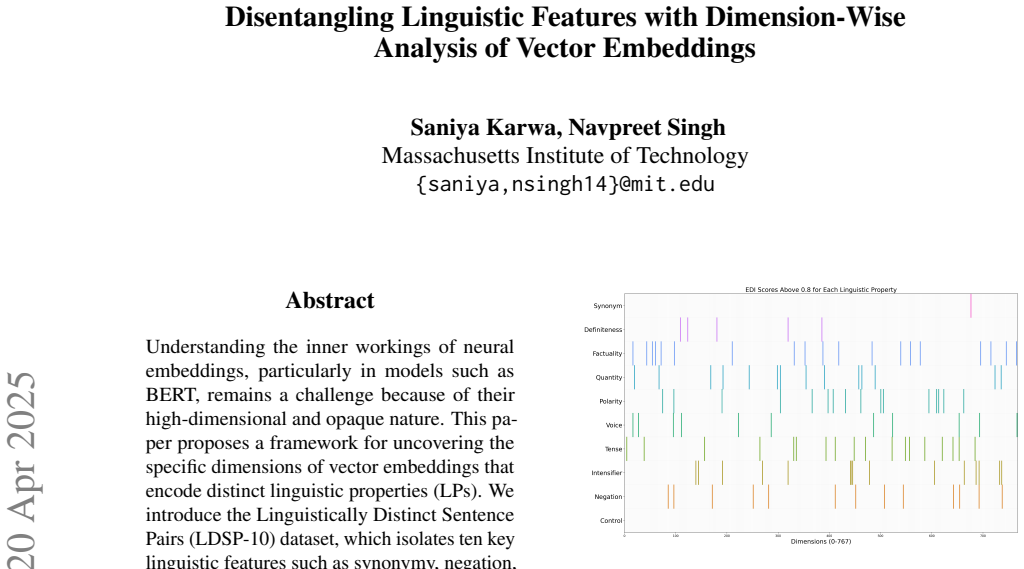
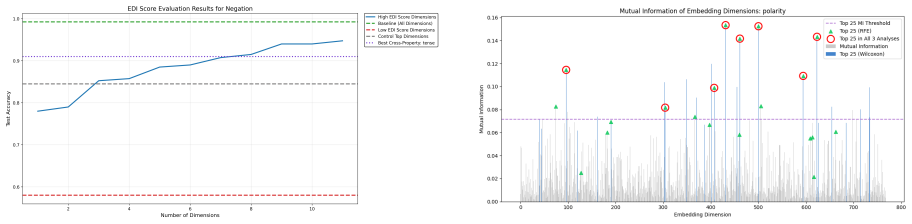
The paper's central discovery is that the 768-dimensional embedding space is not uniformly opaque: coordinates can be ranked by how much they encode a given linguistic property, and the ranking predicts classifier behavior. For negation, dimension 544 of BERT's mean-pooled final layer reaches an EDI score of 0.9987, and a logistic classifier using the top 11 dimensions recovers 95% of the accuracy of the full-dimensional baseline. Polarity shows a similar pattern, with dimension 431 scoring 0.9947. Synonymy behaves differently: its maximum EDI score is 0.8751 with a steep drop-off, and 392 top-ranked dimensions are needed to reach the same 95% threshold. The paper reads this contrast as evidence that linguistic properties are encoded heterogeneously, with some features concentrated in focal dimensions and others spread across the representation.
Load-bearing premise
The claim depends on the assumption that when a sentence pair differs by adding a word such as 'not' or 'surprisingly', the shift in the averaged word-vector representation is caused by the linguistic property itself and not merely by the sentence being longer or the inserted word's position.
Editorial extensions
If this is right
- A logistic classifier built on fewer than twelve top EDI dimensions reaches at least 95% of full-embedding accuracy for most of the ten properties, so property classification can be run on a small coordinate subset.
- The 100 lowest-ranked dimensions perform near chance for every property, indicating those coordinates contribute little property-specific signal and are candidates for pruning or masking.
- Negation and polarity are the most localized properties: each has a single dimension with EDI near 1.0 and broad agreement among the three statistical tests.
- Synonymy is the most distributed property, requiring 392 top-ranked dimensions to hit the 95% threshold, so word-substitution equivalence is not pinned to a few coordinates.
- Cross-property transfer is partial and semantically structured: negation's top dimensions give the strongest transfer to polarity, while unrelated properties transfer poorly.
Reading between the lines
- Editorial inference: because insertion-based properties (negation, intensifier, factuality) change sentence length before mean pooling, control pairs that insert a neutral word of the same length would reveal whether the top EDI dimensions are encoding the property or merely the length shift.
- Editorial inference: the EDI ranking could double as an intervention map: if mean-ablating high-EDI dimensions removes property-specific accuracy in a downstream task, the score would identify coordinates worth editing rather than just worth reading.
- Editorial inference: applying the same minimal-pair construction to demographic contrasts (for example, gender-marked names or role nouns) could turn the framework into a bias-localization tool, although the paper only floats this as future work.
Signed reviews
Editorial analysis
A structured set of objections, weighed in public.
Referee Report
Summary. The paper introduces the LDSP-10 dataset, which consists of 1,000 sentence pairs per linguistic property (control, synonym, quantity, tense, intensifier, voice, definiteness, factuality, polarity, negation), and proposes the Embedding Dimension Impact (EDI) score that combines a Wilcoxon signed-rank p-value, mutual information, and logistic-regression RFE weights to rank embedding dimensions by their relevance to each property. The evaluation trains logistic classifiers on top-EDI, low-EDI, and cross-property dimension subsets for BERT, GPT-2, and MPNet embeddings, reporting that for most properties fewer than 12 top-ranked dimensions reach 95% of full-dimensional accuracy, while low-EDI dimensions are near chance. The paper concludes that properties such as negation and polarity are robustly encoded in specific dimensions, while synonymy shows more complex patterns.
Significance. If the central claim were established, the paper would provide a practical, model-agnostic framework for identifying dimension-level linguistic encodings, with potential applications in interpretability and bias mitigation. The dataset and the cross-model evaluation (BERT, GPT-2, MPNet) are potentially useful resources, and the broad evaluation design (held-out splits, low-EDI negative control, cross-property transfer) is a step in the right direction. However, the current evidence is not yet sufficient: the mean-pooling artifact for unequal-length pairs, the anomalous Wilcoxon report for the control condition, and the unclear split used when computing EDI scores all undermine the paper's strongest conclusions. These issues are fixable with additional controls and clarifications, and the framework itself retains value, but the manuscript currently overstates the robustness of its findings.
major comments (3)
- [§4, Table 2] The mean-pooling procedure creates a systematic confound for negation, factuality, and intensifier. For these properties the second sentence is, by construction, longer by one token ('not', 'could', 'surprisingly'). Under mean pooling over token vectors, every coordinate of the sentence embedding shifts by a term proportional to (embedding_of_inserted_token − mean_of_other_tokens)/(n+1). The Wilcoxon, MI, and RFE components of the EDI score can therefore rank dimensions based on this insertion signal alone, without any evidence that the dimension encodes a generalizable linguistic property. The control LDSPs are completely unrelated sentences of uncontrolled length, so they do not rule out this artifact. Because negation (EDI max 0.9987) and factuality (EDI max 0.9740) are among the paper's most emphasized results, the claim that specific dimensions robustly encode these properties is not yet supported. The authors should add a control condition in which a neutral word (e.g., 'actually' or 'very') is inserted with the same structural pattern, and show that the EDI scores for this insertion control are substantially lower than for the target property.
- [§6.1, Figure 5] The statement that for control 'all dimensions had equivalent Wilcoxon p-values' is statistically implausible unless the Wilcoxon computation contains a bug. For non-identical real-valued data across 768 dimensions, the probability that all p-values are equal is zero. Since the p-value component carries weight 0.6 in the EDI score, this observation raises doubts about the validity of the entire EDI ranking. If the p-values are in fact merely all above some threshold, that should be reported as such; if they are literally identical, the Wilcoxon implementation must be corrected. The authors should report the full distribution of p-values for the control condition and, if the anomaly is a coding error, rerun the analysis for all properties.
- [§5.2, Appendix C] The paper does not specify whether the EDI scores (including the RFE feature selection and the Wilcoxon/MI statistics) are computed on the training split only or on the full LDSP-10 dataset. The evaluation algorithms in Appendix C train and test classifiers, but the EDI ranking is not explicitly restricted to the training portion. If EDI is computed on the full dataset, then the test labels are used during feature selection, and the reported high-EDI accuracies (e.g., 11 dimensions for negation, 4 for factuality) reflect a form of label leakage. Please clarify exactly how the 80/20 split is used in all four evaluation stages (baseline, Evaluation 1, Evaluation 2, Evaluation 3), and if necessary, recompute the EDI scores on the training split only.
minor comments (5)
- [§4.1] The definition of the Wilcoxon statistic is imprecise: 'The test ranks the absolute values of the nonzero differences... The Wilcoxon test statistic W is computed as the sum of ranks of positive |d_i|' mixes notation. Standard W is the sum of ranks of the positive differences (i.e., over d_i > 0), not over 'positive |d_i|'; consider rephrasing for clarity.
- [§3 and Table 1] The number of linguistic properties is inconsistent: the abstract says 'ten key linguistic features', Section 3 says 'nine LPs', and the list of properties in Section 3 omits 'voice' although Table 1 includes it. Please correct the count and ensure the property list matches the dataset.
- [Appendix E and F] Both appendices begin with 'This section will contain the visualizations of the results for GPT-2/MPNet embeddings,' which suggests the manuscript is not yet final, especially since the figures are actually present. This text should be revised.
- [Figure 9/10/11] The captions for the evaluation plots do not explain all line styles and markers (e.g., what the red dashed line represents in Figure 9, and what the red dashed line in Figure 11 represents). Please add legends or fully descriptive captions.
- [§4.4 and §6.5] The EDI weights (0.6/0.2/0.2), the MI 10-bin quantization, and the 0.8 EDI threshold are introduced without sensitivity analysis; the manuscript says only that the weights were chosen after 'our testing' (Section 4.4). Reporting how the main conclusions change under alternative weights or bin counts would substantially strengthen the robustness of the proposed metric.
Circularity Check
EDI ranking is partly self-validating: the score is built from the same supervised signals used to evaluate it, though held-out and cross-property tests preserve some independent content.
-
self definitional
[Section 4.4 (EDI formula), Section 4.2, Section 4.3, and Section 5.2 / Appendix C, Evaluations 1 and 2]
"In our context, X represents the values of a particular embedding dimension, and Y represents S1 (0) or S2 (1). ... sentence1 embeddings labeled as class 0 and sentence2 embeddings as class 1, enabling a binary classification setup to highlight dimensions that distinguish the two positions. ... EDId,lp = w1·− log pd,lp + w2·Md,lp + w3·Rd,lp ... Evaluation 1 explores how dimensions with high EDI scores replicate the performance of the full-dimensional classifier. We first rank all dimensions by their EDI score in descending order."
The MI term Md,lp and the RFE weight Rd,lp in EDI are computed with the same S1/S2 binary labels that the evaluation classifiers use. EDI is therefore a supervised feature-importance score for exactly the same classification task that Evaluations 1 and 2 then use to 'validate' it. Ranking dimensions by EDI and showing that logistic-regression classifiers on the top-ranked dimensions reach baseline accuracy is partly definitional: the top dimensions were selected because they separate the labels. The held-out split only shows that this supervised selection generalizes on the same data distribution; it does not independently establish that the dimensions encode the linguistic property as such.
full rationale
I find no self-citation chain, no imported uniqueness theorem, and no ansatz smuggled in via citation. The main circularity is the EDI score's self-referential validation: EDI is composed of the same supervised statistics (MI and RFE logistic-regression weights) that the evaluation then uses to show that high-EDI dimensions classify well. This makes Evaluation 1 and Evaluation 2 partially circular. The paper retains some independent content through held-out test splits, the Wilcoxon distributional analyses, and the cross-property evaluation (e.g., negation dimensions helping polarity less than the target's own dimensions), so the derivation is not wholly forced. The mean-pooling length confound for negation, factuality, and intensifier is a validity threat rather than a circularity and is not factored into the score. The anomalous control Wilcoxon statement in Figure 2 is a correctness issue, not a circularity.
Assumptions & free parameters
free parameters (5)
- EDI weights w1, w2, w3 =
0.6, 0.2, 0.2
- MI quantization bin count =
10
- EDI high-importance threshold =
0.8
- RFE final feature count =
20 (Section 4.3) / 25 (Figure 5 and Algorithm 3)
- Low-EDI evaluation feature count =
100
assumptions (4)
- domain assumption The LDSP-10 sentence pairs generated by Gemini-1.5-flash isolate the intended linguistic property with minimal extraneous differences, and the ordering of S1/S2 is valid for the directional analyses.
- domain assumption Mean-pooling the final hidden layer produces sentence embeddings in which the difference between paired sentences reflects the linguistic property rather than token count or insertion position.
- ad hoc to paper The Wilcoxon signed-rank test, discretized mutual information, and logistic-regression RFE weights all measure the same underlying "dimension importance" and can be min-max scaled and linearly combined.
- domain assumption Logistic regression on raw (unstandardized) embedding dimensions yields stable feature importance weights.
Cite this review
Pith. "Pith review of Disentangling Linguistic Features with Dimension-Wise Analysis of Vector Embeddings." pith.science (2026). https://pith.science/paper/JBE5CMWF
@misc{pith2026250414766,
  author       = {Pith},
  title        = {Pith review of: Disentangling Linguistic Features with Dimension-Wise Analysis of Vector Embeddings},
  year         = {2026},
  howpublished = {\url{https://pith.science/paper/JBE5CMWF}},
  note         = {Machine review of arXiv:2504.14766}
}
read the original abstract
Understanding the inner workings of neural embeddings, particularly in models such as BERT, remains a challenge because of their high-dimensional and opaque nature. This paper proposes a framework for uncovering the specific dimensions of vector embeddings that encode distinct linguistic properties (LPs). We introduce the Linguistically Distinct Sentence Pairs (LDSP-10) dataset, which isolates ten key linguistic features such as synonymy, negation, tense, and quantity. Using this dataset, we analyze BERT embeddings with various methods, including the Wilcoxon signed-rank test, mutual information, and recursive feature elimination, to identify the most influential dimensions for each LP. We introduce a new metric, the Embedding Dimension Impact (EDI) score, which quantifies the relevance of each embedding dimension to a LP. Our findings show that certain properties, such as negation and polarity, are robustly encoded in specific dimensions, while others, like synonymy, exhibit more complex patterns. This study provides insights into the interpretability of embeddings, which can guide the development of more transparent and optimized language models, with implications for model bias mitigation and the responsible deployment of AI systems.
Figures


Figures from the paper (49 more)







Reference graph
Works this paper leans on
-
[1]
online" 'onlinestring :=
ENTRY address archivePrefix author booktitle chapter edition editor eid eprint eprinttype howpublished institution journal key month note number organization pages publisher school series title type volume year doi pubmed url lastchecked label extra.label sort.label short.list INTEGERS output.state before.all mid.sentence after.sentence after.block STRING...
-
[2]
write newline
" write newline "" before.all 'output.state := FUNCTION n.dashify 't := "" t empty not t #1 #1 substring "-" = t #1 #2 substring "--" = not "--" * t #2 global.max substring 't := t #1 #1 substring "-" = "-" * t #2 global.max substring 't := while if t #1 #1 substring * t #2 global.max substring 't := if while FUNCTION word.in bbl.in capitalize " " * FUNCT...
-
[3]
Yossi Adi, Einat Kermany, Yonatan Belinkov, Ofer Lavi, and Yoav Goldberg. 2017. https://arxiv.org/abs/1608.04207 Fine-grained analysis of sentence embeddings using auxiliary prediction tasks . Preprint, arXiv:1608.04207
arXiv 2017
-
[4]
Omer Antverg and Yonatan Belinkov. 2022. https://arxiv.org/abs/2110.07483 On the pitfalls of analyzing individual neurons in language models . Preprint, arXiv:2110.07483
arXiv 2022
-
[5]
Anthony Bau, Yonatan Belinkov, Hassan Sajjad, Nadir Durrani, Fahim Dalvi, and James Glass. 2019. https://openreview.net/forum?id=H1z-PsR5KX Identifying and controlling important neurons in neural machine translation . In International Conference on Learning Representations
work page 2019
-
[6]
Yonatan Belinkov and James Glass. 2019. https://doi.org/10.1162/tacl_a_00254 Analysis methods in neural language processing: A survey . Transactions of the Association for Computational Linguistics, 7:49--72
-
[7]
Morris, Richard Antonello, Ion Stoica, Alexander G
Vinamra Benara, Chandan Singh, John X. Morris, Richard Antonello, Ion Stoica, Alexander G. Huth, and Jianfeng Gao. 2024. https://arxiv.org/abs/2405.16714 Crafting interpretable embeddings by asking llms questions . Preprint, arXiv:2405.16714
arXiv 2024
-
[8]
Tolga Bolukbasi, Kai-Wei Chang, James Zou, Venkatesh Saligrama, and Adam Kalai. 2016. https://arxiv.org/abs/1607.06520 Man is to computer programmer as woman is to homemaker? debiasing word embeddings . Preprint, arXiv:1607.06520
arXiv 2016
Show all 39 references
-
[9]
Hongliu Cao. 2024. https://arxiv.org/abs/2406.01607 Recent advances in text embedding: A comprehensive review of top-performing methods on the mteb benchmark . Preprint, arXiv:2406.01607
2024 arXiv
-
[10]
Alexis Conneau, German Kruszewski, Guillaume Lample, Loïc Barrault, and Marco Baroni. 2018. https://arxiv.org/abs/1805.01070 What you can cram into a single vector: Probing sentence embeddings for linguistic properties . Preprint, arXiv:1805.01070
2018 arXiv
-
[11]
Fahim Dalvi, Nadir Durrani, Hassan Sajjad, Yonatan Belinkov, Anthony Bau, and James Glass. 2019. https://doi.org/10.1609/aaai.v33i01.33016309 What is one grain of sand in the desert? analyzing individual neurons in deep nlp models . Proceedings of the AAAI Conference on Artifi...
2019 doi
-
[12]
Jacob Devlin, Ming-Wei Chang, Kenton Lee, and Kristina Toutanova. 2019. https://arxiv.org/abs/1810.04805 Bert: Pre-training of deep bidirectional transformers for language understanding . Preprint, arXiv:1810.04805
2019 arXiv
-
[13]
Nadir Durrani, Fahim Dalvi, and Hassan Sajjad. 2024. https://arxiv.org/abs/2206.13288 Discovering salient neurons in deep nlp models . Preprint, arXiv:2206.13288
2024 arXiv
-
[14]
Nadir Durrani, Hassan Sajjad, Fahim Dalvi, and Yonatan Belinkov. 2020. https://doi.org/10.18653/v1/2020.emnlp-main.395 Analyzing individual neurons in pre-trained language models . In Proceedings of the 2020 Conference on Empirical Methods in Natural Language Processing (EMNLP...
2020 doi
-
[15]
Manaal Faruqui, Jesse Dodge, Sujay Kumar Jauhar, Chris Dyer, Eduard Hovy, and Noah A. Smith. 2015 a . https://doi.org/10.3115/v1/N15-1184 Retrofitting word vectors to semantic lexicons . In Proceedings of the 2015 Conference of the North A merican Chapter of the Association fo...
2015 doi
-
[16]
Manaal Faruqui, Yulia Tsvetkov, Dani Yogatama, Chris Dyer, and Noah Smith. 2015 b . https://arxiv.org/abs/1506.02004 Sparse overcomplete word vector representations . Preprint, arXiv:1506.02004
2015 arXiv
-
[17]
Simon Guillot, Thibault Prouteau, and Nicolas Dugue. 2023. https://aclanthology.org/2023.iwcs-1.13 Sparser is better: one step closer to word embedding interpretability . In Proceedings of the 15th International Conference on Computational Semantics, pages 106--115, Nancy, Fra...
2023
-
[18]
Wes Gurnee, Neel Nanda, Matthew Pauly, Katherine Harvey, Dmitrii Troitskii, and Dimitris Bertsimas. 2023. https://arxiv.org/abs/2305.01610 Finding neurons in a haystack: Case studies with sparse probing . Preprint, arXiv:2305.01610
2023 arXiv
-
[19]
Isabelle Guyon and Andr\' e Elisseeff. 2003. An introduction to variable and feature selection. J. Mach. Learn. Res., 3(null):1157–1182
2003
-
[20]
Francesca Incitti, Federico Urli, and Lauro Snidaro. 2023. https://doi.org/10.1016/j.inffus.2022.08.024 Beyond word embeddings: A survey . Information Fusion, 89:418--436
2023 doi
-
[21]
Zachary C. Lipton. 2017. https://arxiv.org/abs/1606.03490 The mythos of model interpretability . Preprint, arXiv:1606.03490
2017 arXiv
-
[22]
Ninareh Mehrabi, Fred Morstatter, Nripsuta Saxena, Kristina Lerman, and Aram Galstyan. 2021. https://doi.org/10.1145/3457607 A survey on bias and fairness in machine learning . ACM Comput. Surv., 54(6)
2021 doi
-
[23]
Tomas Mikolov, Kai Chen, Greg Corrado, and Jeffrey Dean. 2013. https://arxiv.org/abs/1301.3781 Efficient estimation of word representations in vector space . Preprint, arXiv:1301.3781
2013 arXiv
-
[24]
Brian Murphy, Partha Pratim Talukdar, and Tom Michael Mitchell. 2012. https://api.semanticscholar.org/CorpusID:8348149 Learning effective and interpretable semantic models using non-negative sparse embedding . In International Conference on Computational Linguistics
2012
-
[25]
Abhishek Panigrahi, Harsha Vardhan Simhadri, and Chiranjib Bhattacharyya. 2019. https://doi.org/10.18653/v1/P19-1570 W ord2 S ense: Sparse interpretable word embeddings . In Proceedings of the 57th Annual Meeting of the Association for Computational Linguistics, pages 5692--57...
2019 doi
-
[26]
Jeffrey Pennington, Richard Socher, and Christopher Manning. 2014. https://doi.org/10.3115/v1/D14-1162 G lo V e: Global vectors for word representation . In Proceedings of the 2014 Conference on Empirical Methods in Natural Language Processing ( EMNLP ) , pages 1532--1543, Doh...
2014 doi
-
[27]
Tiago Pimentel, Josef Valvoda, Rowan Hall Maudslay, Ran Zmigrod, Adina Williams, and Ryan Cotterell. 2020. https://doi.org/10.18653/v1/2020.acl-main.420 Information-theoretic probing for linguistic structure . In Proceedings of the 58th Annual Meeting of the Association for Co...
2020 doi
-
[28]
Alec Radford, Jeff Wu, Rewon Child, David Luan, Dario Amodei, and Ilya Sutskever. 2019. https://api.semanticscholar.org/CorpusID:160025533 Language models are unsupervised multitask learners
2019
-
[29]
Anna Rogers, Olga Kovaleva, and Anna Rumshisky. 2020. https://doi.org/10.1162/tacl_a_00349 A primer in bertology: What we know about how bert works . Transactions of the Association for Computational Linguistics, 8:842--866
2020 doi
-
[30]
Hassan Sajjad, Nadir Durrani, and Fahim Dalvi. 2022. https://doi.org/10.1162/tacl_a_00519 Neuron-level interpretation of deep nlp models: A survey . Transactions of the Association for Computational Linguistics, 10:1285--1303
2022 doi
-
[31]
Lutfi Senel, Ihsan Utlu, Veysel Yucesoy, Aykut Koc, and Tolga Cukur. 2017. https://doi.org/10.1109/TASLP.2018.2837384 Semantic structure and interpretability of word embeddings . IEEE/ACM Transactions on Audio, Speech, and Language Processing, PP
2017
-
[32]
Lauro Snidaro, Giovanni Ferrin, and Gian Luca Foresti. 2019. https://doi.org/10.23919/FUSION43075.2019.9011324 Distributional memory explainable word embeddings in continuous space . In 2019 22th International Conference on Information Fusion (FUSION), pages 1--7
2019
-
[33]
R Steuer, Juergen Kurths, Carsten Daub, Janko Weise, and J Selbig. 2002. https://doi.org/10.1093/bioinformatics/18.suppl_2.S231 The mutual information: Detecting and evaluating dependencies between variables . Bioinformatics (Oxford, England), 18 Suppl 2:S231--40
2002 doi
-
[34]
Anant Subramanian, Danish Pruthi, Harsh Jhamtani, Taylor Berg-Kirkpatrick, and Eduard Hovy. 2018. Spine: sparse interpretable neural embeddings. In Proceedings of the Thirty-Second AAAI Conference on Artificial Intelligence and Thirtieth Innovative Applications of Artificial I...
2018
-
[35]
Lucas Torroba Hennigen, Adina Williams, and Ryan Cotterell. 2020. https://doi.org/10.18653/v1/2020.emnlp-main.15 Intrinsic probing through dimension selection . In Proceedings of the 2020 Conference on Empirical Methods in Natural Language Processing (EMNLP), pages 197--216, O...
2020 doi
-
[36]
Elena Voita, David Talbot, Fedor Moiseev, Rico Sennrich, and Ivan Titov. 2019. https://doi.org/10.18653/v1/P19-1580 Analyzing multi-head self-attention: Specialized heads do the heavy lifting, the rest can be pruned . In Proceedings of the 57th Annual Meeting of the Associatio...
2019 doi
-
[37]
Guoping Zeng. 2015. https://doi.org/10.1155/2015/201874 A unified definition of mutual information with applications in machine learning . Mathematical Problems in Engineering, 2015
2015 doi
-
[38]
Xiangyan Zeng, Yen-Wei Chen, and Caixia Tao. 2009. https://doi.org/10.1109/IIH-MSP.2009.145 Feature selection using recursive feature elimination for handwritten digit recognition . In 2009 Fifth International Conference on Intelligent Information Hiding and Multimedia Signal ...
2009 doi
-
[39]
Paschalidis, and Amir Tahmasebi
Henghui Zhu, Ioannis Ch. Paschalidis, and Amir Tahmasebi. 2018. https://arxiv.org/abs/1810.10566 Clinical concept extraction with contextual word embedding . Preprint, arXiv:1810.10566
2018 arXiv
Reviewed August 16, 2026 · model on record in the stance chip above.
Discussion (0). Continue with ORCID to comment.