REVIEW 4 major objections 5 minor 66 references
Modeling Multivariable High-resolution 3D Urban Microclimate Using Localized Fourier Neural Operator
T0 review · 4 major / 5 minor · reviewed 2026-08-12 · deepseek-v4-flash
Pith's one-line read A localized Fourier neural operator predicts 3D urban wind and temperature fields with mean errors of 0.35 m/s and 0.30°C over 60 seconds, at roughly 50 times the speed of a CFD solver.
desk verdict Local patch training genuinely sharpens FNO for urban turbulence, and the paper is honest about its limits, but the headline 10 m full-resolution claim outruns the evidence because resolution transfer is never directly validated. read the letter →
The pith
A machine-rendered reading of the paper's core claim, the machinery that carries it, and where it could break.
The reading
What carries the argument
The load-bearing mechanism is local patch training: the full 3D domain is divided into overlapping horizontal patches (up to 8×8), and a shared FNO is trained on each patch. Because the number of Fourier modes is fixed while the patch size shrinks, each mode represents a shorter physical wavelength, allowing the network to represent fine-scale turbulence that global Fourier modes miss. The two supporting mechanisms are geometry encoding, which feeds each patch a signed distance function of surrounding buildings, and patch overlapping, which lets neighboring patches exchange information at boundaries and avoids the model's own boundary errors by splitting overlap regions. The FNO's resolution-invariant property lets the model be trained on halved-resolution data and applied at full resolution, which is what makes the 150-million-feature prediction feasible on a single 32 GB GPU.
What would settle it
Train Local-FNO on half-resolution data and apply it at full resolution in a second urban area or with a significantly different wind direction; if the predicted kinetic energy spectrum in the 10–20 meter wavelength band diverges from the LES spectrum, the resolution-invariance transfer that underpins the central claim has failed.
Extended reading notes
Core claim
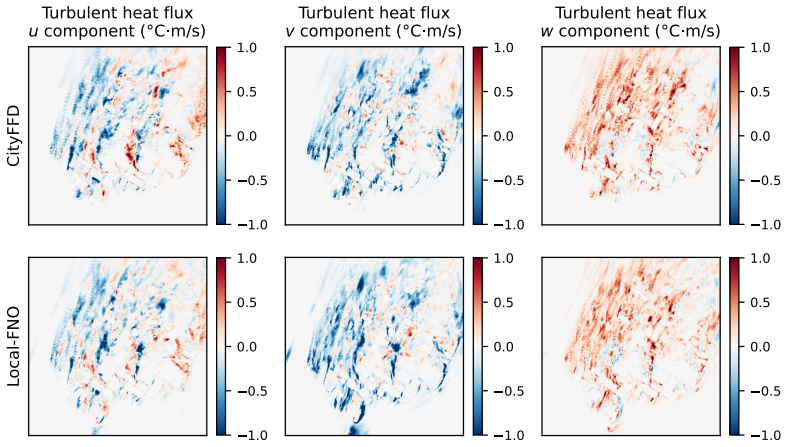
The central claim is that Fourier modes defined over small local regions encode much finer spatial detail than the same number of modes over a full urban domain, and that this simple change, combined with geometry encoding and patch overlapping, removes the spectral bias that makes vanilla FNO blurry. Local-FNO uses the FNO's resolution invariance to train on downsampled half-resolution data (250×250×75) and then predict on the full grid (500×500×150), achieving a 47- to 480-fold speedup over the GPU-accelerated CFD solver, with an average error of 0.35 m/s in velocity and 0.30°C in temperature over the first 60 seconds of rollout. It also reproduces second-order statistics, turbulent kinetic energy, and turbulent heat flux (velocity-temperature correlation), and its energy spectrum matches the LES target down to about a 20-meter wavelength, which the authors translate into 10-meter resolution via the sampling theorem.
Load-bearing premise
The whole full-resolution result rests on the assumption that an FNO trained on half-resolution data still resolves the small turbulent eddies when applied at full resolution, and this assumption is tested on only one large-eddy simulation case with one fixed wind profile.
Editorial extensions
If this is right
- If Local-FNO's claim is correct, urban microclimate simulation becomes fast enough for interactive planning tools and real-time drone or urban air mobility safety assessments.
- The 10–20 second prediction interval, 50–100 times the CFD time step, shows that machine-learned surrogates can operate on physically meaningful time scales, not just on the numerical solver's CFL-limited steps.
- The reported 23.9% error reduction and 47.3% fluctuation-correlation improvement over vanilla FNO indicate that local Fourier features are a practical cure for the spectral bias that limits global FNO on high-resolution 3D data.
- Capturing turbulent heat flux over a 120-second window suggests the model learns the correlated structure between velocity and temperature, not just each field independently.
Reading between the lines
- If the resolution-invariance transfer to full-resolution urban turbulence holds beyond this one LES case, the same patch strategy could scale to multi-city or regional domains by distributing patches across GPUs, making real-time microclimate forecasting practical.
- The local-Fourier idea may transfer to other FNO applications (weather, materials, plasma) where spectral bias blurs small-scale structures, at the cost of losing global low-frequency context, so a hybrid of global and local Fourier branches is a natural next test.
- A concrete testable extension would be to run Local-FNO on a second city or a different wind direction and compare full-grid energy spectra in the 10–20 meter band, which would directly probe the resolution-invariance assumption that the current single-case study leaves open.
Editorial analysis
A structured set of objections, weighed in public.
Referee Report
Summary. The paper proposes Local-FNO, a patch-based Fourier neural operator with signed-distance-function geometry encoding and overlapping patches, for predicting four 3D urban microclimate variables (u, v, w, temperature) from two previous snapshots. The model is trained on half-resolution (250x250x75) data and then applied to the full 500x500x150 grid by invoking FNO resolution invariance. On a single LES case of downtown Montreal, the authors report a 60 s rollout (four times the mean integral time scale) with mean RMSE about 0.35 m/s and 0.30 C, turbulent heat-flux patterns, roughly 47x speedup over CityFFD, and a 23.9% error reduction and 47.3% fluctuation-correlation improvement over vanilla FNO. The comparison against FNO is performed at matched half-resolution grids.
Significance. If the full-resolution transfer is valid, the work is practically significant: it would enable near-real-time full 3D urban microclimate prediction with useful accuracy and modest GPU memory. The Local-FNO design is simple, interpretable, and directly addresses the memory and blurring limitations of global FNO, and the paper evaluates multiple physically meaningful metrics (RMSE, fluctuation correlation, TKE, temperature variance, turbulent heat flux, energy spectra). The held-out test period and the fair half-resolution FNO comparison are genuine strengths, as is the detailed reporting of model configurations in Table 1. However, the central full-resolution claim rests on an unvalidated resolution-transfer assumption, so the significance hinges on a point the paper does not yet demonstrate.
major comments (4)
- [Section 2.5 and Section 3.2.5] The full-resolution claim (500x500x150, "10 m resolution", Table 2 RMSEs) rests on training at half resolution and applying the trained network at full resolution via FNO resolution invariance. This is not supported by the evidence presented. Although the Fourier kernel in Eq. (6) is resolution-invariant at the level of learned modes, each layer also contains pointwise operations: the feedforward network M_l, affine map W_l v + b_l, residual v, and nonlinearity sigma in Eq. (5). These operations are not bandlimited, so evaluating the trained network on a finer grid can produce Fourier content above the training Nyquist frequency; that content is extrapolated, not learned from data. The energy spectra in Fig. 14, the only scale-resolved evidence for the "down to 10 m" claim, are computed at half resolution (all models in Section 3.3 predict on 250x250x75), not at 500x500x150 against CityFFD. The full-resolution RMSE in Table 2 does not distinguish genuine resolved turbulence from spurious high-frequency artifacts. I recommend adding a direct full-resolution evaluation against the LES data, including spectral or per-wavenumber error plots at 500x500x150, or tempering the full-grid claims until such validation exists.
- [Section 3.2.1 and Table 2] The headline accuracy numbers in Table 2 are obtained with a "best-performing prediction interval" chosen post hoc from Fig. 5. The figure shows that a 10 s interval is best for the first 60 s and a 20 s interval is best after 60 s, but Table 2 does not state which interval is used for each period or each variable. This selection of the most favorable interval inflates the apparent accuracy and makes the reported 0.35 m/s and 0.30 C values difficult to reproduce. Moreover, the FNO comparison in Section 3.3.1 is run at a single 20 s interval, so the "23.9% reduction in prediction error" and Table 2's RMSE values are not on the same basis. Please report results for each prediction interval separately, or fix one interval per prediction period and use the identical interval for both the accuracy claims and the FNO comparison.
- [Section 3.2.5] The speedup claim of "nearly 50 times" (47x) is computed for a 20 s prediction interval, while the accuracy figures that the abstract highlights for the 0-60 s period are obtained with the best-performing interval, which Fig. 5 indicates is 10 s. At a 10 s interval, the speedup over a 0.2 s CFD step would be approximately 23.5x, not 47x. Since speed is a central selling point of the method, the paper should report speedup as a function of prediction interval and explicitly connect any speed number to the interval used for the corresponding accuracy claim.
- [Section 3.3.3] The statement "A 20 m wavelength corresponds to a 10 m resolution according to the sampling theorem" inverts the Nyquist relation: a 10 m grid resolves wavelengths down to 20 m, not the other way around. More importantly, the 20 m wavelength is observed in spectra computed at half resolution (250x250x75, i.e., about 8 m horizontal spacing), so it does not establish a 10 m resolved scale at full resolution. The abstract and conclusions claim "turbulence patterns down to a 10 m resolution" without giving direct evidence at that scale; please rephrase to what the spectra actually show or provide full-resolution spectral validation.
minor comments (5)
- [Section 3.2] The section title "Evaluation of perdiction performance" contains a typo; it should read "prediction." Similar typos appear elsewhere, e.g., "sovles" in Section 2.1.
- [Figure 5] The figure legend uses "Prediction interval" for the autoregressive step and "Lead time" for the total rollout horizon; please clarify in the caption that the colored curves correspond to different recurrent prediction intervals.
- [Section 2.2] The data description states that data are saved every 10th step from 15000 steps, giving 1500 saved steps representing 50 minutes; this is consistent, but the sentence structure is ambiguous and could be simplified for readability.
- [Abstract] The abstract says "nearly 50 times the speed of a CFD solver" while Section 3.2.5 reports 47 times; please make the numbers consistent or qualify them with the chosen prediction interval.
- [General] No code or data availability statement is provided. Given the growing expectation for reproducibility in machine-learning-for-PDE papers, please add a statement or clearly justify the omission.
Circularity Check
No significant circularity: the headline RMSE and fluctuation-correlation claims are held-out rollout evaluations against CityFFD outputs, not quantities defined by the fitted model, and the mild concerns about prediction-interval selection and resolution transfer are generalization risks rather than definitional reductions.
full rationale
The paper's central claim is that Local-FNO predicts future multivariable urban microclimate fields from two preceding time steps plus a signed-distance geometry encoding. The reported errors (0.35 m/s velocity, 0.30 C temperature) are computed on a test period that is sequentially separated from training and validation (Section 2.5: 'The test set is solely used to evaluate model performance, remaining fully inaccessible during training'), so the metrics are not constructed from the fitted parameters. The full-resolution predictions are obtained by training on half-resolution data and relying on FNO's resolution-invariant Fourier kernel, but this is a transferability assumption, not an equation-level identity: equation (5) shows the layer also contains pointwise nonlinearities, so whether the transfer preserves small-scale accuracy is an empirical question that the authors check with held-out spectra and visualizations. The energy-spectrum inference of '10 m resolution' is a diagnostic comparison to CityFFD, not a fitted constant renamed as a prediction. CityFFD is developed and validated by the same group, but the cited validations appeal to external wind-tunnel and field data, and the ML model is not derived from those validation claims. The only mild concern is that Table 2 reports the 'best-performing prediction interval' after displaying a sweep of intervals; because the full sweep is shown in Figure 5, this is disclosed selection rather than a hidden reduction. No load-bearing step reduces to its own inputs by definition or self-citation, so the appropriate circularity score is 0.
Assumptions & free parameters
free parameters (5)
- Patch count =
8x8 patches selected after comparing 1, 2x2, 4x4, 8x8
- Overlap rate =
20%
- Fourier mode truncation =
16, 16, 8 for x, y, z
- Prediction interval =
10 s for 0-60 s rollout, 20 s for 0-120 s rollout
- Network depth and width =
4 layers, hidden dimension 36
assumptions (6)
- domain assumption Incompressible Navier-Stokes equations with Boussinesq buoyancy (Eq. 1) govern urban airflow and temperature.
- domain assumption Large-eddy simulation with Smagorinsky closure (Eq. 3) accurately captures turbulent momentum and heat transport.
- domain assumption CityFFD has been validated for this Montreal case and its output can serve as ground truth.
- domain assumption FNO is resolution-invariant, so a network trained on 250x250x75 grids can be applied directly to 500x500x150 grids.
- ad hoc to paper Two prior snapshots plus SDF geometry contain sufficient state information to predict one interval ahead.
- ad hoc to paper Signed distance function encodes all geometry information the prediction needs.
Cite this review
Pith. "Pith review of Modeling Multivariable High-resolution 3D Urban Microclimate Using Localized Fourier Neural Operator." pith.science (2026). https://pith.science/paper/JDMX7Q7K
@misc{pith2026241111348,
  author       = {Pith},
  title        = {Pith review of: Modeling Multivariable High-resolution 3D Urban Microclimate Using Localized Fourier Neural Operator},
  year         = {2026},
  howpublished = {\url{https://pith.science/paper/JDMX7Q7K}},
  note         = {Machine review of arXiv:2411.11348}
}
read the original abstract
Accurate urban microclimate analysis with wind velocity and temperature is vital for energy-efficient urban planning, supporting carbon reduction, enhancing public health and comfort, and advancing the low-altitude economy. However, traditional computational fluid dynamics (CFD) simulations that couple velocity and temperature are computationally expensive. Recent machine learning advancements offer promising alternatives for accelerating urban microclimate simulations. The Fourier neural operator (FNO) has shown efficiency and accuracy in predicting single-variable velocity magnitudes in urban wind fields. Yet, for multivariable high-resolution 3D urban microclimate prediction, FNO faces three key limitations: blurry output quality, high GPU memory demand, and substantial data requirements. To address these issues, we propose a novel localized Fourier neural operator (Local-FNO) model that employs local training, geometry encoding, and patch overlapping. Local-FNO provides accurate predictions for rapidly changing turbulence in urban microclimate over 60 seconds, four times the average turbulence integral time scale, with an average error of 0.35 m/s in velocity and 0.30 {\deg}C in temperature. It also accurately captures turbulent heat flux represented by the velocity-temperature correlation. In a 2 km by 2 km domain, Local-FNO resolves turbulence patterns down to a 10 m resolution. It provides high-resolution predictions with 150 million feature dimensions on a single 32 GB GPU at nearly 50 times the speed of a CFD solver. Compared to FNO, Local-FNO achieves a 23.9% reduction in prediction error and a 47.3% improvement in turbulent fluctuation correlation.
Figures


Figures from the paper (11 more)




Reference graph
Works this paper leans on
- [1]
-
[2]
Sezer, N. et al. Urban microclimate and building energy models: A review of the latest progress in coupling strategies. Renew. Sustain. Energy Rev. 184, 113577, DOI: https://doi.org/10.1016/j.rser. 2023.113577 (2023)
arXiv 2023
-
[3]
Hong, T. et al. Urban microclimate and its impact on building performance: A case study of san francisco. Urban Clim. 38, 100871, DOI: https://doi.org/10.1016/j.uclim.2021.100871 (2021)
arXiv 2021
-
[4]
Bernard, J., Musy, M., Calmet, I., Bocher, E. & Keravec, P. Urban heat island temporal and spatial variations: Empirical modeling from geographical and meteorological data. Build. Environ. 125, 423–438, DOI: https://doi.org/10.1016/j.buildenv.2017.08.009 (2017)
-
[6]
Klok, L., Zwart, S., Verhagen, H. & Mauri, E. The surface heat island of rotterdam and its re- lationship with urban surface characteristics. Resour. Conserv. Recycl. 64, 23–29, DOI: https: //doi.org/10.1016/j.resconrec.2012.01.009 (2012). Climate Proofing Cities
- [7]
-
[8]
Kanda, I. & Yamao, Y . Passive scalar diffusion in and above urban-like roughness under weakly stable and unstable thermal stratification conditions. J. Wind. Eng. Ind. Aerodyn.148, 18–33 (2016)
work page 2016
-
[9]
Marucci, D. & Carpentieri, M. Stable and convective boundary-layer flows in an urban array. J. Wind. Eng. Ind. Aerodyn. 200, 104140 (2020)
work page 2020
Show all 66 references
-
[10]
L., Stathopoulos, T
Yang, S., Wang, L. L., Stathopoulos, T. & Marey, A. M. Urban microclimate and its impact on built environment – a review. Build. Environ. 238, 110334, DOI: https://doi.org/10.1016/j.buildenv.2023. 110334 (2023). 32/37
2023 doi
-
[11]
Assessment of Urban Microclimate and Its Impact on Outdoor Thermal Comfort and Building Energy Performance
Yang, S. Assessment of Urban Microclimate and Its Impact on Outdoor Thermal Comfort and Building Energy Performance. Ph.D. thesis, Concordia University (2024)
2024
-
[12]
& Wang, L
Katal, A., Mortezazadeh, M. & Wang, L. L. Modeling building resilience against extreme weather by integrated cityffd and citybem simulations. Appl. Energy 250, 1402–1417 (2019)
2019
-
[13]
L., Albettar, M
Mortezazadeh, M., Wang, L. L., Albettar, M. & Yang, S. Cityffd – city fast fluid dynamics for urban microclimate simulations on graphics processing units. Urban Clim. 41, 101063, DOI: https: //doi.org/10.1016/j.uclim.2021.101063 (2022)
2022
-
[14]
& Wang, L
Mortezazadeh, M. & Wang, L. An adaptive time-stepping semi-lagrangian method for incompress- ible flows. Numer. Heat Transfer, Part B: Fundamentals75, 1–18 (2019)
2019
-
[15]
& Wang, L
Mortezazadeh, M. & Wang, L. Slac–a semi-lagrangian artificial compressibility solver for steady- state incompressible flows. Int. J. Numer. Methods for Heat & Fluid Flow 29, 1965–1983 (2019)
2019
-
[16]
& Wang, L
Mortezazadeh, M. & Wang, L. L. Solving city and building microclimates by fast fluid dynamics with large timesteps and coarse meshes. Build. Environ. 179, 106955 (2020)
2020
-
[17]
& Calmet, I
Tian, G., Conan, B. & Calmet, I. Turbulence-Kinetic-Energy Budget in the Urban-Like Boundary Layer Using Large-Eddy Simulation. Boundary-Layer Meteorol. 178, 201–223 (2021)
2021
-
[18]
& Stathopoulos, T
Tominaga, Y . & Stathopoulos, T. CFD simulation of near-field pollutant dispersion in the urban environment: A review of current modeling techniques. Atmospheric Environ. 79, 716–730 (2013)
2013
-
[19]
Ramponi, R., Blocken, B., de Coo, L. B. & Janssen, W. D. CFD simulation of outdoor ventilation of generic urban configurations with different urban densities and equal and unequal street widths. Build. Environ. 92, 152–166 (2015)
2015
-
[20]
& Chen, S
Tian, G., Ma, Y ., Chen, Y ., Wan, M. & Chen, S. Impact of urban canopy characteristics on turbulence dynamics: Insights from large eddy simulation. Build. Environ. 250, 111183 (2024)
2024
-
[21]
Barlow, J. F. Progress in observing and modelling the urban boundary layer. Urban Clim. 10, 216– 240 (2014)
2014
-
[22]
50 years of Computational Wind Engineering: Past, present and future
Blocken, B. 50 years of Computational Wind Engineering: Past, present and future. J. Wind. Eng. Ind. Aerodyn. 129, 69–102 (2014)
2014
-
[23]
& Karniadakis, G
Raissi, M., Perdikaris, P. & Karniadakis, G. E. Physics-informed neural networks: A deep learning framework for solving forward and inverse problems involving nonlinear partial differential equa- 33/37 tions. J. Comput. physics 378, 686–707 (2019)
2019
-
[24]
Karniadakis, G. E. et al. Physics-informed machine learning. Nat. Rev. Phys. 3, 422–440 (2021)
2021
-
[25]
Azizzadenesheli, K. et al. Neural operators for accelerating scientific simulations and design. Nat. Rev. Phys. 1–9 (2024)
2024
-
[26]
& Karniadakis, G
Lu, L., Jin, P., Pang, G., Zhang, Z. & Karniadakis, G. E. Learning nonlinear operators via deeponet based on the universal approximation theorem of operators. Nat. machine intelligence 3, 218–229 (2021)
2021
-
[27]
Hao, Z. et al. Gnot: A general neural operator transformer for operator learning. In International Conference on Machine Learning, 12556–12569 (PMLR, 2023)
2023
-
[28]
Bi, K. et al. Accurate medium-range global weather forecasting with 3d neural networks. Nature 619, 533–538 (2023)
2023
-
[29]
Lam, R. et al. Learning skillful medium-range global weather forecasting. Science 382, 1416–1421 (2023)
2023
-
[30]
Kochkov, D. et al. Neural general circulation models for weather and climate. Nature 632, 1060– 1066 (2024)
2024
-
[31]
& Haffner, P
LeCun, Y ., Bottou, L., Bengio, Y . & Haffner, P. Gradient-based learning applied to document recog- nition. Proc. IEEE 86, 2278–2324 (1998)
1998
-
[32]
Kipf, T. N. & Welling, M. Semi-supervised classification with graph convolutional networks. In 5th International Conference on Learning Representations, ICLR 2017, Toulon, France, April 24-26, 2017, Conference Track Proceedings(OpenReview.net, 2017)
2017
-
[33]
Dosovitskiy, A. et al. An image is worth 16x16 words: Transformers for image recognition at scale. In 9th International Conference on Learning Representations, ICLR 2021, Virtual Event, Austria, May 3-7, 2021 (OpenReview.net, 2021)
2021
-
[34]
Li, Z. et al. Fourier neural operator for parametric partial differential equations. In 9th Interna- tional Conference on Learning Representations, ICLR 2021, Virtual Event, Austria, May 3-7, 2021 (OpenReview.net, 2021)
2021
-
[35]
Pathak, J. et al. Fourcastnet: A global data-driven high-resolution weather model using adaptive fourier neural operators. arXiv preprint arXiv:2202.11214 (2022). 34/37
2022 arXiv
-
[36]
& Wang, J
Li, Z., Peng, W., Yuan, Z. & Wang, J. Long-term predictions of turbulence by implicit u-net enhanced fourier neural operator. Phys. Fluids 35 (2023)
2023
-
[37]
M., Pittie, T., Chakraborty, S
Rashid, M. M., Pittie, T., Chakraborty, S. & Krishnan, N. A. Learning the stress-strain fields in digital composites using fourier neural operator. Iscience 25 (2022)
2022
-
[38]
& Lin, Y
Li, B., Wang, H., Feng, S., Yang, X. & Lin, Y . Solving seismic wave equations on variable velocity models with fourier neural operator. IEEE Transactions on Geosci. Remote. Sens. 61, 1–18 (2023)
2023
-
[39]
Plasma surrogate modelling using fourier neural operators
Gopakumar, V .et al. Plasma surrogate modelling using fourier neural operators. Nucl. Fusion 64, 056025 (2024)
2024
-
[40]
The Local Structure of Turbulence in Incompressible Viscous Fluid for Very Large Reynolds’ Numbers
Kolmogorov, A. The Local Structure of Turbulence in Incompressible Viscous Fluid for Very Large Reynolds’ Numbers. Akademiia Nauk SSSR Doklady 30, 301–305 (1941)
1941
-
[41]
Peng, W. et al. Fourier neural operator for real-time simulation of 3d dynamic urban microclimate. Build. Environ. 248, 111063 (2024)
2024
-
[42]
& Benson, S
Wen, G., Li, Z., Azizzadenesheli, K., Anandkumar, A. & Benson, S. M. U-fno—an enhanced fourier neural operator-based deep-learning model for multiphase flow. Adv. Water Resour. 163, 104180 (2022)
2022
-
[43]
& Brox, T
Ronneberger, O., Fischer, P. & Brox, T. U-net: Convolutional networks for biomedical image seg- mentation. In Medical image computing and computer-assisted intervention–MICCAI 2015: 18th international conference, Munich, Germany, October 5-9, 2015, proceedings, part III 18 , 2...
2015
-
[44]
& Zhang, L
Liu, X., Xu, B., Cao, S. & Zhang, L. Mitigating spectral bias for the multiscale operator learning. J. Comput. Phys. 506, 112944 (2024)
2024
-
[45]
& Qin, G
Ye, X., Li, H., Huang, J. & Qin, G. On the locality of local neural operator in learning fluid dynamics. Comput. Methods Appl. Mech. Eng. 427, 117035 (2024)
2024
-
[46]
Liu-Schiaffini, M. et al. Neural operators with localized integral and differential kernels. In Forty- first International Conference on Machine Learning, ICML 2024, Vienna, Austria, July 21-27, 2024 (OpenReview.net, 2024)
2024
-
[47]
& Brandstetter, J
Lippe, P., Veeling, B., Perdikaris, P., Turner, R. & Brandstetter, J. Pde-refiner: Achieving accurate long rollouts with neural pde solvers. Adv. Neural Inf. Process. Syst. 36 (2024). 35/37
2024
-
[48]
Qin, S. et al. Toward a better understanding of fourier neural operators: Analysis and improvement from a spectral perspective. arXiv preprint arXiv:2404.07200 (2024)
2024 arXiv
-
[49]
& Wang, L
Mortezazadeh, M. & Wang, L. L. A high-order backward forward sweep interpolating algorithm for semi-lagrangian method. Int. J. for Numer. Methods Fluids 84, 584–597 (2017)
2017
-
[50]
& Hassan, I
Zhan, D., Sezer, N., Hou, D., Wang, L. & Hassan, I. G. Integrating urban heat island impact into building energy assessment in a hot-arid city.Buildings 13, DOI: 10.3390/buildings13071818 (2023)
2023 doi
-
[51]
Luo, N. et al. A data schema for exchanging information between urban building energy models and urban microclimate models in coupled simulations. J. Build. Perform. Simul. 1–18 (2022)
2022
-
[52]
CityFFD–City Fast Fluid Dynamics Model for Urban Microclimate Simulations
Mortezazadeh Dorostkar, M. CityFFD–City Fast Fluid Dynamics Model for Urban Microclimate Simulations. Ph.D. thesis, Concordia University (2019)
2019
-
[53]
& Mishra, S
Kovachki, N., Lanthaler, S. & Mishra, S. On universal approximation and error bounds for fourier neural operators. J. Mach. Learn. Res. 22, 1–76 (2021)
2021
-
[54]
Li, Z. et al. Neural operator: Graph kernel network for partial differential equations. arXiv preprint arXiv:2003.03485 (2020)
2020 arXiv
-
[55]
& Sun, J
He, K., Zhang, X., Ren, S. & Sun, J. Deep residual learning for image recognition. In Proceedings of the IEEE conference on computer vision and pattern recognition, 770–778 (2016)
2016
-
[56]
P., Xie, L
Tran, A., Mathews, A. P., Xie, L. & Ong, C. S. Factorized fourier neural operators. In The Eleventh International Conference on Learning Representations, ICLR 2023, Kigali, Rwanda, May 1-5, 2023 (OpenReview.net, 2023)
2023
-
[57]
Attention is all you need
Vaswani, A. Attention is all you need. Adv. Neural Inf. Process. Syst. (2017)
2017
-
[58]
Cooley, J. W. & Tukey, J. W. An algorithm for the machine calculation of complex fourier series. Math. computation 19, 297–301 (1965)
1965
-
[59]
Z., Liu, B
Li, Z., Huang, D. Z., Liu, B. & Anandkumar, A. Fourier neural operator with learned deformations for pdes on general geometries. J. Mach. Learn. Res. 24, 1–26 (2023)
2023
-
[60]
E., Hinton, G
Rumelhart, D. E., Hinton, G. E. & Williams, R. J. Learning representations by back-propagating errors. nature 323, 533–536 (1986)
1986
-
[61]
& Bialek, W
Ruderman, D. & Bialek, W. Statistics of natural images: Scaling in the woods. Adv. neural informa- tion processing systems 6 (1993). 36/37
1993
-
[62]
& Sethian, J
Osher, S. & Sethian, J. A. Fronts propagating with curvature-dependent speed: Algorithms based on hamilton-jacobi formulations. J. computational physics 79, 12–49 (1988)
1988
-
[63]
& Lewy, H
Courant, R., Friedrichs, K. & Lewy, H. Über die partiellen differenzengleichungen der mathematis- chen physik. Math. annalen 100, 32–74 (1928)
1928
-
[64]
Batchelor, G. K. The theory of homogeneous turbulence (Cambridge university press, 1953)
1953
-
[65]
& Xiao, Z
Tian, G. & Xiao, Z. Non-isothermal flow past a heated circular cylinder in subcritical regime: a numerical investigation based on large-eddy simulation. J. Turbul. 23, 352–381 (2022)
2022
-
[66]
Shannon, C. E. Communication in the presence of noise. Proc. IRE 37, 10–21 (1949)
1949
-
[67]
The wavelet transform, time-frequency localization and signal analysis
Daubechies, I. The wavelet transform, time-frequency localization and signal analysis. IEEE trans- actions on information theory 36, 961–1005 (1990). 37/37
1990
Reviewed August 12, 2026 · model on record in the stance chip above.
Discussion (0). Continue with ORCID to comment.