REVIEW 5 major objections 6 minor 42 references
Multi-Platform Methane Plume Detection via Model and Domain Adaptation
T0 review · 5 major / 6 minor · reviewed 2026-08-07 · deepseek-v4-flash
Pith's one-line read Translating EMIT satellite methane tiles into the airborne AVIRIS-NG domain with CycleGAN, then running a multi-campaign airborne classifier, detects plume tiles at F1 0.88, beating zero-shot and fine-tuned baselines.
desk verdict Useful first comparison of model vs data adaptation for cross-platform methane plume detection, but the headline F1 gain is confounded by test-set-based CycleGAN selection and unbalanced baseline comparisons. read the letter →
The pith
A machine-rendered reading of the paper's core claim, the machinery that carries it, and where it could break.
The reading
What carries the argument
The central object is CycleGAN, a coupled pair of generative adversarial networks trained with a cycle-consistency loss to learn bidirectional image-to-image translation between the EMIT spaceborne domain and the AVIRIS-NG airborne domain without paired or co-registered images. In the direction used for the headline result, the space-to-air generator maps 60 m EMIT matched-filter tiles into simulated airborne-like products, and the inverse generator must map them back, forcing the translation to preserve plume structure rather than merely alter texture. This generator is paired with a GoogLeNet-style convolutional classifier with antialiasing, trained on three airborne campaigns, which then scores the translated tiles.
What would settle it
Recompute the positive-class F1 of the CycleGAN-translated pipeline on an EMIT test set with natural plume prevalence of roughly 3.7% (327 positive versus 8,664 negative tiles) instead of the balanced 50/50 set; if the score falls to or below the 0.76 fine-tuned model, the claimed advantage of domain translation over model adaptation does not survive realistic class imbalance.
Extended reading notes
Core claim
The paper's central claim is that adapting the data, not the model, is the best route to cross-platform methane plume detection. Using a CycleGAN to translate EMIT matched-filter column-enhancement tiles into the AVIRIS-NG airborne distribution, and then applying the multi-campaign airborne plume classifier to the translated tiles, yields an F1 score of 0.88 on positive EMIT plume tiles. This outperforms zero-shot application of the airborne model (0.52), a standalone EMIT-trained classifier (0.74), and fine-tuning the airborne model on EMIT data (0.76). The paper attributes the gain to distribution alignment: the CycleGAN reproduces the wider dynamic range and finer spatial variance of the airborne CMF products, so a classifier already hardened to airborne noise and false enhancements can work on spaceborne products.
Load-bearing premise
The CycleGAN is trained on subsets with 50% plume tiles and the headline F1 scores are measured on equally balanced test sets, so the 0.88 assumes that performance under this artificial class balance reflects real-world utility where methane plumes are rare.
Editorial extensions
If this is right
- Translating EMIT matched-filter tiles into the airborne AVIRIS-NG distribution lets a multi-campaign airborne classifier detect positive EMIT plume tiles with F1 0.88, the strongest of all tested approaches.
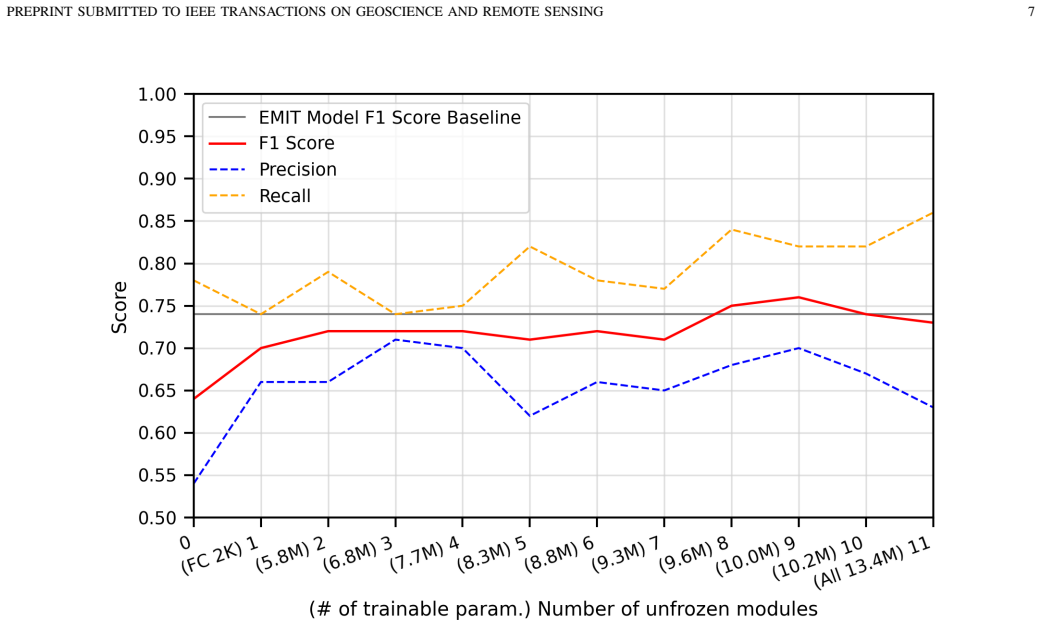
- Fine-tuning the airborne model on spaceborne data with nine unfrozen layers reaches F1 0.76, only marginally above the EMIT-only model, and most of that gain appears with just 25% of the EMIT training data.
- Directly applying airborne classifiers to EMIT data is the weakest route, with F1 as low as 0.52, confirming a substantial cross-platform distribution shift.
- The translation also works in reverse: simulated EMIT products scored about 0.70 under the EMIT classifier, close to the EMIT-only model's 0.74, suggesting the CycleGAN captures both directions of the shift.
- The CycleGAN approach offers a data-simulation route that preserves real background features and false enhancements, unlike synthetic plume injection methods.
Reading between the lines
- A testable extension is to evaluate the translated-pipeline F1 on an EMIT test set with natural plume prevalence instead of the 50/50 split; if the positive-class F1 falls toward or below 0.76, the headline advantage is partly an artifact of balanced evaluation.
- The same unpaired translation recipe could be applied to other imaging-spectroscopy products, such as CO2 enhancements or mineral maps, whenever a mature airborne classifier exists and a new spaceborne sensor needs rapid deployment.
- The paper's observation that a linear false enhancement from an asphalt road survived translation suggests adding a plume-consistency or false-enhancement penalty to the cycle loss could suppress such artifacts and may improve the translated classifier further.
- The sharp F1 jump after one epoch implies that the CycleGAN's early coarse structural mapping is what enables the classifier transfer, so a lighter-weight translation model might capture most of the benefit at lower training cost.
Editorial analysis
A structured set of objections, weighed in public.
Referee Report
Summary. The manuscript proposes and evaluates two strategies for adapting an airborne AVIRIS-NG methane plume classifier to spaceborne EMIT data: model adaptation (fine-tuning with varying numbers of frozen layers) and data adaptation (CycleGAN-based image translation between CMF product domains). Using a GoogLeNetAA classifier, the authors report that translating EMIT tiles into the airborne domain and applying the multi-campaign airborne classifier yields F1=0.88, outperforming zero-shot transfer (0.52), an EMIT-only classifier (0.74), and fine-tuning (0.76). The paper also documents dataset curation, distribution-shift statistics, and qualitative analysis of translated tiles.
Significance. This work addresses a timely and practical problem: methane plume detection models trained on airborne AVIRIS-NG data do not transfer directly to spaceborne EMIT products. The paper contributes a curated EMIT dataset with cloud filtering, a systematic comparison of zero-shot, fine-tuned, and CycleGAN-based adaptation, and clear visualizations of translated products. The CycleGAN approach is sensible and, if properly validated, would be a valuable tool for cross-platform methane monitoring, particularly because it avoids the need for co-registration. The main weakness is that the central quantitative claim is currently supported only by an apples-to-oranges comparison across different test sets and by test-set-based model selection, so the headline numbers in Figure 1 and the abstract are not yet reliable. The authors should be credited for explicitly acknowledging the balanced-sampling caveat in Section IV, but the inference drawn from the experiment needs rework.
major comments (5)
- [Section III-C, Table II, and Section II-E] The headline comparison is not apples-to-apples. The CycleGAN result (F1=0.88) is computed on a balanced EMIT test subset of 238 tiles (119 positive, 119 negative), whereas the zero-shot baseline (F1=0.52) reported in Table II is computed on the full 4,680-tile EMIT cloudless test set with natural class prevalence. F1 depends on prevalence: a classifier with recall 0.79 and precision 0.99 on a balanced set can have a substantially lower F1 when applied to a test set in which positives are rare, because precision is highly sensitive to the number of false positives. To establish the claim, all approaches should be evaluated on the same test set, ideally the full imbalanced one, and precision and recall should be reported alongside F1.
- [Section II-E] The text states that at epoch 0, "the F1 scores ... match the direct application values reported in Table II," but the CycleGAN tracking is described as using balanced test subsets (238 EMIT tiles with 119 positives, and 432 airborne tiles with 216 positives), while Table II reports F1 on full test sets (4,680 and 4,822 tiles). These two statements cannot both hold. If the epoch-0 F1 is computed on the balanced subsets, it will not equal Table II; if it equals Table II, then the tracking does not use the balanced subsets as described. This internal inconsistency must be resolved before the 0.88 versus 0.52 comparison can be interpreted.
- [Section III-C] The final CycleGAN was selected "based on loss curves, generated images, and classifier performance" on holdout test sets, and Section II-E indicates classification F1 was tracked after every epoch on those test sets. Selecting the model that maximizes F1 on the test set means the reported 0.88 is a test-selected number and is likely an overestimate. Use a separate validation set for model selection and report results from the single best model on the untouched test set.
- [Section II-C] The instrument-specific normalization constant instrmax is computed from "the collective pixel values observed in all scenes captured by each instrument used in our training and test sets." Using test-set pixels to set normalization statistics is a form of leakage that affects all reported classifiers and the CycleGAN preprocessing. Normalization constants should be estimated from the training set only, or via nested cross-validation, and all numbers should be re-reported.
- [Section IV] The authors concede that CycleGAN training "was not fully unsupervised" because training tiles were balanced to equal numbers of positive and negative examples, and the evaluation in Section II-E is likewise on balanced test subsets. This conditions both the learned translation and the reported F1 on an artificial 50% plume prior. In operational use, plume tiles are rare relative to non-plume tiles. The paper should evaluate the CycleGAN-translated pipeline on the natural-prevalence full test set and, ideally, report F1 as a function of decision threshold or prior to show the robustness of the claimed improvement.
minor comments (6)
- [Section II-B and Table II] The dataset sizes do not reconcile: after cloud filtering there are 327 positive and 8,664 negative EMIT tiles, and an 80/10/10 split would yield roughly 7,193 train and 899 test tiles, not the 5,469 train and 4,680 test tiles listed in Table II; totals should be made consistent.
- [Section II-A] The ground sample distance is reported as "GSD ∈ [3, 7] m2"; the "m2" should be "m" (or the sentence should specify area units if meant literally).
- [Introduction and references] Reference [17] is cited both for the Růžička et al. work on transformer-based methane detection and later for Mateo-García et al. on CycleGAN cloud detection; these are distinct works and need separate citations.
- [Throughout] "A VIRIS-NG" appears with a space; the instrument name should be written consistently as "AVIRIS-NG."
- [Section II-C] "With a lower lower variance and range" contains a duplicated word.
- [Abstract and Section I] The claim that this is "the first study" to use data-driven machine learning to enhance spaceborne methane plume detection should be qualified, given the cited Růžička et al. work on cross-sensor detection and prior transfer-learning literature.
Circularity Check
Headline F1 of 0.88 is selected on the same balanced EMIT test set used to report it, so the headline number is partly forced by test-set-based model selection rather than being an independent holdout prediction.
-
fitted input called prediction
[Section II-E (Data adaptation) and Section III-C (Data adaptation results)]
"After every epoch of training, we pass the spaceborne test set xs ∈ Xspace through the space → air generator Ga(xs) to generate simulated airborne products. We run these products through the CACH4+COVID+Permian airborne model from Section III-A. ... The highest performing model—based on loss curves, generated images, and classifier performance—was the balanced CycleGAN that was trained on the CACH4+COVID+Permian campaigns with a learning rate of 2 × 10⁻⁶."
The final positive-class F1 of 0.88 is computed on the same balanced 238-tile EMIT test set that is passed through the CycleGAN 'after every epoch' to track classification F1, and the CycleGAN is then selected based in part on that classifier performance. Thus the reported number is the result of test-set-based model selection among at least six larger CycleGANs and multiple learning rates, not an unbiased prediction on an untouched holdout. The comparison to the 0.52 zero-shot baseline is also mismatched: 0.52 comes from Table II on the full 4,680-tile EMIT cloudless test set, whereas 0.88 is measured on a balanced 238-tile subset with 50% positive prevalence. The claimed relative gain is therefore partly an artifact of the evaluation protocol rather than an independent predictive result.
full rationale
The paper is a largely self-contained empirical evaluation, not a derivation. The airborne dataset is taken from the authors' prior work [14], but the classifiers are retrained in Section II-C and the CycleGAN is trained here, so no load-bearing self-citation chain or imported uniqueness theorem forces the central result. The main circularity is narrower but real: the headline F1 of 0.88 is produced from the same balanced EMIT test set that was used, after every epoch, to track classifier performance and to select the 'highest performing model.' Selecting among CycleGAN configurations on the test set and then reporting that test set's performance as the result makes the headline number at least partly forced by the selection criterion. The baseline comparison compounds the problem because the 0.52 zero-shot number is taken from Table II on the full 4,680-tile EMIT test set while the 0.88 is computed on a balanced 238-tile subset, so the two F1 values are not prevalence-matched. The paper's own caveat that the CycleGAN training was 'not fully unsupervised' because it balanced positive and negative tiles is a limitation rather than circularity. No self-definitional, ansatz-smuggling, or renaming circularity was found; the circularity score reflects the single fitted-input-called-prediction step involving test-set-based model selection.
Assumptions & free parameters
free parameters (5)
- instr_max normalization value =
95th percentile of collective pixel values per instrument (numeric value not reported)
- cloud fraction cutoff =
20%
- number of unfrozen layers for fine-tuning =
9
- CycleGAN learning rate =
2e-6
- positive tile proportion in CycleGAN training =
50%
assumptions (5)
- domain assumption CMF matched-filter enhancements from both instruments, after clipping and normalization, reside in comparable distributions such that cross-domain translation is meaningful.
- domain assumption The EMIT L2B plume list from the Open Data Portal is accurate and complete.
- domain assumption Background tiles sampled from unlabeled image regions are true negatives (no methane plumes).
- domain assumption CycleGAN cycle-consistency and adversarial losses can learn an invertible mapping between unpaired airborne and spaceborne sensor domains.
- domain assumption Features learned by a CNN on airborne plumes transfer to spaceborne data after fine-tuning or domain translation.
Cite this review
Pith. "Pith review of Multi-Platform Methane Plume Detection via Model and Domain Adaptation." pith.science (2026). https://pith.science/paper/JDXMRPRK
@misc{pith2026250606348,
  author       = {Pith},
  title        = {Pith review of: Multi-Platform Methane Plume Detection via Model and Domain Adaptation},
  year         = {2026},
  howpublished = {\url{https://pith.science/paper/JDXMRPRK}},
  note         = {Machine review of arXiv:2506.06348}
}
read the original abstract
Prioritizing methane for near-term climate action is crucial due to its significant impact on global warming. Previous work used columnwise matched filter products from the airborne AVIRIS-NG imaging spectrometer to detect methane plume sources; convolutional neural networks (CNNs) discerned anthropogenic methane plumes from false positive enhancements. However, as an increasing number of remote sensing platforms are used for methane plume detection, there is a growing need to address cross-platform alignment. In this work, we describe model- and data-driven machine learning approaches that leverage airborne observations to improve spaceborne methane plume detection, reconciling the distributional shifts inherent with performing the same task across platforms. We develop a spaceborne methane plume classifier using data from the EMIT imaging spectroscopy mission. We refine classifiers trained on airborne imagery from AVIRIS-NG campaigns using transfer learning, outperforming the standalone spaceborne model. Finally, we use CycleGAN, an unsupervised image-to-image translation technique, to align the data distributions between airborne and spaceborne contexts. Translating spaceborne EMIT data to the airborne AVIRIS-NG domain using CycleGAN and applying airborne classifiers directly yields the best plume detection results. This methodology is useful not only for data simulation, but also for direct data alignment. Though demonstrated on the task of methane plume detection, our work more broadly demonstrates a data-driven approach to align related products obtained from distinct remote sensing instruments.
Figures


Figures from the paper (5 more)


Reference graph
Works this paper leans on
-
[1]
Global concentrations of CO2 and CH4 retrieved from GOSAT: First preliminary results,
T. Yokota, Y . Yoshida, N. Eguchi, Y . Ota, T. Tanaka, H. Watanabe, and S. Maksyutov, “Global concentrations of CO2 and CH4 retrieved from GOSAT: First preliminary results,” Sola, vol. 5, 2009
work page 2009
-
[2]
Toward global mapping of methane with TROPOMI: First results and intersatellite comparison to GOSAT,
H. Hu, J. Landgraf, R. Detmers, T. Borsdorff, J. Aan de Brugh, I. Aben, A. Butz, and O. Hasekamp, “Toward global mapping of methane with TROPOMI: First results and intersatellite comparison to GOSAT,” Geophysical Research Letters , vol. 45, no. 8, 2018
work page 2018
-
[3]
S. Maksyutov, T. Matsunaga, Y . Yoshida, J. W. Kaiser, T. Oda, R. Ja- nardanan, A. Eldering, Y . Vineet, A. Ito, M. Saito et al. , “Developing methods for estimating the anthropogenic carbon dioxide and methane emissions based on GOSAT and OCO-2 satellite observations,” 42nd COSPAR Scientific Assembly, vol. 42, 2018
work page 2018
-
[4]
Imaging spectroscopy and the airborne visible/infrared imaging spectrometer (A VIRIS),
R. O. Green, M. L. Eastwood, C. M. Sarture, T. G. Chrien, M. Aronsson, B. J. Chippendale, J. A. Faust, B. E. Pavri, C. J. Chovit, M. Solis et al., “Imaging spectroscopy and the airborne visible/infrared imaging spectrometer (A VIRIS),”Remote Sensing of Environment, vol. 65, no. 3, 1998
work page 1998
-
[5]
A. K. Thorpe, D. A. Roberts, E. S. Bradley, C. C. Funk, P. E. Dennison, and I. Leifer, “High resolution mapping of methane emissions from marine and terrestrial sources using a cluster-tuned matched filter technique and imaging spectrometry,” Remote Sensing of Environment , vol. 134, 2013
work page 2013
-
[6]
Intermittency of large methane emitters in the Permian Basin,
D. H. Cusworth, R. M. Duren, A. K. Thorpe, W. Olson-Duvall, J. Heck- ler, J. W. Chapman, M. L. Eastwood, M. C. Helmlinger, R. O. Green, G. P. Asner et al. , “Intermittency of large methane emitters in the Permian Basin,” Environmental Science & Technology Letters , vol. 8, no. 7, 2021
work page 2021
-
[7]
A. K. Thorpe, R. O. Green, D. R. Thompson, P. G. Brodrick, J. W. Chapman, C. D. Elder, I. Irakulis-Loitxate, D. H. Cusworth, A. K. Ayasse, R. M. Duren et al. , “Attribution of individual methane and carbon dioxide emission sources using EMIT observations from space,” Science Advances, vol. 9, no. 46, 2023
work page 2023
-
[8]
EMIT L2B estimated methane plume complexes 60 m v001,
R. Green, A. Thorpe, P. Brodrick, D. Chadwick, A. Lopez, C. Elder, C. Villanueva-Weeks, J. Fahlen, R. Coleman, D. Jensen, H. Ben- der, Q. Vinckier, C. Xiang, W. Olson-Duvall, S. Lundeen, and D. Thompson, “EMIT L2B estimated methane plume complexes 60 m v001,” [Data set]. NASA EOSDIS Land Processes Dis- tributed Active Archive Center, 2023, accessed 2024-0...
Show all 42 references
-
[9]
Preliminary alignment, characterization, and comparison of next generation carbon mapping imaging spectrometers,
S. R. Zandbergen, L. Shaw, C. Klein, R. O. Green, R. Duren, M. Gibson, H. Nazaryan, C. Smith, P. Giuliano, J. Haag et al. , “Preliminary alignment, characterization, and comparison of next generation carbon mapping imaging spectrometers,” in Imaging Spectrometry XXVI: Ap- plic...
2023
-
[10]
The MethaneSAT Mission,
R. R. Rohrschneider, S. Wofsy, J. E. Franklin, J. Benmergui, J. Soto, and S. B. Davis, “The MethaneSAT Mission,” 2021
2021
-
[11]
S2MetNet: A novel dataset and deep learning benchmark for methane point source quantification using Sentinel-2 satellite imagery,
A. Radman, M. Mahdianpari, D. J. Varon, and F. Mohammadimanesh, “S2MetNet: A novel dataset and deep learning benchmark for methane point source quantification using Sentinel-2 satellite imagery,” Remote Sensing of Environment, vol. 295, 2023
2023
-
[12]
Robust multi-campaign imaging spectrometer methane plume detection using deep learning,
J. Lee, B. D. Bue, M. J. Garay, A. K. Thorpe, R. M. Duren, D. Cusworth, and A. Ayasse, “Robust multi-campaign imaging spectrometer methane plume detection using deep learning,” in AGU Fall Meeting Abstracts , vol. 2022, 2022
2022
-
[13]
Automated detection and monitoring of methane super-emitters using satellite data,
B. J. Schuit, J. D. Maasakkers, P. Bijl, G. Mahapatra, A.-W. Van den Berg, S. Pandey, A. Lorente, T. Borsdorff, S. Houweling, D. J. Varon et al., “Automated detection and monitoring of methane super-emitters using satellite data,” Atmospheric Chemistry and Physics, vol. 23, no...
2023
-
[14]
Towards operational automated greenhouse gas plume detection,
B. D. Bue, J. H. Lee, A. K. Thorpe, P. G. Brodrick, D. Cusworth, A. Ayasse, V . Mancoridis, A. Satish, S. Xiong, and R. Duren, “Towards operational automated greenhouse gas plume detection,” 2025. [Online]. Available: https://arxiv.org/abs/2505.21806
2025 arXiv
-
[15]
MethaNet–An AI-driven approach to quantifying methane point-source emission from high-resolution 2-D plume imagery,
S. Jongaramrungruang, A. K. Thorpe, G. Matheou, and C. Frankenberg, “MethaNet–An AI-driven approach to quantifying methane point-source emission from high-resolution 2-D plume imagery,” Remote Sensing of Environment, vol. 269, 2022
2022
-
[16]
Using a deep neural network to detect methane point sources and quantify emissions from PRISMA hyperspectral satellite images,
P. Joyce, C. Ruiz Villena, Y . Huang, A. Webb, M. Gloor, F. H. Wagner, M. P. Chipperfield, R. Barrio Guill ´o, C. Wilson, and H. Boesch, “Using a deep neural network to detect methane point sources and quantify emissions from PRISMA hyperspectral satellite images,” EGUsphere, ...
2022
-
[17]
Semantic segmentation of methane plumes with hyperspectral machine learning models,
V . R˚uˇziˇcka, G. Mateo-Garcia, L. G´omez-Chova, A. Vaughan, L. Guanter, and A. Markham, “Semantic segmentation of methane plumes with hyperspectral machine learning models,” Scientific Reports , vol. 13, no. 1, 2023
2023
-
[18]
Transfer learning in environmental remote sensing,
Y . Ma, S. Chen, S. Ermon, and D. B. Lobell, “Transfer learning in environmental remote sensing,” Remote Sensing of Environment , vol. 301, p. 113924, 2024
2024
-
[19]
A review and meta-analysis of generative adversarial networks and their applications in remote sensing,
S. Jozdani, D. Chen, D. Pouliot, and B. A. Johnson, “A review and meta-analysis of generative adversarial networks and their applications in remote sensing,” International Journal of Applied Earth Observation and Geoinformation, vol. 108, p. 102734, 2022
2022
-
[20]
Transfer learning,
L. Torrey and J. Shavlik, “Transfer learning,” in Handbook of Research on Machine Learning Applications and Trends: Algorithms, Methods, and Techniques. IGI global, 2010
2010
-
[21]
Real time remote detection and measure- ment for airborne imaging spectroscopy: a case study with methane,
D. R. Thompson, I. Leifer, H. Bovensmann, M. Eastwood, M. Fladeland, C. Frankenberg, K. Gerilowski, R. O. Green, S. Kratwurst, T. Krings, B. Luna, and A. K. Thorpe, “Real time remote detection and measure- ment for airborne imaging spectroscopy: a case study with methane,” Atm...
2015
-
[22]
Improved matched-filter detection techniques,
P. V . Villeneuve, H. A. Fry, J. P. Theiler, W. B. Clodius, B. W. Smith, and A. D. Stocker, “Improved matched-filter detection techniques,” in Imaging Spectrometry V , vol. 3753. SPIE, 1999, pp. 278–285
1999
-
[23]
Spectral and radiometric calibration of the next generation airborne visible infrared spectrometer (A VIRIS-NG),
J. W. Chapman, D. R. Thompson, M. C. Helmlinger, B. D. Bue, R. O. Green, M. L. Eastwood, S. Geier, W. Olson-Duvall, and S. R. Lundeen, “Spectral and radiometric calibration of the next generation airborne visible infrared spectrometer (A VIRIS-NG),” Remote Sensing , vol. 11, n...
2019
-
[24]
On-orbit calibration and performance of the EMIT imaging spectrometer,
D. R. Thompson, R. O. Green, C. Bradley, P. G. Brodrick, N. Mahowald, E. B. Dor, M. Bennett, M. Bernas, N. Carmon, K. D. Chadwick et al. , “On-orbit calibration and performance of the EMIT imaging spectrometer,” Remote Sensing of Environment , vol. 303, 2024
2024
-
[25]
Methane emissions decline from reduced oil, natural gas, and refinery production during covid-19,
A. K. Thorpe, E. A. Kort, D. Cusworth, A. Ayasse, B. D. Bue, V . Yadav, D. R. Thompson, C. Frankenberg, J. Herner, M. Falk et al. , “Methane emissions decline from reduced oil, natural gas, and refinery production during covid-19,” Environmental Research Communications , vol. ...
2023
-
[26]
California’s methane super-emitters,
R. M. Duren, A. K. Thorpe, K. T. Foster, T. Rafiq, F. M. Hopkins, V . Yadav, B. D. Bue, D. R. Thompson, S. Conley, N. K. Colombi et al., “California’s methane super-emitters,” Nature, vol. 575, no. 7781, 2019
2019
-
[27]
EMIT L2B Methane Enhancement Data 60 m V001,
R. Green, A. Thorpe, P. Brodrick, D. Chadwick, A. Lopez, C. El- der, C. Villanueva-Weeks, J. Fahlen, R. Coleman, D. Jensen, H. Bender, Q. Vinckier, C. Xiang, W. Olson-Duvall, S. Lun- deen, and D. Thompson, “EMIT L2B Methane Enhancement Data 60 m V001,” [Data set]. NASA EOSDIS ...
2023 doi
-
[28]
Rapid spectral cloud screening onboard aircraft and spacecraft,
D. R. Thompson, R. O. Green, D. Keymeulen, S. K. Lundeen, Y . Mouradi, D. C. Nunes, R. Casta˜no, and S. A. Chien, “Rapid spectral cloud screening onboard aircraft and spacecraft,” IEEE Transactions on Geoscience and Remote Sensing , vol. 52, no. 11, 2014
2014
-
[29]
Making convolutional networks shift-invariant again,
R. Zhang, “Making convolutional networks shift-invariant again,” in International conference on machine learning. PMLR, 2019, pp. 7324– 7334
2019
-
[30]
Going deeper with convolutions,
C. Szegedy, W. Liu, Y . Jia, P. Sermanet, S. Reed, D. Anguelov, D. Erhan, V . Vanhoucke, and A. Rabinovich, “Going deeper with convolutions,” in Proceedings of the IEEE Conference on Computer Vision and Pattern Recognition, 2015
2015
-
[31]
A survey of transfer learning,
K. Weiss, T. M. Khoshgoftaar, and D. Wang, “A survey of transfer learning,” Journal of Big Data , vol. 3, no. 1, 2016
2016
-
[32]
Feature extraction by using deep learning: A survey,
S. Dara and P. Tumma, “Feature extraction by using deep learning: A survey,” in 2018 Second International Conference on Electronics, Communication and Aerospace Technology (ICECA) , 2018
2018
-
[33]
How transferable are features in deep neural networks?
J. Yosinski, J. Clune, Y . Bengio, and H. Lipson, “How transferable are features in deep neural networks?” Advances in Neural Information Processing Systems, vol. 27, 2014
2014
-
[34]
Generative adversarial networks,
I. Goodfellow, J. Pouget-Abadie, M. Mirza, B. Xu, D. Warde-Farley, S. Ozair, A. Courville, and Y . Bengio, “Generative adversarial networks,” Communications of the ACM , vol. 63, no. 11, 2020
2020
-
[35]
Generative adversarial networks: An overview,
A. Creswell, T. White, V . Dumoulin, K. Arulkumaran, B. Sengupta, and A. A. Bharath, “Generative adversarial networks: An overview,” IEEE Signal Processing Magazine , vol. 35, no. 1, 2018
2018
-
[36]
Unpaired image-to-image translation using cycle-consistent adversarial networks,
J.-Y . Zhu, T. Park, P. Isola, and A. A. Efros, “Unpaired image-to-image translation using cycle-consistent adversarial networks,” in Proceedings of the IEEE International Conference on Computer Vision , 2017
2017
-
[37]
Image-to-image translation with conditional adversarial networks,
P. Isola, J.-Y . Zhu, T. Zhou, and A. A. Efros, “Image-to-image translation with conditional adversarial networks,” in Proceedings of the IEEE Conference on Computer Vision and Pattern Recognition , 2017
2017
-
[38]
Least squares generative adversarial networks,
X. Mao, Q. Li, H. Xie, R. Y . Lau, Z. Wang, and S. Paul Smolley, “Least squares generative adversarial networks,” in Proceedings of the IEEE International Conference on Computer Vision , 2017
2017
-
[39]
Improved training of wasserstein gans,
I. Gulrajani, F. Ahmed, M. Arjovsky, V . Dumoulin, and A. C. Courville, “Improved training of wasserstein gans,” Advances in Neural Informa- tion Processing Systems , vol. 30, 2017
2017
-
[40]
Quantifying methane point sources from fine-scale satellite observations of atmospheric methane plumes,
D. J. Varon, D. J. Jacob, J. McKeever, D. Jervis, B. O. Durak, Y . Xia, and Y . Huang, “Quantifying methane point sources from fine-scale satellite observations of atmospheric methane plumes,” Atmospheric Measurement Techniques, vol. 11, no. 10, 2018
2018
-
[41]
A Statistical Evaluation of WRF-LES Trace Gas Dispersion Using Project Prairie Grass Measurements,
A. Rybchuk, C. B. Alden, J. K. Lundquist, and G. B. Rieker, “A Statistical Evaluation of WRF-LES Trace Gas Dispersion Using Project Prairie Grass Measurements,” Monthly Weather Review, vol. 149, no. 5, 2021
2021
-
[42]
Evaluating the detectability of methane point sources from satellite observing systems using microscale model- ing,
P. Bhardwaj, R. Kumar, D. A. Mitchell, C. A. Randles, N. Downey, D. Blewitt, and B. Kosovic, “Evaluating the detectability of methane point sources from satellite observing systems using microscale model- ing,” Scientific Reports, vol. 12, no. 1, 2022
2022
Reviewed August 7, 2026 · model on record in the stance chip above.
Discussion (0). Continue with ORCID to comment.