REVIEW 4 major objections 5 minor 60 references
Real-Time Decorrelation-Based Anomaly Detection for Multivariate Time Series
T0 review · 4 major / 5 minor · reviewed 2026-08-06 · deepseek-v4-flash
Pith's one-line read A decorrelation matrix updated sample by sample can flag anomalies in real time.
desk verdict Plausible streaming detector with public code, but the headline claim of real-time multivariate time-series superiority is not backed by the actual benchmark, which is tabular and order-dependent. read the letter →
The pith
A machine-rendered reading of the paper's core claim, the machinery that carries it, and where it could break.
The reading
What carries the argument
The load-bearing object is the online decorrelation matrix $R \in \mathbb{R}^{d\times d}$, a trainable transformation that removes feature correlations so that the decorrelated input $\hat{x}_t = x_t R_t^{\top}$ has near-diagonal second moments. It is updated at every step by $R_t \leftarrow R_{t-1} - \frac{\eta}{(p+1)(d-1)} \big((\hat{x}_{t-p:t}^{\top}\hat{x}_{t-p:t}) - \operatorname{diag}(\hat{x}_{t-p:t}^{\top}\hat{x}_{t-p:t})\big) R_{t-1}$, with $\hat{x}_{t-p:t}$ the current and optionally past $p$ samples. The argument runs through this matrix because the anomaly score is not a distance in input space but the magnitude of the matrix's own change, $\|R_t\|-\|R_{t-1}\|$, smoothed by a momentum term with factor $\gamma=0.25$. The optional temporal window $p$ and the automated burn-in phase that selects the learning rate $\eta$ by measuring residual correlation are supporting mechanisms that stabilize this score.
What would settle it
Feed a long stream drawn from a fixed multivariate Gaussian with a constant covariance matrix and no anomalies into DAD with the recommended learning-rate grid, and record the score $s_t$. If the smoothed score shows large spikes or a sustained upward drift while the data-generating process is stationary, the central claim fails; the same experiment on a normal stream should also show that $R_t$ converges to a fixed point rather than wandering.
Extended reading notes
Core claim
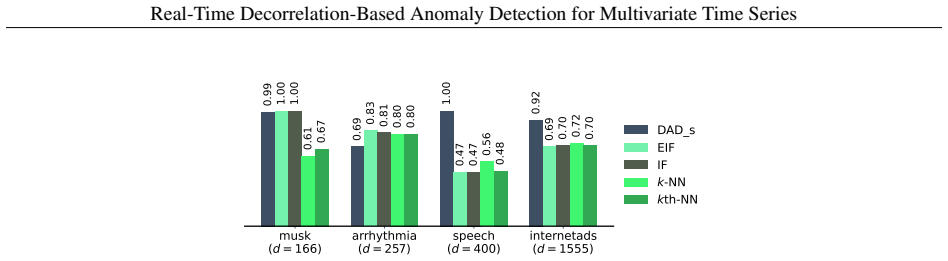
The paper's central claim is that a single-pass online decorrelation matrix can serve as the anomaly detector itself. The algorithm maintains $R \in \mathbb{R}^{d\times d}$, updates it sample by sample with the rule from Eq. (2), and scores each new observation by the smoothed absolute change in the matrix's Frobenius norm, $s_t = (1-\gamma)s_{t-1} + \gamma\,|\,\|R_t\|-\|R_{t-1}\|\,|$. An anomaly is a point at which the learned feature interrelations break down, forcing a large reorientation of $R$ and hence a jump in the score. On 50 real-world benchmark datasets the windowed configuration DAD_s achieves the top AUC on 22 datasets and the highest mean AUC (0.8027) among the 15 compared methods, and the paper reports that this holds on both local and global anomaly clusters while remaining robust as dimensionality grows.
Load-bearing premise
The load-bearing premise is that the online update converges to a stable representation of normal data, so that large jumps in the matrix norm occur only at genuine changes in the correlation structure; if $R$ keeps oscillating or drifting under a stationary normal stream, the score is uncalibrated noise.
Editorial extensions
If this is right
- If the central claim is right, real-time anomaly detection on a $d$-dimensional stream reduces to maintaining one $d\times d$ matrix and computing a single norm difference per step, with no stored history and memory independent of stream length.
- The windowed variant DAD_s, which allows one past sample ($p\in\{0,1\}$), is the configuration that reaches the top AUC on 22 of 50 real benchmark datasets and the highest mean AUC, 0.8027.
- Because the matrix and its update scale with $d$, the method's per-step cost stays polynomial in the number of features, matching the reported high-dimensional results on datasets with hundreds to thousands of features.
- The automated variant DAD_Auto removes manual learning-rate selection during a burn-in phase, so practitioners can deploy the detector without a labeled grid search.
Reading between the lines
- A natural extension the paper leaves implicit is to treat a sustained reorientation of $R$ over several steps as a change-point statistic for covariate shift, rather than only a single-step anomaly score; the authors gesture at this in the discussion but do not formalize it.
- The Frobenius-norm difference discards directional information, so two matrices with equal norms but different eigenspaces would produce the same score; a spectral or subspace-angle variant might catch such rotations, which the paper does not test.
- The tuning protocol assumes a small labeled subset is available; a direct check would be to ablate the Jensen-Shannon-divergence-based downsampling ratio and see how much tuning quality depends on the chosen subset size.
- An immediate empirical validation beyond the paper: compare the learning rate chosen by DAD_Auto's correlation-minimization criterion with the grid's peak-AUC learning rate on each dataset, to see when the heuristic and the detection objective coincide.
Editorial analysis
A structured set of objections, weighed in public.
Referee Report
Summary. The paper proposes DAD, an online anomaly detection method for multivariate time series based on a decorrelation learning rule adapted from [39]. At each time step, DAD updates a decorrelation matrix R_t using the current and (optionally) past few samples (Eqs. (2) and (4)), then assigns an anomaly score from the absolute change in the Frobenius norm of R_t, smoothed by a momentum term (Eq. (3)). The method is single-pass and stores only the d×d matrix. The authors claim superior performance on 20 synthetic datasets and 50 real-world tabular datasets, report runtime comparisons, and propose a hyperparameter tuning strategy that selects a representative labeled validation subset. They also describe an automated variant (Algorithm 2) that chooses the learning rate from unlabeled burn-in data.
Significance. If the central claim holds, DAD would be a practically attractive detector: constant memory, O(d^2) per-step updates, no storage of historical samples, and competitive AUC on a wide benchmark. The paper ships a public code repository, reports wall-clock times, and follows a structured experimental protocol, which are strengths. The potential significance is real, especially for edge-device deployment, but the current manuscript does not establish why the specific decorrelation-jump score should work, and the main real-world evaluation is on tabular data without temporal order. The synthetic results largely measure whether DAD can detect correlation-structure shifts, which are the exact signal it is designed to track.
major comments (4)
- [Section 3.2, Eqs. (2)–(3)] The anomaly score is defined as the momentum-smoothed absolute change in the Frobenius norm of R_t. This is a heuristic that inherits all its justification from the decorrelation update rule, yet no convergence, stability, or calibration analysis of R_t is provided. The paper itself states that scores cannot be trusted until R_t converges, but never shows that R_t converges on stationary normal data or that its norm is monotone under normal conditions. If R_t keeps drifting or oscillating at a rate comparable to anomaly-induced changes, the score is uncalibrated noise. Please provide at least a theoretical characterization of the expected norm dynamics under i.i.d. or stationary normal inputs, or a controlled experiment showing that the norm is stable on non-anomalous streams.
- [Section 3.5 and Table A.1] The real-world validation is performed on 50 tabular datasets from [1]. DAD is inherently sequential: every score at time t depends on all previous rows through the recurrent update of R_t. For tabular data the row order is not temporal and may be arbitrary or sorted; for small datasets (80–200 rows) the online trajectory of R_t can vary strongly with permutation. The paper reports one AUC per dataset with no shuffle-invariance analysis, and DAMADICS is used only for visual comparison, not for quantitative benchmarking. Therefore the central claim of real-time multivariate time-series detection is not directly supported. Please add permutation tests on a subset of these datasets, or switch the main real-world benchmark to genuinely temporal multivariate datasets.
- [Section 3.4.1 and Section 4.1] The synthetic data is generated by switching covariance or correlation strength at predefined points (Algorithms 4–5). These are precisely the signals that DAD's score is designed to capture, and the synthetic-only comparison (mean AUC ≈ 0.97 vs. ≈ 0.80 for MCD) is therefore an expected outcome rather than evidence of general robustness. Only one of the 20 scenarios (L11) involves a mean shift without correlation change. Please include a broader family of synthetic anomalies (variance shifts, mean shifts, transient spikes, non-Gaussian contamination) and report per-scenario AUC, to show that DAD does not simply detect correlation switches that other methods are not aiming at.
- [Section 3.3 and Eq. (5)] The main real-world results tune the learning rate η (as well as all other methods' hyperparameters) on a labeled downsampled subset of each dataset, and then evaluate on the full dataset. Since the validation subset is drawn from the same dataset that is later scored, this is a form of test-set tuning, and the reported AUCs reflect this favorable condition. The paper frames DAD as an unsupervised method, but the quantitative comparisons in Table 3 and Figure 7 rely on supervised subset tuning. The automated variant (Algorithm 2) is label-free but is only evaluated in Appendix C with lower performance. Please clearly separate unsupervised operation (e.g., DAD_Auto) from tuned-supervision operation in the main results, or justify why the tuned numbers are a fair representation of the method's real-time capabilities.
minor comments (5)
- [Algorithm 1 and Eq. (4)] The notation in Algorithm 1, line 6, uses x_{t-p:t}R_{t-1}^T directly, while Eq. (4) uses \hat{x}_{t-p:t}; please define \hat{x} consistently and ensure the dimensions in the algorithm match the equation.
- [Eq. (6)] In the definition of the percentage of maximum AUC, the denominator uses max_{M' in M}, but M denotes both a method and the set of methods; please rename the set, e.g., \mathcal{M}, to avoid confusion.
- [Section 4.2.2] The wall-clock comparison states that other methods were timed on preloaded datasets while DAD was timed under streaming feed; please specify whether the implementation for other methods also avoided per-sample Python overhead, since this affects the fairness of the normalized runtime comparison.
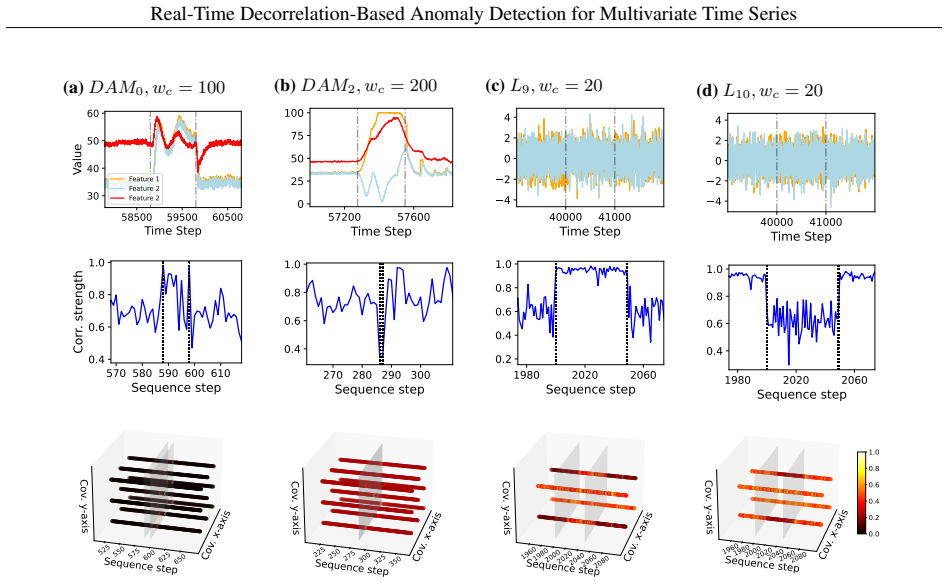
- [Section 4.1.1, Figure 6 caption] The caption says the plot shows the Frobenius norm of R with respect to each feature's update, but Eq. (3) uses the norm of the full matrix R_t; please clarify what is actually plotted in each panel.
- [Table A.1] For the smtp dataset the contamination ratio is reported as 0.0 although there are 30 outliers; please round to a non-zero value or explain the omission.
Circularity Check
Synthetic validation is self-definitional: anomalies are defined as covariance/correlation shifts, which is exactly the signal DAD scores; the real-world benchmark additionally tunes hyperparameters on a subset of the same data used for final AUC.
-
self definitional
[Section 3.2, Eq. (3); Section 3.4.1 (Synthetic Data Generation)]
"This transition from a background pattern to a temporal pattern alters the interrelation of the data, which is interpreted as abnormal behavior."
DAD's anomaly score (Eq. 3) is s_t = (1−γ)s_{t−1} + γ|∥R_t∥ − ∥R_{t−1}∥|, where R_t is updated from the empirical covariance/correlation of the input window (Eqs. 2 and 4). The synthetic ground-truth anomalies are generated by switching the covariance matrix (Algorithm 4) or the correlation strength (Algorithm 5) at the labeled window, i.e., by altering the interrelation of the features. Thus the labeled abnormal window is, by construction, a period in which the very quantity measured by the score changes. The high synthetic AUC is therefore a consistency check between the label generator and the score definition, not an independent confirmation that correlation shifts are anomalies.
-
fitted input called prediction
[Section 3.3, Eq. (5); Section 3.5.1 (Benchmark Setup)]
"Next, we used Eq. (5) to identify the optimal hyperparameter for each method-dataset combination based on the selected subset, where the quality criterion q is AUC. Finally, AUC is computed for each method using the full dataset."
The subset D*_j used for tuning is obtained by downsampling the same dataset D_j (Algorithm 3), so the full dataset on which final AUC is computed contains the tuning subset. Optimizing η on D*_j and then reporting AUC on D_j means the reported performance is not an independent holdout prediction; part of the advantage attributed to DAD_s reflects hyperparameters selected using labels from the evaluation data itself. Although all baselines receive the same tuning protocol, the full-dataset AUC is statistically tied to the fitted hyperparameters rather than being a parameter-free prediction.
full rationale
The central synthetic result reduces by construction: DAD's score is defined as the magnitude of change in an online decorrelation matrix, and the synthetic anomalies are generated precisely by changing the covariance/correlation structure. High AUC on those datasets is therefore a consistency check between the label generator and the score definition, not an independent validation of the hypothesis that correlation shifts are anomalies. The real-world benchmark provides some independent content, but the per-dataset hyperparameter tuning uses a downsampled subset of the same dataset and the final AUC is computed on the full dataset, so the reported performance is partly a fitted-hyperparameter artifact rather than a holdout prediction. The self-citation of the decorrelation update rule from prior work by the same group is not by itself circular, because the paper adopts the rule as an explicit assumption and tests it empirically; however, convergence of the online update is never proven. The tabular real-world datasets are not temporally ordered, which is a validity threat to the time-series claim but not a circularity concern. Overall, the synthetic 'prediction' is forced by construction, yielding a partial circularity score of 6.
Assumptions & free parameters
free parameters (5)
- learning rate eta =
per dataset, selected from 0.8, 0.2, 0.08, ..., 2e-6
- momentum factor gamma =
0.25 (fixed)
- temporal window size p =
0 or 1
- exploration length n =
50 (suggested minimum)
- histogram bins B =
20
assumptions (4)
- domain assumption The decorrelation update rule of Ahmad et al. [39] decorrelates inputs and converges for streaming data.
- domain assumption Anomalies are rare and normal samples form the majority, so the decorrelation matrix converges to the normal correlation structure.
- ad hoc to paper The Frobenius-norm jump | ||Rt|| - ||Rt-1|| | is a valid anomaly score.
- domain assumption A labeled downsampled subset whose histogram is close to the full dataset by Jensen-Shannon divergence yields hyperparameters that generalize to the full dataset.
Cite this review
Pith. "Pith review of Real-Time Decorrelation-Based Anomaly Detection for Multivariate Time Series." pith.science (2026). https://pith.science/paper/JLVDSXJH
@misc{pith2026250707559,
  author       = {Pith},
  title        = {Pith review of: Real-Time Decorrelation-Based Anomaly Detection for Multivariate Time Series},
  year         = {2026},
  howpublished = {\url{https://pith.science/paper/JLVDSXJH}},
  note         = {Machine review of arXiv:2507.07559}
}
read the original abstract
Anomaly detection (AD) plays a vital role across a wide range of real-world domains by identifying data instances that deviate from expected patterns, potentially signaling critical events such as system failures, fraudulent activities, or rare medical conditions. The demand for real-time AD has surged with the rise of the (Industrial) Internet of Things, where massive volumes of multivariate sensor data must be processed instantaneously. Real-time AD requires methods that not only handle high-dimensional streaming data but also operate in a single-pass manner, without the burden of storing historical instances, thereby ensuring minimal memory usage and fast decision-making. We propose DAD, a novel real-time decorrelation-based anomaly detection method for multivariate time series, based on an online decorrelation learning approach. Unlike traditional proximity-based or reconstruction-based detectors that process entire data or windowed instances, DAD dynamically learns and monitors the correlation structure of data sample by sample in a single pass, enabling efficient and effective detection. To support more realistic benchmarking practices, we also introduce a practical hyperparameter tuning strategy tailored for real-time anomaly detection scenarios. Extensive experiments on widely used benchmark datasets demonstrate that DAD achieves the most consistent and superior performance across diverse anomaly types compared to state-of-the-art methods. Crucially, its robustness to increasing dimensionality makes it particularly well-suited for real-time, high-dimensional data streams. Ultimately, DAD not only strikes an optimal balance between detection efficacy and computational efficiency but also sets a new standard for real-time, memory-constrained anomaly detection.
Figures


Figures from the paper (7 more)




Reference graph
Works this paper leans on
-
[39]
Constrained Parameter Inference as a Principle for Learning
N. Ahmad, E. Schrader, and M. van Gerven, “Constrained parameter inference as a principle for learning,” arXiv preprint arXiv:2203.13203, 2022
work page Pith review arXiv 2022
-
[1]
Unsupervised anomaly detection algorithms on real-world data: how many do we need?,
R. Bouman, Z. Bukhsh, and T. Heskes, “Unsupervised anomaly detection algorithms on real-world data: how many do we need?,” Journal of Machine Learning Research, vol. 25, no. 105, pp. 1–34, 2024
work page 2024
-
[2]
Real time anomaly detection and categorisation,
A. T. Fisch, L. Bardwell, and I. A. Eckley, “Real time anomaly detection and categorisation,” Statistics and Computing, vol. 32, no. 4, p. 55, 2022
work page 2022
-
[3]
A review on soft sensors for monitoring, control, and optimization of industrial processes,
Y . Jiang, S. Yin, J. Dong, and O. Kaynak, “A review on soft sensors for monitoring, control, and optimization of industrial processes,” IEEE Sensors Journal, vol. 21, no. 11, pp. 12868–12881, 2021
work page 2021
-
[4]
S. Jeschke, C. Brecher, T. Meisen, D. Özdemir, and T. Eschert,Industrial Internet of Things and Cyber Manufac- turing Systems, pp. 3–19. Springer Cham, 2017
work page 2017
-
[5]
Real-time deep anomaly detection framework for multivariate time-series data in industrial IoT,
H. Nizam, S. Zafar, Z. Lv, F. Wang, and X. Hu, “Real-time deep anomaly detection framework for multivariate time-series data in industrial IoT,” IEEE Sensors Journal, vol. 22, no. 23, pp. 22836–22849, 2022
work page 2022
-
[6]
Internet of things in the context of industry 4.0: An overview,
G. Lampropoulos, K. Siakas, and T. Anastasiadis, “Internet of things in the context of industry 4.0: An overview,” International Journal of Entrepreneurial Knowledge, vol. 7, no. 1, 2019
work page 2019
-
[7]
Smart factory of industry 4.0: Key technologies, application case, and challenges,
B. Chen, J. Wan, L. Shu, P. Li, M. Mukherjee, and B. Yin, “Smart factory of industry 4.0: Key technologies, application case, and challenges,” IEEE Access, vol. 6, pp. 6505–6519, 2017
work page 2017
Show all 60 references
-
[8]
Enabling industrial IoT as a service with multi-access edge computing,
D. Borsatti, G. Davoli, W. Cerroni, and C. Raffaelli, “Enabling industrial IoT as a service with multi-access edge computing,” IEEE Communications Magazine, vol. 59, no. 8, pp. 21–27, 2021
2021
-
[9]
Towards communication-efficient and attack- resistant federated edge learning for industrial internet of things,
Y . Liu, R. Zhao, J. Kang, A. Yassine, D. Niyato, and J. Peng, “Towards communication-efficient and attack- resistant federated edge learning for industrial internet of things,” ACM Transactions on Internet Technology (TOIT), vol. 22, no. 3, pp. 1–22, 2021
2021
-
[10]
ADBench: anomaly detection benchmark,
S. Han, X. Hu, H. Huang, M. Jiang, and Y . Zhao, “ADBench: anomaly detection benchmark,” inProceedings of the 36th International Conference on Neural Information Processing Systems, NIPS ’22, Curran Associates Inc., 2022
2022
-
[11]
Unsupervised real-time anomaly detection for streaming data,
S. Ahmad, A. Lavin, S. Purdy, and Z. Agha, “Unsupervised real-time anomaly detection for streaming data,” Neurocomputing, vol. 262, pp. 134–147, 2017
2017
-
[12]
Dive into time-series anomaly detection: A decade review,
P. Boniol, Q. Liu, M. Huang, T. Palpanas, and J. Paparrizos, “Dive into time-series anomaly detection: A decade review,”arXiv preprint arXiv:2412.20512, 2024
2024 arXiv
-
[13]
A comprehensive survey of numeric and symbolic outlier mining techniques,
M. Agyemang, K. Barker, and R. Alhajj, “A comprehensive survey of numeric and symbolic outlier mining techniques,” Intelligent Data Analysis, vol. 10, no. 6, pp. 521–538, 2006
2006
-
[14]
Big IoT data analytics: architecture, opportunities, and open research challenges,
M. Marjani, F. Nasaruddin, A. Gani, A. Karim, I. A. T. Hashem, A. Siddiqa, and I. Yaqoob, “Big IoT data analytics: architecture, opportunities, and open research challenges,” IEEE access, vol. 5, pp. 5247–5261, 2017. 23 Real-Time Decorrelation-Based Anomaly Detection for Multi...
2017
-
[15]
A review of deep learning models for time series prediction,
Z. Han, J. Zhao, H. Leung, K. F. Ma, and W. Wang, “A review of deep learning models for time series prediction,” IEEE Sensors Journal, vol. 21, no. 6, pp. 7833–7848, 2019
2019
-
[16]
25 years of time series forecasting,
J. G. De Gooijer and R. J. Hyndman, “25 years of time series forecasting,” International Journal of Forecasting, vol. 22, no. 3, pp. 443–473, 2006
2006
-
[17]
Algorithms for mining distancebased outliers in large datasets,
E. M. Knox and R. T. Ng, “Algorithms for mining distancebased outliers in large datasets,” inProceedings of the International Conference on Very Large Data Bases, pp. 392–403, Citeseer, 1998
1998
-
[18]
Distance-based outliers: algorithms and applications,
E. M. Knorr, R. T. Ng, and V . Tucakov, “Distance-based outliers: algorithms and applications,”The VLDB Journal, vol. 8, no. 3, pp. 237–253, 2000
2000
-
[19]
Efficient algorithms for mining outliers from large data sets,
S. Ramaswamy, R. Rastogi, and K. Shim, “Efficient algorithms for mining outliers from large data sets,” in Proceedings of the 2000 ACM SIGMOD International Conference on Management of Data, pp. 427–438, 2000
2000
-
[20]
A comprehensive survey of anomaly detection algorithms,
D. Samariya and A. Thakkar, “A comprehensive survey of anomaly detection algorithms,”Annals of Data Science, vol. 10, no. 3, pp. 829–850, 2023
2023
-
[21]
LOF: identifying density-based local outliers,
M. M. Breunig, H.-P. Kriegel, R. T. Ng, and J. Sander, “LOF: identifying density-based local outliers,” in Proceedings of the 2000 ACM SIGMOD International Conference on Management of Data , SIGMOD ’00, p. 93–104, Association for Computing Machinery, 2000
2000
-
[22]
Enhancing effectiveness of outlier detections for low density patterns,
J. Tang, Z. Chen, A. W.-C. Fu, and D. W. Cheung, “Enhancing effectiveness of outlier detections for low density patterns,” in Advances in Knowledge Discovery and Data Mining: 6th Pacific-Asia conference, PAKDD 2002 Taipei, Taiwan, May 6–8, 2002 proceedings 6, pp. 535–548, Spri...
2002
-
[23]
Anomaly detection: A survey,
V . Chandola, A. Banerjee, and V . Kumar, “Anomaly detection: A survey,”ACM Computing Surveys (CSUR), vol. 41, no. 3, pp. 1–58, 2009
2009
-
[24]
Deep one-class classification,
L. Ruff, R. Vandermeulen, N. Goernitz, L. Deecke, S. A. Siddiqui, A. Binder, E. Müller, and M. Kloft, “Deep one-class classification,” in International Conference on Machine Learning, pp. 4393–4402, PMLR, 2018
2018
-
[25]
A review of tree-based approaches for anomaly detection,
T. Barbariol, F. D. Chiara, D. Marcato, and G. A. Susto, “A review of tree-based approaches for anomaly detection,” Control Charts and Machine Learning for Anomaly Detection in Manufacturing, pp. 149–185, 2022
2022
-
[26]
Unsupervised anomaly detection for IOT-based multivariate time series: Existing solutions, performance analysis and future directions,
M. A. Belay, S. S. Blakseth, A. Rasheed, and P. Salvo Rossi, “Unsupervised anomaly detection for IOT-based multivariate time series: Existing solutions, performance analysis and future directions,” Sensors, vol. 23, no. 5, p. 2844, 2023
2023
-
[27]
Isolation forest,
F. T. Liu, K. M. Ting, and Z.-H. Zhou, “Isolation forest,” in2008 Eighth IEEE International Conference On Data Mining, pp. 413–422, IEEE, 2008
2008
-
[28]
Extended isolation forest,
S. Hariri, M. C. Kind, and R. J. Brunner, “Extended isolation forest,” IEEE Transactions on Knowledge and Data Engineering, vol. 33, no. 4, pp. 1479–1489, 2021
2021
-
[29]
C. C. Aggarwal et al., Data mining: the textbook, vol. 1. Springer, 2015
2015
-
[30]
Minimal infrequent pattern based approach for mining outliers in data streams,
C. S. Hemalatha, V . Vaidehi, and R. Lakshmi, “Minimal infrequent pattern based approach for mining outliers in data streams,” Expert Systems with Applications, vol. 42, no. 4, pp. 1998–2012, 2015
1998
-
[31]
Mifi-outlier: Minimal infrequent itemset-based outlier detection approach on uncertain data stream,
S. Cai, S. Li, G. Yuan, S. Hao, and R. Sun, “Mifi-outlier: Minimal infrequent itemset-based outlier detection approach on uncertain data stream,” Knowledge-Based Systems, vol. 191, p. 105268, 2020
2020
-
[32]
On-line anomaly detection with high accuracy,
K. Xie, X. Li, X. Wang, J. Cao, G. Xie, J. Wen, D. Zhang, and Z. Qin, “On-line anomaly detection with high accuracy,”IEEE/ACM Transactions on Networking, vol. 26, no. 3, pp. 1222–1235, 2018
2018
-
[33]
Anomaly detection via online oversampling principal component analysis,
Y .-J. Lee, Y .-R. Yeh, and Y .-C. F. Wang, “Anomaly detection via online oversampling principal component analysis,” IEEE Transactions on Knowledge and Data Engineering, vol. 25, no. 7, pp. 1460–1470, 2013
2013
-
[34]
Threaded ensembles of autoencoders for stream learning,
Y . Dong and N. Japkowicz, “Threaded ensembles of autoencoders for stream learning,”Computational Intelligence, vol. 34, no. 1, pp. 261–281, 2018
2018
-
[35]
Sliding window-based fault detection from high-dimensional data streams,
L. Zhang, J. Lin, and R. Karim, “Sliding window-based fault detection from high-dimensional data streams,”IEEE Transactions on Systems, Man, and Cybernetics: Systems, vol. 47, no. 2, pp. 289–303, 2016
2016
-
[36]
Schubert, Generalized and efficient outlier detection for spatial, temporal, and high-dimensional data mining
E. Schubert, Generalized and efficient outlier detection for spatial, temporal, and high-dimensional data mining. PhD thesis, lmu, 2013
2013
-
[37]
A survey of outlier detection in high dimensional data streams,
I. Souiden, M. N. Omri, and Z. Brahmi, “A survey of outlier detection in high dimensional data streams,”Computer Science Review, vol. 44, p. 100463, 2022
2022
-
[38]
A fast algorithm for the minimum covariance determinant estimator,
P. J. Rousseeuw and K. V . Driessen, “A fast algorithm for the minimum covariance determinant estimator,” Technometrics, vol. 41, no. 3, pp. 212–223, 1999. 24 Real-Time Decorrelation-Based Anomaly Detection for Multivariate Time Series
1999
-
[40]
Correlations are ruining your gradient descent,
N. Ahmad, “Correlations are ruining your gradient descent,” arXiv preprint arXiv:2407.10780, 2024
2024 arXiv
-
[41]
Machine learning-based real-time anomaly detection using data pre-processing in the telemetry of server farms,
D. L. Vajda, T. V . Do, T. Bérczes, and K. Farkas, “Machine learning-based real-time anomaly detection using data pre-processing in the telemetry of server farms,” Scientific Reports, vol. 14, no. 1, p. 23288, 2024
2024
-
[42]
The effect of hyperparameter tuning on the comparative evaluation of unsupervised anomaly detection methods,
J. Soenen, E. Van Wolputte, L. Perini, V . Vercruyssen, W. Meert, J. Davis, and H. Blockeel, “The effect of hyperparameter tuning on the comparative evaluation of unsupervised anomaly detection methods,” inProceedings of the KDD’21 Workshop on Outlier Detection and Description...
2021
-
[43]
Detecting semantic anomalies,
F. Ahmed and A. Courville, “Detecting semantic anomalies,” in Proceedings of the AAAI Conference on Artificial Intelligence, vol. 34, pp. 3154–3162, 2020
2020
-
[44]
Pidforest: anomaly detection via partial identification,
P. Gopalan, V . Sharan, and U. Wieder, “Pidforest: anomaly detection via partial identification,” Advances in Neural Information Processing Systems, vol. 32, 2019
2019
-
[45]
Temporal anomaly detection: calibrating the surprise,
E. Gutflaish, A. Kontorovich, S. Sabato, O. Biller, and O. Sofer, “Temporal anomaly detection: calibrating the surprise,” in Proceedings of the AAAI Conference on Artificial Intelligence, vol. 33, pp. 3755–3762, 2019
2019
-
[46]
Benchmarking unsupervised outlier detection with realistic synthetic data,
G. Steinbuss and K. Böhm, “Benchmarking unsupervised outlier detection with realistic synthetic data,” ACM Transactions on Knowledge Discovery from Data (TKDD), vol. 15, no. 4, pp. 1–20, 2021
2021
-
[47]
One-class active learning for outlier detection with multiple subspaces,
H. Trittenbach and K. Böhm, “One-class active learning for outlier detection with multiple subspaces,” in Proceedings of the 28th ACM International Conference on Information and Knowledge Management, pp. 811–820, 2019
2019
-
[48]
Active learning of SVDD hyperparameter values,
H. Trittenbach, K. Böhm, and I. Assent, “Active learning of SVDD hyperparameter values,” in2020 IEEE 7th International Conference on Data Science and Advanced Analytics (DSAA), pp. 109–117, IEEE, 2020
2020
-
[49]
On the evaluation of unsupervised outlier detection: measures, datasets, and an empirical study,
G. O. Campos, A. Zimek, J. Sander, R. J. Campello, B. Micenková, E. Schubert, I. Assent, and M. E. Houle, “On the evaluation of unsupervised outlier detection: measures, datasets, and an empirical study,”Data Mining and Knowledge Discovery, vol. 30, pp. 891–927, 2016
2016
-
[50]
Pattern-based anomaly detection in mixed-type time series,
L. Feremans, V . Vercruyssen, B. Cule, W. Meert, and B. Goethals, “Pattern-based anomaly detection in mixed-type time series,” in Machine Learning and Knowledge Discovery in Databases: European Conference, ECML PKDD 2019, pp. 240–256, Springer, 2020
2019
-
[51]
Deep anomaly detection using geometric transformations,
I. Golan and R. El-Yaniv, “Deep anomaly detection using geometric transformations,” Advances in Neural Information Processing Systems, vol. 31, 2018
2018
-
[52]
Multi-view anomaly detection via robust probabilistic latent variable models,
T. Iwata and M. Yamada, “Multi-view anomaly detection via robust probabilistic latent variable models,”Advances in Neural Information Processing Systems, vol. 29, 2016
2016
-
[53]
Deep semi-supervised anomaly detection,
L. Ruff, R. A. Vandermeulen, N. Görnitz, A. Binder, E. Müller, K.-R. Müller, and M. Kloft, “Deep semi-supervised anomaly detection,” arXiv preprint arXiv:1906.02694, 2019
1906 arXiv
-
[54]
EWMA model based shift-detection methods for detecting covariate shifts in non-stationary environments,
H. Raza, G. Prasad, and Y . Li, “EWMA model based shift-detection methods for detecting covariate shifts in non-stationary environments,” Pattern Recognition, vol. 48, no. 3, pp. 659–669, 2015
2015
-
[55]
Unsupervised detection of covariate shift due to changes in EEG headset position: Towards an effective out-of-lab use of passive brain–computer interface,
D. Germano, N. Sciaraffa, V . Ronca, A. Giorgi, G. Trulli, G. Borghini, G. Di Flumeri, F. Babiloni, and P. Aricò, “Unsupervised detection of covariate shift due to changes in EEG headset position: Towards an effective out-of-lab use of passive brain–computer interface,” Applie...
2023
-
[56]
Evaluating latent space robustness and uncertainty of EEG-ML models under realistic distribution shifts,
N. Wagh, J. Wei, S. Rawal, B. M. Berry, and Y . Varatharajah, “Evaluating latent space robustness and uncertainty of EEG-ML models under realistic distribution shifts,” in Advances in Neural Information Processing Systems (S. Koyejo, S. Mohamed, A. Agarwal, D. Belgrave, K. Cho...
2022
-
[57]
Damadics benchmark
IAIR Warsaw University of Technology, “Damadics benchmark.” https://iair.mchtr.pw.edu.pl/Damadics, 2002. Accessed: 2025-06-23
2002
-
[58]
A comparative evaluation of unsupervised anomaly detection algorithms for multivariate data,
M. Goldstein and S. Uchida, “A comparative evaluation of unsupervised anomaly detection algorithms for multivariate data,” PLOS ONE, vol. 11, no. 4, pp. 1–31, 2016
2016
-
[59]
A comparison of outlier detection techniques for high-dimensional data,
X. Xu, H. Liu, L. Li, and M. Yao, “A comparison of outlier detection techniques for high-dimensional data,” International Journal of Computational Intelligence Systems, vol. 11, no. 1, pp. 652–662, 2018
2018
-
[60]
Pyod: A python toolbox for scalable outlier detection,
Y . Zhao, Z. Nasrullah, and Z. Li, “Pyod: A python toolbox for scalable outlier detection,”Journal of Machine Learning Research, vol. 20, no. 96, pp. 1–7, 2019. 25 Real-Time Decorrelation-Based Anomaly Detection for Multivariate Time Series A Hyperparameter Tuning-based Benchm...
2019
Reviewed August 6, 2026 · model on record in the stance chip above.
Discussion (0). Sign in to comment.