REVIEW 5 major objections 5 minor 46 references
Universal features of epidemic and vaccine models
T0 review · 5 major / 5 minor · reviewed 2026-08-06 · deepseek-v4-flash
Pith's one-line read Adding immigration to the SIS epidemic model and driving it with multiplicative noise produces a cusp point in the bifurcation diagram where the transition between unimodal and bimodal stationary distributions belongs to the mean-field…
desk verdict Solid mean-field analysis of stochastic SIS with immigration; the Ising-universality label needs support or rewording, and the vaccine-data fitting needs statistical fixes, but the core math is checkable and worth a serious referee. read the letter →
The pith
A machine-rendered reading of the paper's core claim, the machinery that carries it, and where it could break.
The reading
What carries the argument
The load-bearing object is the steady-state probability density $p_s(y)$ of the infected fraction, obtained in closed form from the Fokker-Planck equation, and its extremum equation $F(y_m)=0$. The extrema $y_m$ serve as the effective state variable; the number of maxima distinguishes unimodal from bimodal regimes. At the cusp, the Taylor expansion of $F$ around the inflection point $y_c=1/2-1/(6V)$ is cubic with no quadratic term, so it can be rescaled into the magnetic equation of state $h-\theta m-m^3/3=0$, making the cusp transition mean-field Ising-like. For vaccination, the threshold follows from the upper bifurcation line $V_R=2(1-1/R)$ combined with the line $R V_R = \sigma^2/\gamma$, giving $R_c=1+\sigma^2/(2\gamma)$. For vaccine hesitancy, the machinery is a two-state herding model whose continuum Fokker-Planck equation has as steady state the Beta distribution.
What would settle it
Compute from the Fokker-Planck equation the stationary mean infected fraction $\langle y\rangle$, its variance, and a response function as the cusp is approached along the tangential line with the reduced field $h=0$, and check whether $\langle y\rangle-y_c$ scales as $(-\theta)^{1/2}$ and the response diverges as $\theta^{-1}$ with the predicted amplitudes; if the moments do not show these power laws, the universality claim for the process is falsified even if the normal-form mapping holds.
Extended reading notes
Core claim
The central claim is that the stochastic SIS model with immigration, under multiplicative noise, has a critical-point transition at a cusp point of its $V$-versus-$R_0$ bifurcation diagram, and that this transition belongs to the mean-field Ising universality class. The order parameter is the location $y_m$ of the maximum of the steady-state probability density; expanding the extremum condition $F(y_m)=0$ around the inflection point $y_c$ removes the quadratic term and gives the Landau normal form $h-\theta m-m^3/3=0$, yielding exponents $\beta_c=1/2$, $\gamma_c=1$, and $\delta=3$. A secondary claim is that in the SIS model with vaccination and no immigration, the disease-free absorbing phase is reached when the effective reproduction number $R$ falls below $R_c=1+\sigma^2/(2\gamma)$, which is larger than the deterministic threshold $1$ and reduces the critical vaccination coverage by $\sigma^2/(2R_0\gamma)$. The paper further claims that the vaccine-hesitancy dynamics, modeled after an ant-colony herding process, has a Beta-distributed steady state for the vaccine-willing fraction, and that the same Beta distribution describes COVID-19 vaccine willingness and global vaccination data.
Load-bearing premise
The claim that the cusp transition is mean-field Ising rests on the assumption that the location of the maximum of the steady-state PDF, together with its cubic Taylor expansion near the inflection point, completely determines the critical behavior, while the paper never computes the actual moment-based order parameter or susceptibility of the stochastic process.
Editorial extensions
If this is right
- In the stochastic SIS model with immigration, the cusp transition has exponents $\beta_c=1/2$, $\gamma_c=1$, and $\delta=3$, so the noise intensity plays the role of temperature and the most probable infected fraction plays the role of magnetization.
- In the vaccination version without immigration, total disease eradication occurs when the effective reproduction number $R=R_0(1-q)$ falls below $R_c=1+\sigma^2/(2\gamma)$; the required vaccination coverage is therefore $q_c=1-1/R_0-\sigma^2/(2R_0\gamma)$, which is lower than the deterministic value.
- Even when $R>R_c$, all $R$-$V_R$ trajectories pass through regions of the bifurcation diagram where the steady-state PDF has a maximum at $y=0$, so there is a finite probability that the infection is eradicated.
- The vaccine-hesitancy model gives a Beta distribution for the fraction of vaccine-willing individuals, and the Beta distribution provides the best fit among the tested distributions for the 2022 COVID-19 vaccine and booster data and for global vaccination coverage data.
- When the vaccinated fraction is Beta-distributed, the effective reproduction number has a scaled Beta distribution, and the probability of a disease-free state is given by an incomplete Beta function ratio that increases as the vaccine-acceptance parameter grows relative to the hesitancy parameter.
Reading between the lines
- A decisive test of the Ising-universality claim, going beyond the paper, is to compute the stationary mean and variance of $y$ directly from the Fokker-Planck equation near the cusp; if the moment-based order parameter does not scale as $(-\theta)^{1/2}$, the universality class applies to the Landau normal form rather than to the stochastic process's observables.
- The threshold $R_c=1+\sigma^2/(2\gamma)$ suggests that environmental noise can partially substitute for vaccination, which an agent-based simulation with fluctuating transmission rates could test at the individual level.
- The ant-colony herding model gives a mechanistic origin for the empirically popular Beta prior in Bayesian vaccine studies; coupling the herding dynamics with the epidemic itself, so that the vaccinated fraction co-evolves with infections, is a natural extension.
- Because the cusp normal form is identical to that of the classic population-genetics noise model, the same argument should produce Ising-type criticality in other population and opinion dynamics with multiplicative noise and a linear immigration-like term.
Signed reviews
Editorial analysis
A structured set of objections, weighed in public.
Referee Report
Summary. The paper studies a stochastic SIS epidemic model with immigration and multiplicative noise. It derives the stationary Fokker-Planck probability density, the extrema equation F(y)=0, and the R0-V bifurcation diagram showing a cusp point. By Taylor-expanding the extrema equation around the inflection point and comparing with the mean-field Ising equation of state, it claims the cusp transition belongs to the mean-field Ising universality class with exponents beta_c=1/2, gamma_c=1, delta=3. The paper also analyzes vaccination: it finds a stochastic disease-elimination threshold Rc=1+sigma^2/(2gamma), proposes a Kirman-type vaccine-hesitancy model leading to a Beta stationary distribution, fits the Beta distribution to COVID-19 vaccine-willingness and vaccination-coverage data, and derives a distribution for the effective reproduction number under a Beta-distributed vaccinated fraction.
Significance. The analytic steady-state calculations are clean and the explicit connection between the SIS-with-immigration bifurcation diagram and the Horsthemke-Lefever model is a useful contribution. The threshold shift Rc = 1 + sigma^2/(2gamma) is a concrete, potentially testable prediction that goes beyond the deterministic result. However, the universal-features claim is currently a statement about the Landau normal form of the extrema equation rather than about observables of the stochastic process, and the empirical fits in Sections V-VI rely on statistically invalid KS procedures. With appropriate reframing and, ideally, additional moment-based checks, the result would be of genuine interest to the stochastic-bifurcation and epidemic-modeling communities.
major comments (5)
- [Section III, Eqs. (18)-(24) and Fig. 7] The assignment of the mean-field Ising universality class is not tested for the stochastic process. The variable m=(ym-yc)/yc is the displacement of the most probable value from the inflection point of the PDF, not a thermal average; h and theta are defined directly from F(yc) and F'(yc) in Eq. (20), so Eq. (19) is just the Taylor expansion of the same equation F(y)=0, and the exponents beta_c=1/2, gamma_c=1, delta=3 follow algebraically from the cubic normal form. Figure 7 therefore evaluates Eq. (20) and cannot provide independent evidence for beta_c=1/2. The authors should either explicitly state that the claim is about the mean-field normal form of the extrema equation, or compute actual stationary moments (mean <y>, variance, and a response/susceptibility of the Fokker-Planck steady state) near the cusp to demonstrate that the stochastic process itself exhibits these exponents.
- [Section III, Eq. (23)] The susceptibility exponent gamma_c=1 is particularly unsupported. The quantity chi=(dm/dh) is a derivative in the formal mapping of Eq. (20); no physical field conjugate to the infected fraction or to the mode location is identified, and no fluctuation-dissipation relation for the Fokker-Planck model is provided. As written, gamma_c is a property of the expanded cubic equation, not a measurable response of the SIS model. Please justify this exponent as a property of the epidemic model or remove it from the universality-class claim.
- [Section VI, Eqs. (35)-(37)] The disease-free probability pst(r <= rth) is computed with rth=1/R0, i.e., the deterministic transcritical threshold R=1, whereas Section IV shows that in the stochastic model the threshold is Rc=1+sigma^2/(2gamma) (Eq. (26)). If the disease-free condition is to be evaluated in the stochastic framework of the paper, the threshold in Eq. (37) and in Fig. 12 should be the stochastic threshold; otherwise the vaccine-hesitancy conclusions are tied to a deterministic model and this needs to be stated explicitly.
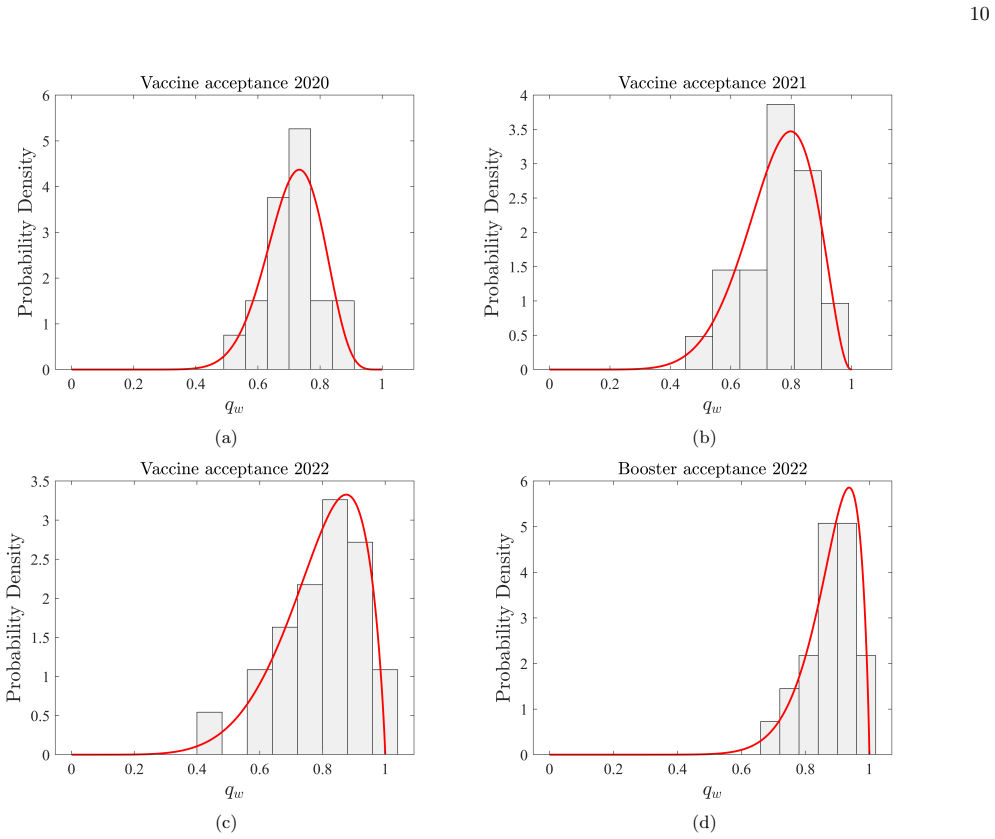
- [Section V, Tables I-III] The KS-test evidence for the Beta distribution is not statistically valid as presented. The distribution parameters are estimated by MLE from the same small samples (19-23 countries for the hesitancy data), and the standard one-sample KS null distribution used by 'kstest' does not apply when parameters are estimated; a Lilliefors-type correction or a simulation-based calibration is required. In addition, the histograms use arbitrary bin widths and the sample sizes are not reported. Consequently, the p-values in Tables II and III cannot support the claim that the Beta distribution (or any distribution) fits the data well, and the empirical motivation for Section VI rests on weak grounds.
- [Section VI, final paragraph] The statement that a Beta-distributed q makes the bifurcation diagram probabilistic is heuristic. If q is random while the infection dynamics are stochastic, one must formulate a joint Fokker-Planck equation for (y,q) or state the simplifying assumptions under which the Beta distribution of q can be superimposed on the bifurcation diagram. As written, Eq. (35) is only a change of variables for fixed R0 and is not a derivation from the epidemic dynamics; the status of this paragraph should be clarified.
minor comments (5)
- [Section III, Eq. (19)] Equation (19) contains a typographical error: the third-order term should be F'''(yc)(y-yc)^3/3!, not 'F'''(y-yc)(y-yc)^3/3!'.
- [Section VI, Eq. (35)] The distribution pst(R) in Eq. (35) is the distribution of the effective reproduction number R=R0(1-q), not of the basic reproduction number R0. The abstract and surrounding text should use 'effective reproduction number' consistently.
- [Figure 7 caption] The caption should state explicitly that the plot is computed directly from the mapping in Eq. (20), i.e., it is an algebraic consistency check of the normal form rather than a numerical simulation or an independent measurement.
- [Section V, Table II] The text says the best fits in 2020 and 2021 are Normal and Weibull, respectively, while the concluding sentence emphasizes Beta; the narrative would be clearer if it explicitly stated that the Beta distribution is competitive but not always the best by the KS statistic.
- [Section II and III] The notation R1 is used both for the immigration ratio eta/gamma in Section III and for a generic variable in the vaccine-hesitancy model in Section V; different symbols for these unrelated quantities would avoid confusion.
Circularity Check
The Ising-universality claim rests on a self-definitional mapping: Eq. (20) makes Eq. (18) algebraically identical to Eq. (19), and Fig. 7 is computed from that mapping rather than from the stochastic process.
-
self definitional
[Section III, Eqs. (18)-(22) and Fig. 7 caption]
"Comparing with Eq. (18), one gets the following relations between the thermodynamic and dynamic quantities: m = (ym - yc)/yc, h = -2F(yc)/(F'''(yc)yc^3), θ = 2F'(yc)/(F'''(yc)yc^2). ... Figure 7 shows a plot of -log |m(h = 0)| versus -log(-θ), calculated directly from the mapping relations given in Eq. (20), with the reduced field h = 0 (F(yc) = 0). The slope of the straight line is determined as βc = 1/2 in agreement with Eq. (22)."
Substituting Eq. (20) into Eq. (18) reproduces Eq. (19) exactly: F(yc) + F'(yc)(ym-yc) + F'''(yc)(ym-yc)^3/6 = 0. Thus h and θ are not independent thermodynamic fields; they are rescaled definitions of F(yc) and F'(yc). The cubic normal form is the input, and the Ising equation of state is made identical to it by construction. Fig. 7 is explicitly 'calculated directly from Eq. (20)', so it is an algebraic plot of the defining mapping, not an independent measurement of the stochastic SIS process. The order parameter m is the displacement of the PDF maximum, not an ensemble average, and χ = (∂m/∂h) is a formal derivative of the normal form rather than a response of the epidemic model.
full rationale
The paper's steady-state SIS PDF (Eq. 10) and the threshold Rc = 1 + σ^2/(2γ) are self-contained analytic derivations with no circularity: the FPE solution follows from the standard formula, and Rc follows algebraically from the bifurcation line. The vaccine-hesitancy section uses the Beta distribution as a model and fits its parameters to data; Section VI then explicitly changes variables R = R0(1-q), so the resulting pst(R) is a transparent transform of the fitted Beta distribution rather than an independent prediction. The one genuinely circular element is the central Ising-universality claim: Eq. (20) defines m, h, and θ so that the Ising equation of state (18) is algebraically identical to the Taylor-expanded extrema equation (19). Figure 7, being calculated directly from Eq. (20), cannot test the exponents and returns the cubic-normal-form values by construction. Because the paper never computes a moment or a response function of the FPE, the universality label is asserted about the normal form rather than measured on the stochastic process. This is a partial circularity affecting the headline claim, while other sections remain independent.
Assumptions & free parameters
free parameters (4)
- Immigration ratio R1 = eta/gamma =
0.01
- Histogram bin widths for vaccine willingness data =
0.08, 0.06, 0.09, 0.07
- Beta parameters for vaccine willingness (epsilon1, epsilon2) =
2020: 17.25, 6.92; 2021: 9.85, 3.23; 2022: 7.12, 1.87; booster 2022: 13.53, 1.85
- Beta parameters for global vaccination coverage =
not reported
assumptions (6)
- domain assumption Multiplicative noise beta -> beta + sigma*xi is Gaussian white noise, treated in the Ito sense
- domain assumption Mean-field homogeneous mixing with x + y = 1 and pairwise contacts
- domain assumption The extrema of the stationary PDF define the phases, and the local cubic normal form determines the universality class
- domain assumption Country-level survey percentages represent national vaccine willingness and act as independent samples
- domain assumption The vaccinated fraction q is Beta-distributed with the same parameter structure as vaccine willingness
- standard math Mean-field Ising equation of state h - theta*m - m^3/3 = 0 is the correct reference normal form
Cite this review
Pith. "Pith review of Universal features of epidemic and vaccine models." pith.science (2026). https://pith.science/paper/JNYYHWQ3
@misc{pith2026250701310,
  author       = {Pith},
  title        = {Pith review of: Universal features of epidemic and vaccine models},
  year         = {2026},
  howpublished = {\url{https://pith.science/paper/JNYYHWQ3}},
  note         = {Machine review of arXiv:2507.01310}
}
read the original abstract
In this paper, we study a stochastic susceptible-infected-susceptible (SIS) epidemic model that includes an additional immigration process. In the presence of multiplicative noise, generated by environmental perturbations, the model exhibits noise-induced transitions. The bifurcation diagram has two distinct regions of unimodality and bimodality in which the steady-state probability distribution has one and two peaks, respectively. Apart from first-order transitions between the two regimes, a critical-point transition occurs at a cusp point with the transition belonging to the mean-field Ising universality class. The epidemic model shares these features with the well-known Horsthemke-Lefever model of population genetics. The effect of vaccination on the spread/containment of the epidemic in a stochastic setting is also studied. We further propose a general vaccine-hesitancy model, along the lines of Kirman's ant model, with the steady-state distribution of the fraction of the vaccine-willing population given by the Beta distribution. The distribution is shown to give a good fit to the COVID-19 data on vaccine hesitancy and vaccination. We derive the steady-state probability distribution of the basic reproduction number, a key parameter in epidemiology, based on a beta-distributed fraction of the vaccinated population. Our study highlights the universal features that epidemic and vaccine models share with other dynamical models.
Figures


Figures from the paper (8 more)




Reference graph
Works this paper leans on
-
[1]
Next, these data are used to plot normalized histograms representing the probability density of vaccine willingness as a function of qw (the fraction of vaccine-willing individ- uals in the total population) with suitable bin sizes, for the years 2020-2022 including vaccine willingness for the 2022 booster dose (Fig. 10). The histograms are fitted by the B...
work page 2020
-
[2]
Figure 6 shows such a bimodal PDF with (R0, V ) = (2 .812, 1.015)
is the coexistence line along which the peaks of the bimodal PDF are of the same height. Figure 6 shows such a bimodal PDF with (R0, V ) = (2 .812, 1.015). Following the procedure outlined in [ 13], we show that the critical point transition in the stochastic SIS model with immigration belongs to the mean-field Ising univer- sality class. The mean-field equ...
-
[3]
(Fig. 5). For a specific value of R0, the magnitude of V is obtained from the straight line equation describing the tangential line. The red dashed line (Fig
-
[4]
N. T. J. Bailey, The mathematical theory of infectious dis- eases and its applications , 2nd ediition (Hafner Press, New York, 1975)
work page 1975
-
[5]
Following the procedure outlined in Sec
by putting R1 = 0 and replacing β by β(1 − q) in the definitions of V and R0. Following the procedure outlined in Sec. III, the bifurcation diagram (Fig. 8) is obtained in the R-VR plane with R = R0(1 − q), R0 = β γ and VR = V (1 − q), V = σ2 β . The same bifurcation diagram has been obtained earlier [ 10] in the R0 − V plane, i.e., in the absence of vacci...
-
[6]
S. M. O’Regan and J. M. Drake, Theory of early warn- ing signals of disease emergence and leading indicators of elimination, Theoretical Ecology 6, 333 (2013)
work page 2013
-
[7]
W. Horsthemke and R. Lefever, Noise-induced transitions in physics, chemistry, and biology (Springer, Berlin, 1984)
work page 1984
- [8]
Show all 46 references
-
[9]
Vespignani, Modelling dynamical processes in complex socio-technical systems, Nature Physics 8, 32 (2012)
A. Vespignani, Modelling dynamical processes in complex socio-technical systems, Nature Physics 8, 32 (2012)
2012
-
[10]
In the case of the SIS model with no immigration, Eq
and the HL model, with η = 1 /2, η + γ = 1 [ 7, 9]. In the case of the SIS model with no immigration, Eq. ( 3) has two steady-state solutions: y∗ = 0, y ∗ = 1 − γ β = 1 − 1 R0 . (4) The parameter R0 = β γ is known as the basic repro- duction number, a key parameter in epidemio...
-
[11]
Note that in the absence of noise, i.e., V = 0, Eq
has the form of a steady-state equation with the extremum ym serving as the “state” variable. Note that in the absence of noise, i.e., V = 0, Eq. ( 11) has the form of the deterministic steady-state equation f (y) = 0 (Eq. ( 3)). The significance of the extrema arises from the ...
-
[12]
Goffman and V
W. Goffman and V. A. Newill, Generalization of Epidemic Theory: An Application to the Transmission of Ideas, Na- ture 204, 225 (1964)
1964
-
[13]
A. L. Lloyd and R. M. May, How Viruses Spread Among Computers and People, Science 292, 1316 (2001)
2001
-
[14]
Pastor-Satorras, C
R. Pastor-Satorras, C. Castellano, P. Van Mieghem, and A. Vespignani, Epidemic processes in complex networks, Rev. Mod. Phys. 87, 925 (2015)
2015
-
[15]
G.-Q. Sun, R. He, L.-F. Hou, X. Luo, S. Gao, L. Chang, Y. Wang, and Z.-K. Zhang, Optimal control of spatial dis- eases spreading in networked reaction–diffusion systems, Physics Reports 1111, 1 (2025)
2025
-
[16]
Feld and A
Y. Feld and A. K. Hartmann, Large deviations of a susceptible-infected-recovered model around the epidemi c threshold, Phys. Rev. E 105, 034313 (2022)
2022
-
[17]
Bose, Emergent phenomena in living systems: A statis- tical mechanical perspective, Journal of Biosciences 47, 22 (2022)
I. Bose, Emergent phenomena in living systems: A statis- tical mechanical perspective, Journal of Biosciences 47, 22 (2022)
2022
-
[18]
Mamis and M
K. Mamis and M. Farazmand, Stochastic compartmental models of the COVID-19 pandemic must have temporally correlated uncertainties, Proceedings of the Royal Society A: Mathematical, Physical and Engineering Sciences 479, 20220568 (2023)
2023
-
[19]
A. Erez, T. A. Byrd, R. M. Vogel, G. Altan-Bonnet, and A. Mugler, Universality of biochemical feedback and its ap- plication to immune cells, Phys. Rev. E 99, 022422 (2019)
2019
-
[20]
Bose and S
I. Bose and S. Ghosh, Bifurcation and criticality, Journal of Statistical Mechanics: Theory and Experiment 2019, 043403 (2019)
2019
-
[21]
Bose, Tipping the Balance: A Criticality Perspective, Entropy 24, 10.3390/e24030405 (2022)
I. Bose, Tipping the Balance: A Criticality Perspective, Entropy 24, 10.3390/e24030405 (2022)
2022 doi
-
[22]
J. Xian, M. Liu, X. Cheng, M. Yang, T. Xie, X. Wang, M. Liu, Y.-C. Zhang, D. Yang, G.-Q. Sun, and J. Ye, Modelling multiscale infectious disease in complex system s, Physics Reports 1113, 1 (2025)
2025
-
[23]
A. Gray, D. Greenhalgh, L. Hu, X. Mao, and J. Pan, A Stochastic Differential Equation SIS Epidemic Model, SIAM Journal on Applied Mathematics 71, 876 (2011)
2011
-
[24]
M. A. Stephens, EDF Statistics for Goodness of Fit and Some Comparisons, Journal of the American Statistical As- sociation 69, 730 (1974)
1974
-
[25]
Fibich, J
G. Fibich, J. G. Restrepo, and G. Rothmann, Explicit so- lutions of the Bass and susceptible-infected models on hy- pernetworks, Phys. Rev. E 110, 054306 (2024)
2024
-
[26]
Be- low the threshold value set by Rc (Eq
forms the content of a theorem proposed and proved in the case of the stochastic SIS model without vaccination [ 23]. Be- low the threshold value set by Rc (Eq. ( 26)), the infected fraction of the population in the steady state is zero with probability 1. As in the determinis...
2020
-
[27]
Franceschi, L
J. Franceschi, L. Pareschi, E. Bellodi, M. Gavanelli, and M. Bresadola, Modeling opinion polarization on social me- dia: Application to Covid-19 vaccination hesitancy in Ital y, PLOS ONE 18, 1 (2023) . 14
2023
-
[28]
Kirman, Ants, Rationality, and Recruitment, The Quar- terly Journal of Economics 108, 137 (1993)
A. Kirman, Ants, Rationality, and Recruitment, The Quar- terly Journal of Economics 108, 137 (1993)
1993
-
[29]
Alfarano, T
S. Alfarano, T. Lux, and F. Wagner, Estimation of agent- based models: the case of an asymmetric herding model, Computational Economics 26, 19 (2005)
2005
-
[30]
the number of new cells infected by one initial infected cell in an other- wise susceptible (target cell) population
with x re- placed by q. The probability distribution of R = R0(1 − q) is then expressed as pst(R) = 1 R0B(ǫ1, ǫ2) ( 1 − R R0 ) ǫ1−1( R R0 ) ǫ2−1 , 0 ≤ R ≤ R0. (35) where B(ǫ1, ǫ2) = Γ(ǫ1)Γ(ǫ2) Γ(ǫ1 + ǫ2) . A similar probability distri- bution, for the basic reproduction number...
-
[31]
Konovicius, Modeling of the Parties’ Vote Share Distributions, Acta Physica Polonica, A
A. Konovicius, Modeling of the Parties’ Vote Share Distributions, Acta Physica Polonica, A. 133, 10.12693/APhysPolA.133.1450 (2018)
2018 doi
-
[32]
J. V. Lazarus, K. Wyka, T. M. White, C. A. Picchio, L. O. Gostin, H. J. Larson, K. Rabin, S. C. Ratzan, A. Ka- marulzaman, and A. El-Mohandes, A survey of COVID- 19 vaccine acceptance across 23 countries in 2022, Nature Medicine 29, 366 (2023)
2023
-
[33]
V. W. Berger and Y. Zhou, Kolmogorov–Smirnov Test: Overview, in Wiley StatsRef: Statistics Reference Online (John Wiley & Sons, Ltd, 2014)
2014
-
[34]
Simard and P
R. Simard and P. L’Ecuyer, Computing the Two-Sided Kolmogorov-Smirnov Distribution, Journal of Statistical Software 39, 1 (2011)
2011
-
[35]
Y. Yang, W. Dempsey, P. Han, Y. Deshmukh, S. Richard- son, B. Tom, and B. Mukherjee, Exploring the Big Data Paradox for various estimands using vaccination data from the global COVID-19 Trends and Impact Survey (CTIS), Science Advances 10, eadj0266 (2024)
2024
-
[36]
J. H. C. R. Center, Understanding vaccination progress, https://coronavirus.jhu.edu/vaccines/international
-
[37]
Van de Schoot, S
R. Van de Schoot, S. Depaoli, R. King, et al. , Bayesian statistics and modelling, Nature Reviews Methods Primers 1, 1 (2021)
2021
-
[38]
S. R. Eddy, What is Bayesian statistics?, Nature Biotech- nology 22, 1177 (2004)
2004
-
[39]
Gao and Q
X. Gao and Q. Dong, A primer on Bayesian estimation of prevalence of COVID-19 patient outcomes, JAMIA Open 3, 628 (2020)
2020
-
[40]
A. S. Kadi and S. R. Avaradi, A Bayesian Inferential Ap- proach to Quantify the Transmission Intensity of Disease Outbreak, Computational and Mathematical Methods in Medicine 2015, 256319 (2015)
2015
-
[41]
Keeling and P
M. Keeling and P. Rohani, Modeling Infectious Diseases in Humans and Animals (Princeton University Press, 2008)
2008
-
[42]
Brauer and C
F. Brauer and C. Castillo-Chavez, Mathematical models in population biology and epidemiology , Vol. 2 (Springer, 2012)
2012
-
[43]
L. J. S. Allen, An Introduction to Stochastic Epi- demic Models, in Mathematical Epidemiology , edited by F. Brauer, P. van den Driessche, and J. Wu (Springer Berlin Heidelberg, Berlin, Heidelberg, 2008) pp. 81–130
2008
-
[44]
Wang, Confidence Intervals of COVID-19 Vaccine Effi- cacy Rates, Numeracy 14, 7 (2021)
F. Wang, Confidence Intervals of COVID-19 Vaccine Effi- cacy Rates, Numeracy 14, 7 (2021)
2021
-
[45]
Williams, J
B. Williams, J. Carruthers, J. J. Gillard, G. Lythe, A. S. Perelson, R. M. Ribeiro, C. Molina-Par ´ ıs, and M. L´ opez- Garc ´ ıa, The reproduction number and its probability distri- bution for stochastic viral dynamics, Journal of The Royal Society Interface 21, 20230400 (2024)
2024
-
[46]
J. E. Pearson, P. Krapivsky, and A. S. Perelson, Stochastic Theory of Early Viral Infection: Continuous versus Burst Production of Virions, PLOS Computational Biology 7, 1 (2011)
2011
Reviewed August 6, 2026 · model on record in the stance chip above.
Discussion (0). Continue with ORCID to comment.