REVIEW 5 major objections 5 minor 1 cited by
Are machine learning interpretations reliable? A stability study on global interpretations
T0 review · 5 major / 5 minor · reviewed 2026-08-07 · deepseek-v4-flash
Pith's one-line read Popular machine learning interpretation methods are frequently less stable than the predictions they explain, and prediction accuracy does not predict interpretation stability.
desk verdict A broad, useful stability benchmark for global IML interpretations with a plausible core finding, but uncalibrated noise and post-hoc dataset selection weaken the generality. read the letter →
The pith
A machine-rendered reading of the paper's core claim, the machinery that carries it, and where it could break.
The reading
What carries the argument
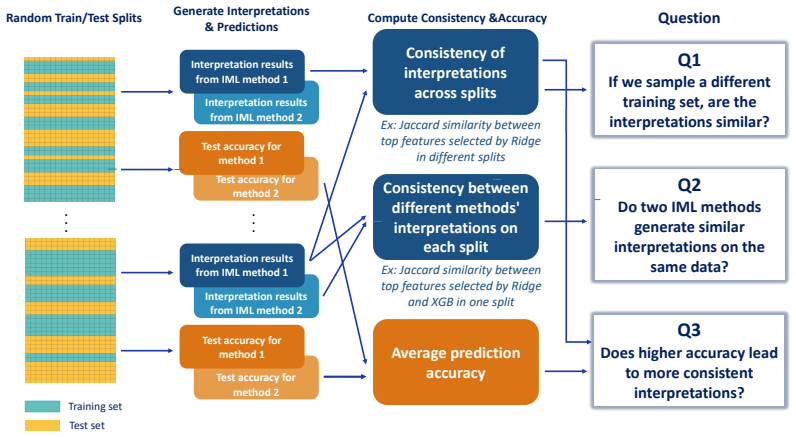
The load-bearing machinery is a perturbation-and-resampling protocol paired with a family of stability metrics. Interpretations are recomputed across 100 random 70/30 train/test splits for supervised tasks and across subsampling plus additive Gaussian or Laplace noise (variance up to 5) for unsupervised tasks. Stability is scored with top-K rank metrics (Jaccard similarity, average overlap, and top-K Kendall's tau), clustering agreement metrics (adjusted Rand index, Fowlkes-Mallows index, mutual information, V-measure), and a new nearest-neighbor Jaccard area-under-the-curve score for dimension reduction. These scores quantify how much an interpretation changes under small perturbations, which is the paper's operational definition of reliability.
What would settle it
Run the same protocol on datasets using alternative perturbation types not covered in the paper, such as bootstrap resampling, feature permutation, time-based or grouped splits, and noise scaled to each feature's standard deviation, then check whether top-K Jaccard and average-overlap scores remain low and whether accuracy-stability regression slopes stay flat. If many methods show high stability under realistic perturbations, or if prediction accuracy strongly predicts interpretation stability, the paper's central claim would be contradicted.
Extended reading notes
Core claim
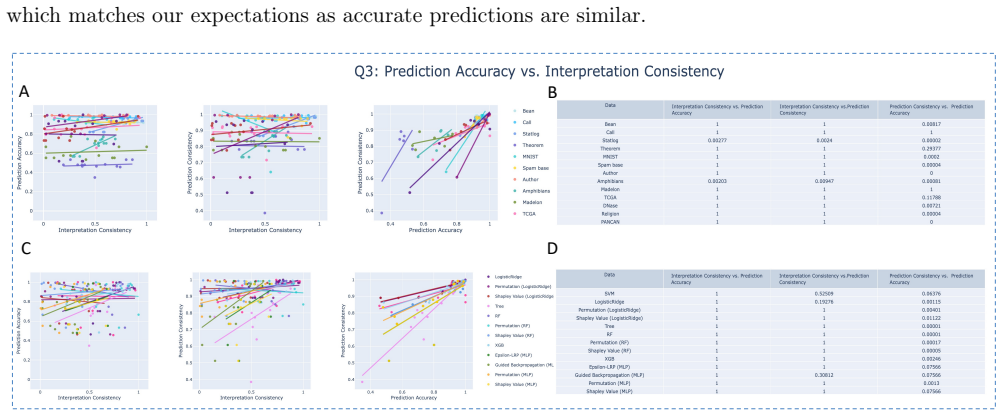
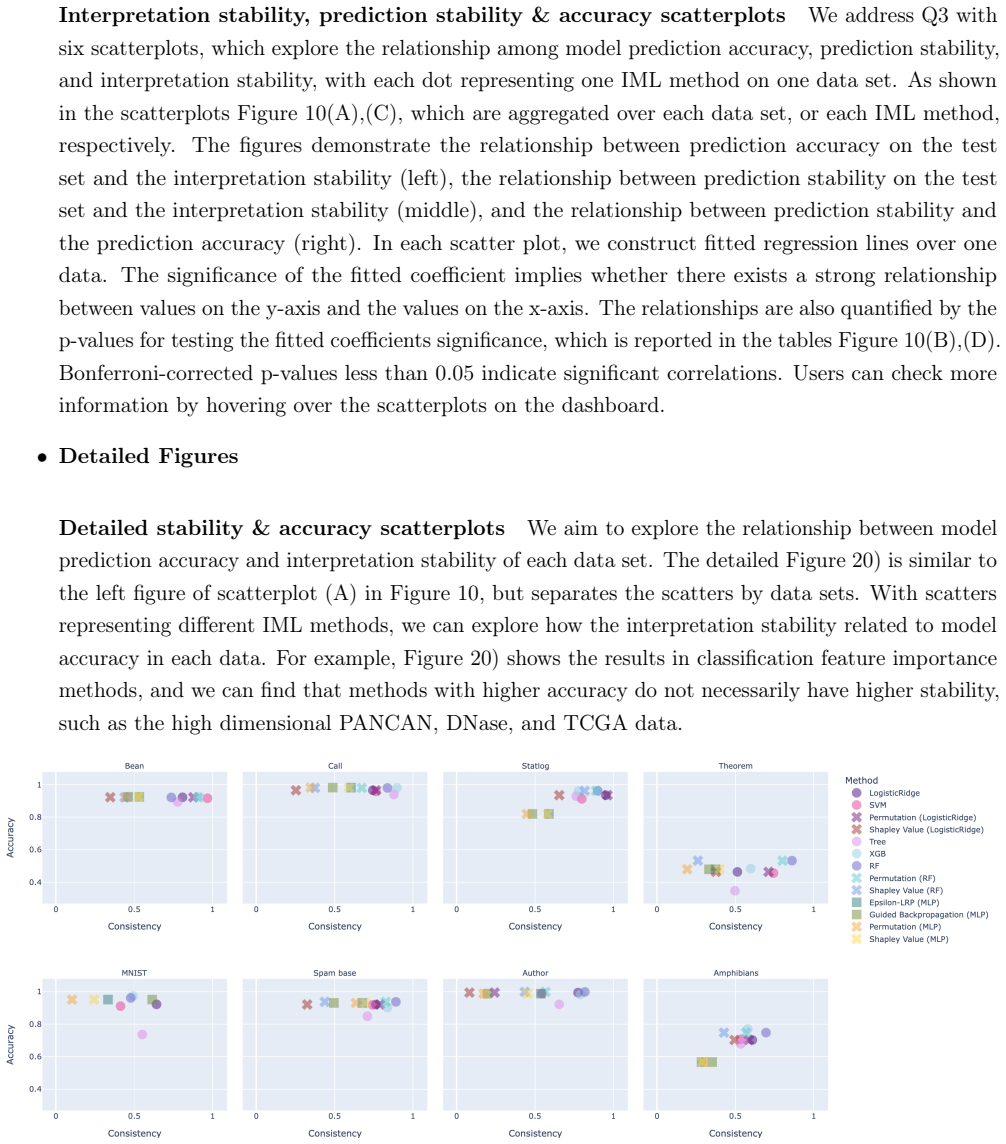
The paper's central empirical discovery is that stability and accuracy come apart: models with similar prediction accuracy can have very different interpretation stability, and more accurate models do not generally give more stable feature importance rankings. Within-method stability scores for feature importance are often low, while prediction stability is comparatively high; between-method agreement on interpretations is also weak, even when predictions agree strongly. In clustering and dimension reduction, stability is higher on average but still varies sharply by method and dataset, and methods that give stable clustering labels can still give unstable nearest-neighbor structure. The authors conclude that interpretation reliability must be assessed directly, not inferred from predictive performance, and they provide an open-source dashboard and Python package for doing so.
Load-bearing premise
The load-bearing premise is that random 70/30 train/test splits and additive Gaussian or Laplace noise with variance up to 5 constitute 'small random perturbations' that mimic realistic data variability; if real-world distribution shifts behave differently, the measured instability could be overstated or understated.
Editorial extensions
If this is right
- Practitioners who report a model's accuracy without reporting interpretation stability are missing a key axis of trustworthiness, since high accuracy can coexist with volatile explanations.
- The choice of an interpretation method should be justified empirically on the specific dataset, because no method is consistently most stable across datasets.
- Stable predictions do not guarantee stable interpretations, so stability analyses must target the interpretation itself rather than the model output.
- Unsupervised interpretations, such as cluster assignments or embeddings, should undergo the same stability checks as supervised feature importance before being used for scientific discovery.
- The released software enables researchers to run the same perturbation-and-metric protocol on their own data and IML methods, making stability assessment a routine step.
Reading between the lines
- An implication the authors leave implicit is that stability scores could be used to build more trustworthy interpretations by identifying which methods agree on a given dataset and focusing on their consensus, rather than trusting a single method's output.
- The observed instability may extend beyond tabular feature importance and clusterings to other explanation formats such as rules, textual explanations, and visual saliency maps, since the underlying sensitivity to data perturbations is a general phenomenon.
- A testable extension would be to check whether stability rankings change when perturbations are scaled to each feature's natural variability instead of using a global noise variance, which could reveal whether the reported instability is an artifact of noise levels that are large relative to signal.
- The accuracy-stability decoupling suggests that benchmarks for interpretable machine learning should treat interpretation stability as a reporting requirement rather than an optional diagnostic, especially in high-stakes applications.
Editorial analysis
A structured set of objections, weighed in public.
Referee Report
Summary. The paper reports a large-scale empirical study of the stability of global interpretable machine learning (IML) outputs for classification, regression, clustering, and dimensionality reduction on tabular benchmark data. Stability is operationalized as agreement under repeated 70/30 train/test splits and under additive Gaussian or Laplace noise, measured with Jaccard, average overlap, top-K Kendall's tau, ARI, Fowlkes-Mallows, mutual information, V-measure, and a proposed NN-Jaccard-AUC metric. Across roughly 50 IML method-dataset combinations, the authors report that interpretations are frequently unstable, are notably less stable than the predictions themselves, show no association with predictive accuracy, and that no single method is most stable across datasets. The paper also releases an interactive dashboard and a Python package for users to run similar reliability assessments.
Significance. If the findings hold, this is a useful systematic benchmark for the IML community: it goes beyond single-method studies, covers supervised and unsupervised tasks, uses multiple stability metrics, and ships open-source tooling for practitioners. The scale of the experiment (hundreds of thousands of repeats) and the public dashboard are concrete strengths. However, the abstract-level claims currently outrun the methodological rigor of the study: the perturbation scale is uncalibrated, the dataset inventory is internally inconsistent, some dataset and hyperparameter choices are made after looking at performance, and the headline comparisons with prediction stability are not formalized with uncertainty quantification. These issues do not invalidate the empirical enterprise, but they must be fixed before the broad claims can be accepted as stated.
major comments (5)
- [Appendix A.1 and Figure 8] The noise perturbation is not calibrated to feature scale and the parameterization is ambiguous. Appendix A.1 defines noise as Normal(0, sigma^2) or Laplace(0, sigma^2) with variance sigma^2 in [0, 5], while Figure 8 and Section B.2 use 'normal noise with a standard deviation of 0.15' and 'sigma = 0.15'. If sigma is a standard deviation there, the variance is 0.0225, which is not clearly connected to the grid in A.1; if sigma is read as variance, then the 'standard deviation' statement in B.2 is wrong. More importantly, no standardization is described before adding noise, so a fixed magnitude is applied to datasets with very different feature scales (e.g., PANCAN RNA-seq counts versus Iris physical measurements). A fixed noise level can be negligible for high-variance features and overwhelming for low-variance features, which directly affects the NN-Jaccard-AUC stability results in Figure 8 and the claim that dimension-reduction interpretations are 'frequently unstable'. Please state one convention, standardize features or calibrate noise to per-feature variance, and report a sensitivity sweep over noise levels.
- [Section 2.4 and Table 5] The dataset inventory is internally inconsistent. Table 5 lists 25 datasets, but Section 2.4 and the results refer to datasets that do not appear in the table, including DNase, Madelon, Amphibians, Theorem, Digit MNIST, and Darmanis. Appendix C states that the study covers 'over 50 IML methodologies, 33 data sets' and that the classification/regression pages use 13 datasets, neither of which matches Table 5. This mismatch prevents the reader from reconstructing the actual experimental scope and undermines the reproducibility of the paper's central claims. Please provide a complete dataset table and reconcile the counts throughout the text and appendix.
- [Section 2.4] The dataset inclusion rules appear to be applied after seeing the methods' performance. The text says 'We select classification data sets whose ARIs are all above 0.2' and, for dimension reduction, excludes datasets whose clustering accuracy on the first two reduced dimensions falls below an ARI cutoff of 0.2, with additional cutoffs P>15 and N<2000. It is unclear what 'ARIs' means for classification datasets, since ARI is defined as a clustering similarity metric and not a classification accuracy measure. If these thresholds were fixed after inspecting results, the benchmark is restricted to datasets on which the studied methods achieve a minimum level of accuracy, which can only weaken the accuracy-stability association and bias the 'no single method' conclusion. Please state when and why the thresholds were chosen, justify them independently of the methods' performance, and report results before and after the exclusions.
- [Section 2.2.3 and Table 3] The hierarchical clustering distance metric is selected per dataset by the highest clustering accuracy on the true labels. This means the HC stability rankings in Figure 4 are not the stability of a fixed, pre-specified method; the selection itself uses label information on the same datasets whose stability is later compared. The choice among distance metrics is a hyperparameter and should be made by a procedure that does not leak the test labels, or results for all distances should be reported so the reader can assess the sensitivity of the stability rankings.
- [Section 3.2 and abstract] The claim that interpretations are 'notably less stable than the predictions themselves' is supported only by visual comparison of heatmaps (A) and (E) in Figures 2 and 3, without a paired statistical test or an effect-size summary across datasets and methods. Similarly, the 'no single method consistently provides the most stable interpretations' claim rests on bump plots (Figures 2B-5B) that rank methods without error bars or confidence intervals; with 50-100 repeats per setting, the rank differences may be within sampling variation. Please add uncertainty quantification for the stability scores and a formal comparison of interpretation stability versus prediction stability, or temper the abstract-level wording accordingly.
minor comments (5)
- [Equation (2)] The definition of top-K Kendall's tau in Eq. (2) uses the term \bar{K}^{(p)}_{i,j} without giving its piecewise definition; please include the missing definition from the cited Fagin et al. reference.
- [Throughout] There are repeated typos and grammatical slips, including 'spannining' (Section 2), 'are have' (Section 3.2), 'logiaclly' (Section 3.3), 'underlyign' (Discussion), 'paramter' (Appendix A.3.1), 'featuers' (Appendix C.2.1), 'Tetragonla' (Appendix B.1), and 'Figure 4 P-values' in the Appendix B.3 caption; these should be corrected.
- [Section 2.2.2 and Table 2] The Deep Autoencoder row in Table 2 uses em-dashes for both the Global/Local and Linear/Non-linear columns; please specify the intended categorization or explain why it does not apply.
- [Appendix A.2.1] The NN-Jaccard-AUC metric is defined in prose but the formula in Table 4 is a compact notation; please state explicitly that it is an average over samples and over the 50 selected values of K, as described in the appendix, so the table is self-contained.
- [References] Several references are incomplete or garbled, notably the author string in reference [3]; please verify all references against the publisher records.
Circularity Check
No significant circularity: the stability measurements are empirical and self-contained; the reliability-stability link is an explicit definitional stance, not a hidden derivation.
full rationale
The paper's central claims—that popular interpretation methods are frequently unstable, that interpretation stability is lower than prediction stability, that accuracy is not associated with stability, and that no method is consistently most stable—are empirical results obtained by applying defined stability metrics (Jaccard, AO, Kendall's Tau, ARI, NN-Jaccard-AUC) to interpretations across repeated train/test splits and noise perturbations. Nothing in these measurements is fitted to the conclusions, and no fitted parameter is renamed as a prediction. The one terminological loop is explicit: Section 1 defines stability as findings that are 'consistent or reliable under small random perturbations,' and Appendix A.1 states 'We define an interpretation to be reliable if the same or similar interpretations can be derived from new data of the same distribution. Therefore, the reliability of a machine learning model can be measured by the stability of its derived interpretations.' The conclusion that unstable interpretations are unreliable follows from that definitional stance rather than from a hidden equivalence; the empirical content lies in the measured instability itself, which is not derived from the conclusion. Self-citations (Allen, Gan, Zheng 2023; Gan, Zheng, Allen 2022; Zikry and Allen 2025) appear only as background references and are not load-bearing for the stability measurements. The choice of perturbation scale (e.g., sigma^2 in [0,5]) and the mixing of variance versus standard deviation parameterizations are legitimate correctness concerns, but they are not circularity. The paper is self-contained against external benchmarks, so the score is 0.
Assumptions & free parameters
free parameters (4)
- Top-K features (K=10) =
10
- Noise level for dimension reduction (sigma) =
0.15
- Dataset inclusion cutoffs =
ARI>0.2, P>15, N<2000
- Per-dataset distance metric for hierarchical clustering =
varies (Table 3)
assumptions (3)
- domain assumption Stability is a prerequisite for reliability
- domain assumption Random train/test splits and additive noise represent small perturbations
- domain assumption Standard implementations of ML methods are unbiased representations
invented entities (1)
-
NN-Jaccard-AUC metric
Cite this review
Pith. "Pith review of Are machine learning interpretations reliable? A stability study on global interpretations." pith.science (2026). https://pith.science/paper/JOYBISVH
@misc{pith2026250515728,
  author       = {Pith},
  title        = {Pith review of: Are machine learning interpretations reliable? A stability study on global interpretations},
  year         = {2026},
  howpublished = {\url{https://pith.science/paper/JOYBISVH}},
  note         = {Machine review of arXiv:2505.15728}
}
read the original abstract
As machine learning systems are increasingly used in high-stakes domains, there is a growing emphasis placed on making them interpretable to improve trust in these systems. In response, a range of interpretable machine learning (IML) methods have been developed to generate human-understandable insights into otherwise black box models. With these methods, a fundamental question arises: Are these interpretations reliable? Unlike with prediction accuracy or other evaluation metrics for supervised models, the proximity to the true interpretation is difficult to define. Instead, we ask a closely related question that we argue is a prerequisite for reliability: Are these interpretations stable? We define stability as findings that are consistent or reliable under small random perturbations to the data or algorithms. In this study, we conduct the first systematic, large-scale empirical stability study on popular machine learning global interpretations for both supervised and unsupervised tasks on tabular data. Our findings reveal that popular interpretation methods are frequently unstable, notably less stable than the predictions themselves, and that there is no association between the accuracy of machine learning predictions and the stability of their associated interpretations. Moreover, we show that no single method consistently provides the most stable interpretations across a range of benchmark datasets. Overall, these results suggest that interpretability alone does not warrant trust, and underscores the need for rigorous evaluation of interpretation stability in future work. To support these principles, we have developed and released an open source IML dashboard and Python package to enable researchers to assess the stability and reliability of their own data-driven interpretations and discoveries.
Figures


Figures from the paper (19 more)




Forward citations
Cited by 1 Pith paper
-
Unsupervised Machine Learning for Scientific Discovery: Workflow and Best Practices
A best-practices workflow for unsupervised scientific discovery, illustrated by a stability- and generalizability-driven clustering case study of Milky Way globular clusters using APOGEE data.
Reference graph
Works this paper leans on
-
[1]
[Accessed 20-05-2025]
GitHub - kundajelab/deeplift: Public facing deeplift repo — github.com.https://github.com/ kundajelab/deeplift. [Accessed 20-05-2025]
2025
-
[2]
DeepExplain also includes support for Shapley Values sampling
GitHub - marcoancona/DeepExplain: A unified framework of perturbation and gradient-based attribution methods for Deep Neural Networks interpretability. DeepExplain also includes support for Shapley Values sampling. (ICLR 2018) — github.com. https://github.com/marcoancona/ DeepExplain. [Accessed 20-05-2025]
2018
-
[3]
B. . W. H. . H. M. S. C. L. . . P. P. J. . K. R. 13, G. data analysis: Baylor College of Medicine Creighton Chad J. 22 23 Donehower Lawrence A. 22 23 24 25, I. for Systems Biology Reynolds Sheila 31 Kreisberg Richard B. 31 Bernard Brady 31 Bressler Ryan 31 Erkkila Timo 32 Lin Jake 31 Thorsson Vesteinn 31 Zhang Wei 33 Shmulevich Ilya 31, et al. Comprehensi...
2012
-
[4]
Abdi and L
H. Abdi and L. J. Williams. Principal component analysis.Wiley interdisciplinary reviews: compu- tational statistics, 2(4):433–459, 2010
2010
-
[5]
Achilles, H
C. Achilles, H. P. Bain, F. Bellott, J. Boyd-Zaharias, J. Finn, J. Folger, J. Johnston, and E. Word. Tennessee’s Student Teacher Achievement Ratio (STAR) project, 2008
2008
-
[6]
Adadi and M
A. Adadi and M. Berrada. Peeking inside the black-box: a survey on explainable artificial intelligence (xai). IEEE access, 6:52138–52160, 2018
2018
-
[7]
Local Explanation Methods for Deep Neural Networks Lack Sensitivity to Parameter Values
J. Adebayo, J. Gilmer, I. Goodfellow, and B. Kim. Local explanation methods for deep neural networks lack sensitivity to parameter values.arXiv preprint arXiv:1810.03307, 2018
work page Pith review arXiv 2018
-
[8]
J. Adebayo, J. Gilmer, M. Muelly, I. Goodfellow, M. Hardt, and B. Kim. Sanity checks for saliency maps. arXiv preprint arXiv:1810.03292, 2018
arXiv 2018
Show all 151 references
-
[9]
Agarwal, J
S. Agarwal, J. Wills, L. Cayton, G. Lanckriet, D. Kriegman, and S. Belongie. Generalized non-metric multidimensional scaling. InArtificial intelligence and statistics, pages 11–18. PMLR, 2007
2007
-
[10]
G. I. Allen, L. Gan, and L. Zheng. Interpretable machine learning for discovery: Statistical challenges and opportunities. Annual Review of Statistics and Its Application, 11, 2023
2023
-
[11]
Alomari and M
Y. Alomari and M. Andó. Shap-based insights for aerospace phm: Temporal feature importance, dependencies, robustness, and interaction analysis.Results in Engineering, 21:101834, 2024
2024
-
[12]
Ancona, E
M. Ancona, E. Ceolini, C. Öztireli, and M. Gross. Towards better understanding of gradient-based attribution methods for deep neural networks.arXiv preprint arXiv:1711.06104, 2017
2017 arXiv
-
[13]
Arthur and S
D. Arthur and S. Vassilvitskii. k-means++: The advantages of careful seeding. Technical report, Stanford, 2006
2006
-
[14]
S. Bach, A. Binder, G. Montavon, F. Klauschen, K.-R. Müller, and W. Samek. On pixel-wise explanations for non-linear classifier decisions by layer-wise relevance propagation. PloS one, 10(7):e0130140, 2015. 48
2015
-
[15]
Baehrens, T
D. Baehrens, T. Schroeter, S. Harmeling, M. Kawanabe, K. Hansen, and K.-R. Müller. How to explain individual classification decisions.The Journal of Machine Learning Research, 11:1803–1831, 2010
2010
-
[16]
Balasubramanian and E
M. Balasubramanian and E. L. Schwartz. The isomap algorithm and topological stability.Science, 295(5552):7–7, 2002
2002
-
[17]
Bastani, C
O. Bastani, C. Kim, and H. Bastani. Interpretability via model extraction. arXiv preprint arXiv:1706.09773, 2017
2017 arXiv
-
[18]
S. Basu, K. Kumbier, J. B. Brown, and B. Yu. Iterative random forests to discover predictive and stable high-order interactions.Proceedings of the National Academy of Sciences, 115(8):1943–1948, 2018
1943
-
[19]
R. Berk, L. Brown, A. Buja, K. Zhang, and L. Zhao. Valid post-selection inference.The Annals of Statistics, pages 802–837, 2013
2013
-
[20]
C. M. Bishop. Pattern recognition.Machine learning, 128(9), 2006
2006
-
[21]
C. Blake. Uci repository of machine learning databases. http://www. ics. uci. edu/˜ mlearn/MLRepository. html, 1998
1998
-
[22]
L. Breiman. Random forests.Machine learning, 45(1):5–32, 2001
2001
-
[23]
J. P. Bridge, S. B. Holden, and L. C. Paulson. Machine learning for first-order theorem proving. Journal of automated reasoning, 53(2):141–172, 2014
2014
-
[24]
Bühlmann, M
P. Bühlmann, M. Kalisch, and L. Meier. High-dimensional statistics with a view toward applications in biology.Annual Review of Statistics and Its Application, 1:255–278, 2014
2014
-
[25]
K. Buza. Feedback prediction for blogs. InData analysis, machine learning and knowledge discovery, pages 145–152. Springer, 2014
2014
-
[26]
Campbell, C
K. Campbell, C. P. Ponting, and C. Webber. Laplacian eigenmaps and principal curves for high resolution pseudotemporal ordering of single-cell rna-seq profiles.bioRxiv, page 027219, 2015
2015
-
[27]
Carleo, I
G. Carleo, I. Cirac, K. Cranmer, L. Daudet, M. Schuld, N. Tishby, L. Vogt-Maranto, and L. Zdeborová. Machine learning and the physical sciences.Reviews of Modern Physics, 91(4):045002, 2019
2019
-
[28]
M. A. Carreira-Perpinán. A review of dimension reduction techniques.Department of Computer Science. University of Sheffield. Tech. Rep. CS-96-09, 9:1–69, 1997
1997
-
[29]
D. V. Carvalho, E. M. Pereira, and J. S. Cardoso. Machine learning interpretability: A survey on methods and metrics.Electronics, 8(8):832, 2019
2019
-
[30]
T. Chen, T. He, M. Benesty, V. Khotilovich, Y. Tang, H. Cho, et al. Xgboost: extreme gradient boosting. R package version 0.4-2, 1(4):1–4, 2015
2015
-
[31]
E. P. Consortium et al. An integrated encyclopedia of dna elements in the human genome.Nature, 489(7414):57–74, 2012. 49
2012
-
[32]
Cortes and V
C. Cortes and V. Vapnik. Support-vector networks.Machine learning, 20(3):273–297, 1995
1995
-
[33]
Cortez, A
P. Cortez, A. Cerdeira, F. Almeida, T. Matos, and J. Reis. Modeling wine preferences by data mining from physicochemical properties.Decision support systems, 47(4):547–553, 2009
2009
-
[34]
M. L. Davison and S. G. Sireci. Multidimensional scaling. InHandbook of applied multivariate statistics and mathematical modeling, pages 323–352. Elsevier, 2000
2000
-
[35]
L. Deng. The mnist database of handwritten digit images for machine learning research [best of the web]. IEEE Signal Processing Magazine, 29(6):141–142, 2012
2012
-
[36]
M. F. Dixon, I. Halperin, and P. Bilokon.Machine learning in finance, volume 1170. Springer, 2020
2020
-
[37]
Doshi-Velez and B
F. Doshi-Velez and B. Kim. Towards a rigorous science of interpretable machine learning.arXiv preprint arXiv:1702.08608, 2017
2017 arXiv
-
[38]
Doshi-Velez and B
F. Doshi-Velez and B. Kim. Considerations for evaluation and generalization in interpretable machine learning. In Explainable and interpretable models in computer vision and machine learning, pages 3–17. Springer, 2018
2018
-
[39]
Drozdal, J
J. Drozdal, J. Weisz, D. Wang, G. Dass, B. Yao, C. Zhao, M. Muller, L. Ju, and H. Su. Trust in automl: exploring information needs for establishing trust in automated machine learning systems. In Proceedings of the 25th International Conference on Intelligent User Interfaces, ...
2020
-
[40]
M. Du, N. Liu, and X. Hu. Techniques for interpretable machine learning.Communications of the ACM, 63(1):68–77, 2019
2019
-
[41]
Fagin, R
R. Fagin, R. Kumar, and D. Sivakumar. Comparing top k lists.SIAM Journal on discrete mathematics, 17(1):134–160, 2003
2003
-
[42]
Fanaee-T and J
H. Fanaee-T and J. Gama. Event labeling combining ensemble detectors and background knowledge. Progress in Artificial Intelligence, 2(2):113–127, 2014
2014
-
[43]
Fernandes, P
K. Fernandes, P. Vinagre, and P. Cortez. A proactive intelligent decision support system for predicting the popularity of online news. InPortuguese Conference on Artificial Intelligence, pages 535–546. Springer, 2015
2015
-
[44]
R. C. Fong and A. Vedaldi. Interpretable explanations of black boxes by meaningful perturbation. In Proceedings of the IEEE International Conference on Computer Vision, pages 3429–3437, 2017
2017
-
[45]
E. B. Fowlkes and C. L. Mallows. A method for comparing two hierarchical clusterings.Journal of the American statistical association, 78(383):553–569, 1983
1983
-
[46]
Franck, E
P. Franck, E. Cameron, G. Good, J.-Y. Rasplus, and B. Oldroyd. Nest architecture and genetic differentiation in a species complex of australian stingless bees.Molecular Ecology, 13(8):2317–2331, 2004. 50
2004
-
[47]
L. Gan, L. Zheng, and G. I. Allen. Inference for interpretable machine learning: Fast, model-agnostic confidence intervals for feature importance.arXiv preprint arXiv:2206.02088, 2022
2022
-
[48]
L. H. Gilpin, D. Bau, B. Z. Yuan, A. Bajwa, M. Specter, and L. Kagal. Explaining explanations: An overview of interpretability of machine learning. In2018 IEEE 5th International Conference on data science and advanced analytics (DSAA), pages 80–89. IEEE, 2018
2018
-
[49]
Goecks, V
J. Goecks, V. Jalili, L. M. Heiser, and J. W. Gray. How machine learning will transform biomedicine. Cell, 181(1):92–101, 2020
2020
-
[50]
J. Gu, Y. Yang, and V. Tresp. Understanding individual decisions of cnns via contrastive backpropa- gation. In Asian Conference on Computer Vision, pages 119–134. Springer, 2018
2018
-
[51]
Guidotti, A
R. Guidotti, A. Monreale, S. Ruggieri, F. Turini, F. Giannotti, and D. Pedreschi. A survey of methods for explaining black box models.ACM computing surveys (CSUR), 51(5):1–42, 2018
2018
-
[52]
Guyon, S
I. Guyon, S. Gunn, A. Ben-Hur, and G. Dror. Result analysis of the nips 2003 feature selection challenge. Advances in neural information processing systems, 17, 2004
2003
-
[53]
N. S. Habib, O. K. A. Maghasib, A. R. Al-Ghazali, B. S. Abu-Nasser, and S. S. Abu-Naser. Presence of amphibian species prediction using features obtained from gis and satellite images.International Journal of Academic and Applied Research (IJAAR), 4(11), 2020
2020
-
[54]
B. S. Haney. Applied artificial intelligence in modern warfare and national security policy.Hastings Sci. & Tech. LJ, 11:61, 2020
2020
-
[55]
Hennig, M
C. Hennig, M. Meilă, F. Murtagh, and R. Rocci. Handbook of cluster analysis. 2015
2015
-
[56]
Huang, Q
J. Huang, Q. Dong, S. Gong, and X. Zhu. Unsupervised deep learning by neighbourhood discovery. In International Conference on Machine Learning, pages 2849–2858. PMLR, 2019
2019
-
[57]
Ignatiev
A. Ignatiev. Towards trustable explainable ai. InIJCAI, pages 5154–5158, 2020
2020
-
[58]
P. T. Inc. Collaborative data science, 2015
2015
-
[59]
B. K. Iwana, R. Kuroki, and S. Uchida. Explaining convolutional neural networks using softmax gradient layer-wise relevance propagation. In2019 IEEE/CVF International Conference on Computer Vision Workshop (ICCVW), pages 4176–4185. IEEE, 2019
2019
-
[60]
Jung and J
S. Jung and J. S. Marron. Pca consistency in high dimension, low sample size context.The Annals of Statistics, 37(6B):4104–4130, 2009
2009
-
[61]
Kapishnikov, T
A. Kapishnikov, T. Bolukbasi, F. Viégas, and M. Terry. Xrai: Better attributions through regions. In Proceedings of the IEEE/CVF International Conference on Computer Vision, pages 4948–4957, 2019
2019
-
[62]
M. G. Kendall. A new measure of rank correlation.Biometrika, 30(1/2):81–93, 1938
1938
-
[63]
M. A. Kramer. Nonlinear principal component analysis using autoassociative neural networks.AIChE journal, 37(2):233–243, 1991. 51
1991
-
[64]
Kraskov, H
A. Kraskov, H. Stögbauer, and P. Grassberger. Estimating mutual information.Physical review E, 69(6):066138, 2004
2004
-
[65]
Kumar and S
R. Kumar and S. Vassilvitskii. Generalized distances between rankings. InProceedings of the 19th international conference on World wide web, pages 571–580, 2010
2010
-
[66]
J. D. Lee, D. L. Sun, Y. Sun, and J. E. Taylor. Exact post-selection inference, with application to the lasso. The Annals of Statistics, 44(3):907–927, 2016
2016
-
[67]
Li, C.-Y
Y. Li, C.-Y. Chen, and W. W. Wasserman. Deep feature selection: theory and application to identify enhancers and promoters.Journal of Computational Biology, 23(5):322–336, 2016
2016
-
[68]
Themythosofmodelinterpretability: Inmachinelearning, theconceptofinterpretability is both important and slippery.Queue, 16(3):31–57, 2018
Z.C.Lipton. Themythosofmodelinterpretability: Inmachinelearning, theconceptofinterpretability is both important and slippery.Queue, 16(3):31–57, 2018
2018
-
[69]
Little, L
C. Little, L. Zheng, and G. Allen. iloco: Distribution-free inference for feature interactions.arXiv preprint arXiv:2502.06661, 2025
2025 arXiv
-
[70]
Liu and M
B. Liu and M. Udell. Impact of accuracy on model interpretations.arXiv preprint arXiv:2011.09903, 2020
2011 arXiv
-
[71]
H. Liu, K. Roeder, and L. Wasserman. Stability approach to regularization selection (stars) for high dimensional graphical models.Advances in neural information processing systems, 23, 2010
2010
-
[72]
E. F. Lock and D. B. Dunson. Bayesian consensus clustering.Bioinformatics, 29(20):2610–2616, 2013
2013
-
[73]
Y. Y. Lu, Y. Fan, J. Lv, and W. S. Noble. Deeppink: reproducible feature selection in deep neural networks. arXiv preprint arXiv:1809.01185, 2018
2018 arXiv
-
[74]
Lundberg and S.-I
S. Lundberg and S.-I. Lee. A unified approach to interpreting model predictions.arXiv preprint arXiv:1705.07874, 2017
2017 arXiv
-
[75]
MacQueen et al
J. MacQueen et al. Some methods for classification and analysis of multivariate observations. In Proceedings of the fifth Berkeley symposium on mathematical statistics and probability, volume 1, pages 281–297. Oakland, CA, USA, 1967
1967
-
[76]
M. M. Martínez-Ortega, L. Delgado, D. C. Albach, J. A. Elena-Rosselló, and E. Rico. Species boundaries and phylogeographic patterns in cryptic taxa inferred from aflp markers: Veronica subgen. pentasepalae (scrophulariaceae) in the western mediterranean.Systematic Botany, 29(4...
2004
-
[77]
McInnes, J
L. McInnes, J. Healy, and J. Melville. Umap: Uniform manifold approximation and projection for dimension reduction. arXiv preprint arXiv:1802.03426, 2018
2018 arXiv
-
[78]
M. Meilă. Comparing clusterings—an information based distance.Journal of multivariate analysis, 98(5):873–895, 2007. 52
2007
-
[79]
Meinshausen and P
N. Meinshausen and P. Bühlmann. Stability selection.Journal of the Royal Statistical Society Series B: Statistical Methodology, 72(4):417–473, 2010
2010
-
[80]
Mentch and G
L. Mentch and G. Hooker. Quantifying uncertainty in random forests via confidence intervals and hypothesis tests. The Journal of Machine Learning Research, 17(1):841–881, 2016
2016
-
[81]
E. Min, X. Guo, Q. Liu, G. Zhang, J. Cui, and J. Long. A survey of clustering with deep learning: From the perspective of network architecture.IEEE Access, 6:39501–39514, 2018
2018
-
[82]
C. Molnar. Interpretable Machine Learning. 2019
2019
-
[83]
Montavon, A
G. Montavon, A. Binder, S. Lapuschkin, W. Samek, and K.-R. Müller. Layer-wise relevance propagation: an overview. Explainable AI: interpreting, explaining and visualizing deep learning, pages 193–209, 2019
2019
-
[84]
Monteleoni, G
C. Monteleoni, G. A. Schmidt, and S. McQuade. Climate informatics: accelerating discovering in climate science with machine learning.Computing in Science & Engineering, 15(5):32–40, 2013
2013
-
[85]
Monti, P
S. Monti, P. Tamayo, J. Mesirov, and T. Golub. Consensus clustering: a resampling-based method for class discovery and visualization of gene expression microarray data.Machine learning, 52:91–118, 2003
2003
-
[86]
C. L. Müller, R. Bonneau, and Z. Kurtz. Generalized stability approach for regularized graphical models. arXiv preprint arXiv:1605.07072, 2016
2016 arXiv
-
[87]
W. J. Murdoch, C. Singh, K. Kumbier, R. Abbasi-Asl, and B. Yu. Definitions, methods, and applications in interpretable machine learning.Proceedings of the National Academy of Sciences, 116(44):22071–22080, 2019
2019
-
[88]
W. J. Murdoch, C. Singh, K. Kumbier, R. Abbasi-Asl, and B. Yu. Interpretable machine learning: definitions, methods, and applications.arXiv preprint arXiv:1901.04592, 2019
1901 arXiv
-
[89]
F. Murtagh. A survey of recent advances in hierarchical clustering algorithms.The computer journal, 26(4):354–359, 1983
1983
-
[90]
L. H. Nguyen and S. Holmes. Ten quick tips for effective dimensionality reduction.PLoS computational biology, 15(6):e1006907, 2019
2019
-
[91]
Papernot and P
N. Papernot and P. McDaniel. Deep k-nearest neighbors: Towards confident, interpretable and robust deep learning.arXiv preprint arXiv:1803.04765, 2018
2018 arXiv
-
[92]
Pedregosa, G
F. Pedregosa, G. Varoquaux, A. Gramfort, V. Michel, B. Thirion, O. Grisel, M. Blondel, P. Pretten- hofer, R. Weiss, V. Dubourg, J. Vanderplas, A. Passos, D. Cournapeau, M. Brucher, M. Perrot, and E. Duchesnay. Scikit-learn: Machine learning in Python.Journal of Machine Learnin...
2011
-
[93]
D. Pollard. Strong consistency of k-means clustering.The Annals of Statistics, pages 135–140, 1981. 53
1981
-
[94]
M. H. Rafiei and H. Adeli. A novel machine learning model for estimation of sale prices of real estate units. Journal of Construction Engineering and Management, 142(2):04015066, 2016
2016
-
[95]
W. M. Rand. Objective criteria for the evaluation of clustering methods.Journal of the American Statistical association, 66(336):846–850, 1971
1971
-
[96]
Real and J
R. Real and J. M. Vargas. The probabilistic basis of jaccard’s index of similarity.Systematic biology, 45(3):380–385, 1996
1996
-
[97]
D. A. Reynolds et al. Gaussian mixture models.Encyclopedia of biometrics, 741(659-663):3, 2009
2009
-
[98]
why should i trust you?
M. T. Ribeiro, S. Singh, and C. Guestrin. " why should i trust you?" explaining the predictions of any classifier. InProceedings of the 22nd ACM SIGKDD international conference on knowledge discovery and data mining, pages 1135–1144, 2016
2016
-
[99]
M. T. Ribeiro, S. Singh, and C. Guestrin. Anchors: High-precision model-agnostic explanations. In Proceedings of the AAAI Conference on Artificial Intelligence, volume 32, 2018
2018
-
[100]
L. Rokach. A survey of clustering algorithms.Data mining and knowledge discovery handbook, pages 269–298, 2010
2010
-
[101]
J. D. Romano, T. T. Le, W. La Cava, J. T. Gregg, D. J. Goldberg, P. Chakraborty, N. L. Ray, D. Himmelstein, W. Fu, and J. H. Moore. Pmlb v1.0: an open source dataset collection for benchmarking machine learning methods.arXiv preprint arXiv:2012.00058v2, 2021
2012 arXiv
-
[102]
Roscher, B
R. Roscher, B. Bohn, M. F. Duarte, and J. Garcke. Explainable machine learning for scientific insights and discoveries.IEEE Access, 8:42200–42216, 2020
2020
-
[103]
Rosenberg and J
A. Rosenberg and J. Hirschberg. V-measure: A conditional entropy-based external cluster evaluation measure. In Proceedings of the 2007 joint conference on empirical methods in natural language processing and computational natural language learning (EMNLP-CoNLL), pages 410–420, 2007
2007
-
[104]
F. Rossi. Building trust in artificial intelligence.Journal of international affairs, 72(1):127–134, 2018
2018
-
[105]
C. Rudin. Stop explaining black box machine learning models for high stakes decisions and use interpretable models instead.Nature Machine Intelligence, 1(5):206–215, 2019
2019
-
[106]
Rudin, C
C. Rudin, C. Chen, Z. Chen, H. Huang, L. Semenova, and C. Zhong. Interpretable machine learning: Fundamental principles and 10 grand challenges.Statistics Surveys, 16:1–85, 2022
2022
-
[107]
Sah and E
P. Sah and E. Fokoué. What do asian religions have in common? an unsupervised text analytics exploration. arXiv preprint arXiv:1912.10847, 2019
1912 arXiv
-
[108]
D. Sculley. Web-scale k-means clustering. InProceedings of the 19th international conference on World wide web, pages 1177–1178, 2010
2010
-
[109]
R. R. Selvaraju, A. Das, R. Vedantam, M. Cogswell, D. Parikh, and D. Batra. Grad-cam: Why did you say that?arXiv preprint arXiv:1611.07450, 2016. 54
2016 arXiv
-
[110]
Shi and J
J. Shi and J. Malik. Normalized cuts and image segmentation.IEEE Transactions on pattern analysis and machine intelligence, 22(8):888–905, 2000
2000
-
[111]
G. S. Shieh. A weighted kendall’s tau statistic.Statistics & probability letters, 39(1):17–24, 1998
1998
-
[112]
Shrikumar, P
A. Shrikumar, P. Greenside, and A. Kundaje. Learning important features through propagating activation differences. InInternational Conference on Machine Learning, pages 3145–3153. PMLR, 2017
2017
-
[113]
Siau and W
K. Siau and W. Wang. Building trust in artificial intelligence, machine learning, and robotics.Cutter business technology journal, 31(2):47–53, 2018
2018
-
[114]
Simonyan, A
K. Simonyan, A. Vedaldi, and A. Zisserman. Deep inside convolutional networks: Visualising image classification models and saliency maps.arXiv preprint arXiv:1312.6034, 2013
2013 arXiv
-
[115]
J. T. Springenberg, A. Dosovitskiy, T. Brox, and M. Riedmiller. Striving for simplicity: The all convolutional net.arXiv preprint arXiv:1412.6806, 2014
2014 arXiv
-
[116]
Strobl, A.-L
C. Strobl, A.-L. Boulesteix, T. Kneib, T. Augustin, and A. Zeileis. Conditional variable importance for random forests.BMC bioinformatics, 9(1):1–11, 2008
2008
-
[117]
Strobl, A.-L
C. Strobl, A.-L. Boulesteix, A. Zeileis, and T. Hothorn. Bias in random forest variable importance measures: Illustrations, sources and a solution.BMC bioinformatics, 8(1):1–21, 2007
2007
-
[118]
Sundararajan, A
M. Sundararajan, A. Taly, and Q. Yan. Axiomatic attribution for deep networks. InInternational Conference on Machine Learning, pages 3319–3328. PMLR, 2017
2017
-
[119]
Tibshirani
R. Tibshirani. Regression shrinkage and selection via the lasso.Journal of the Royal Statistical Society: Series B (Methodological), 58(1):267–288, 1996
1996
-
[120]
R. J. Tibshirani, J. Taylor, R. Lockhart, and R. Tibshirani. Exact post-selection inference for sequential regression procedures.Journal of the American Statistical Association, 111(514):600–620, 2016
2016
-
[121]
Tolles and W
J. Tolles and W. J. Meurer. Logistic regression: relating patient characteristics to outcomes.Jama, 316(5):533–534, 2016
2016
-
[122]
Tomsett, D
R. Tomsett, D. Braines, D. Harborne, A. Preece, and S. Chakraborty. Interpretable to whom? a role- based model for analyzing interpretable machine learning systems.arXiv preprint arXiv:1806.07552, 2018
2018 arXiv
-
[123]
Toreini, M
E. Toreini, M. Aitken, K. Coopamootoo, K. Elliott, C. G. Zelaya, and A. Van Moorsel. The relationship between trust in ai and trustworthy machine learning technologies. InProceedings of the 2020 conference on fairness, accountability, and transparency, pages 272–283, 2020
2020
-
[124]
N. G. Trillos and D. Slepčev. A variational approach to the consistency of spectral clustering.Applied and Computational Harmonic Analysis, 45(2):239–281, 2018. 55
2018
-
[125]
Van der Maaten and G
L. Van der Maaten and G. Hinton. Visualizing data using t-sne.Journal of machine learning research, 9(11), 2008
2008
-
[126]
van Zetten, G
W. van Zetten, G. Ramackers, and H. Hoos. Increasing trust and fairness in machine learning applications within the mortgage industry.Machine Learning with Applications, 10:100406, 2022
2022
-
[127]
Verma, V
S. Verma, V. Boonsanong, M. Hoang, K. E. Hines, J. P. Dickerson, and C. Shah. Counterfactual expla- nations and algorithmic recourses for machine learning: A review.arXiv preprint arXiv:2010.10596, 2020
2010 arXiv
-
[128]
Vilone and L
G. Vilone and L. Longo. Explainable artificial intelligence: a systematic review.arXiv preprint arXiv:2006.00093, 2020
2006 arXiv
-
[129]
Von Luxburg
U. Von Luxburg. A tutorial on spectral clustering.Statistics and computing, 17:395–416, 2007
2007
-
[130]
Von Luxburg, M
U. Von Luxburg, M. Belkin, and O. Bousquet. Consistency of spectral clustering.The Annals of Statistics, pages 555–586, 2008
2008
-
[131]
Wackerly, W
D. Wackerly, W. Mendenhall, and R. L. Scheaffer.Mathematical statistics with applications. Cengage Learning, 2014
2014
-
[132]
D. S. Watson and L. Floridi. The explanation game: a formal framework for interpretable machine learning. In Ethics, Governance, and Policies in Artificial Intelligence, pages 185–219. Springer, 2021
2021
-
[133]
Webber, A
W. Webber, A. Moffat, and J. Zobel. A similarity measure for indefinite rankings.ACM Transactions on Information Systems (TOIS), 28(4):1–38, 2010
2010
-
[134]
J. N. Weinstein, E. A. Collisson, G. B. Mills, K. R. M. Shaw, B. A. Ozenberger, K. Ellrott, I. Shmulevich, C. Sander, and J. M. Stuart. The cancer genome atlas pan-cancer analysis project. Nature genetics, 45(10):1113–1120, 2013
2013
-
[135]
B. D. Williamson, P. B. Gilbert, N. R. Simon, and M. Carone. A general framework for inference on algorithm-agnostic variable importance.Journal of the American Statistical Association, (just- accepted):1–38, 2021
2021
-
[136]
Wiwie, J
C. Wiwie, J. Baumbach, and R. Röttger. Comparing the performance of biomedical clustering methods. Nature methods, 12(11):1033–1038, 2015
2015
-
[137]
J. Wu, H. Liu, H. Xiong, J. Cao, and J. Chen. K-means-based consensus clustering: A unified view. IEEE transactions on knowledge and data engineering, 27(1):155–169, 2014
2014
-
[138]
Xanthopoulos
P. Xanthopoulos. A review on consensus clustering methods.Optimization in Science and Engineering: In Honor of the 60th Birthday of Panos M. Pardalos, pages 553–566, 2014
2014
-
[139]
L. Xia, C. Lee, and J. J. Li. Statistical method scdeed for detecting dubious 2d single-cell embeddings and optimizing t-sne and umap hyperparameters.Nature Communications, 15(1):1753, 2024. 56
2024
-
[140]
Xu and D
R. Xu and D. Wunsch. Survey of clustering algorithms.IEEE Transactions on neural networks, 16(3):645–678, 2005
2005
-
[141]
Xu and R
Y. Xu and R. Goodacre. On splitting training and validation set: a comparative study of cross- validation, bootstrap and systematic sampling for estimating the generalization performance of supervised learning. Journal of analysis and testing, 2(3):249–262, 2018
2018
-
[142]
Yilmaz, J
E. Yilmaz, J. A. Aslam, and S. Robertson. A new rank correlation coefficient for information retrieval. In Proceedings of the 31st annual international ACM SIGIR conference on Research and development in information retrieval, pages 587–594, 2008
2008
-
[143]
B. Yu. Veridical data science. InProceedings of the 13th international conference on web search and data mining, pages 4–5, 2020
2020
-
[144]
Zantalis, G
F. Zantalis, G. Koulouras, S. Karabetsos, and D. Kandris. A review of machine learning and iot in smart transportation. Future Internet, 11(4):94, 2019
2019
-
[145]
M. D. Zeiler and R. Fergus. Visualizing and understanding convolutional networks. InEuropean conference on computer vision, pages 818–833. Springer, 2014
2014
-
[146]
Zhang, R
T. Zhang, R. Ramakrishnan, and M. Livny. Birch: an efficient data clustering method for very large databases. ACM sigmod record, 25(2):103–114, 1996
1996
-
[147]
why should you trust my explanation?
Y. Zhang, K. Song, Y. Sun, S. Tan, and M. Udell. " why should you trust my explanation?" understanding uncertainty in lime explanations.arXiv preprint arXiv:1904.12991, 2019
1904 arXiv
-
[148]
T. M. Zikry and G. I. Allen. Limeade: Local interpretable manifold explanations for dimension evaluations. InICLR 2025 Workshop on Machine Learning for Genomics Explorations
2025
-
[149]
T. M. Zikry, S. C. Wolff, J. S. Ranek, H. M. Davis, A. Naugle, N. Luthra, A. A. Whitman, K. M. Kedziora, W. Stallaert, M. R. Kosorok, et al. Cell cycle plasticity underlies fractional resistance to palbociclib in er+/her2- breast tumor cells.Proceedings of the National Academy...
2024
-
[150]
J. R. Zilke, E. L. Mencía, and F. Janssen. Deepred–rule extraction from deep neural networks. In International Conference on Discovery Science, pages 457–473. Springer, 2016
2016
-
[151]
Ziyan, M
U. Ziyan, M. R. Sabuncu, W. E. L. Grimson, and C.-F. Westin. Consistency clustering: a robust algorithm for group-wise registration, segmentation and automatic atlas construction in diffusion mri. International journal of computer vision, 85(3):279–290, 2009. 57
2009
Reviewed August 7, 2026 · model on record in the stance chip above.
Discussion (0). Sign in to comment.