REVIEW 2 major objections 1 minor 1 cited by
Hierarchical simulations map when CUPED, CUPAC and DR estimators improve efficiency over cluster-robust baselines in switchback experiments.
Reviewed by Pith at T0; open to challenge. T0 means a machine referee read the full paper against a public rubric. the ladder, T0–T4 →
T0 review · grok-4.3
2026-06-29 03:44 UTC pith:JRVHNAXR
load-bearing objection This is a simulation study that maps when CUPED, CUPAC, and DR beat cluster-robust baselines in switchbacks, but the map rests on uncalibrated generative assumptions. the 2 major comments →
Design-Aware Variance Reduction for Switchback Experiments: A Comparative Study
The pith
A machine-rendered reading of the paper's core claim, the machinery that carries it, and where it could break.
Core claim
Through a hierarchical simulation framework that varies number of clusters, cluster-size imbalance, within-cluster autocorrelation, carryover, and predictive signal strength, the authors produce a practitioner-oriented regime map showing when CUPED, CUPAC, or DR estimators are most beneficial versus baseline switchback analysis with cluster-robust standard errors, while also quantifying bias and inference degradation under mild interference.
What carries the argument
The hierarchical simulation framework that systematically varies number of clusters, cluster-size imbalance, within-cluster autocorrelation, carryover, and predictive signal strength to generate the regime map of estimator performance.
Load-bearing premise
The chosen simulation regimes and parameter ranges accurately represent the dependence structures, interference patterns, and covariate strengths encountered in real online-platform switchback experiments.
What would settle it
A deployed switchback experiment whose measured cluster count, size imbalance, autocorrelation, and carryover produce variance reduction or coverage that deviates substantially from the regime map predictions for those parameter values.
If this is right
- CUPED, CUPAC, and DR estimators deliver standard error reductions and power gains primarily when predictive signal strength is high and within-cluster autocorrelation and carryover remain moderate.
- Baseline cluster-robust analysis remains preferable under high cluster-size imbalance or strong time dependence that limits finite-sample improvements.
- Mild cross-cluster spillovers introduce measurable bias whose magnitude increases with interference strength and degrades confidence interval coverage.
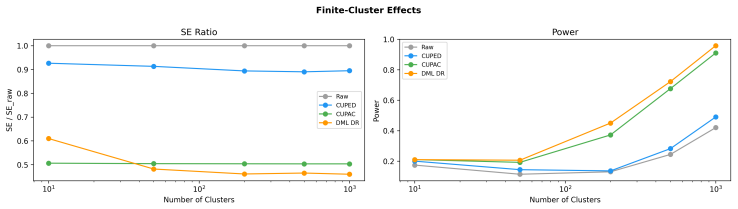
- Efficiency gains from advanced estimators scale with run length but plateau earlier when finite-cluster effects dominate.
Where Pith is reading between the lines
- Platforms could pre-compute expected parameters from historical data to select the estimator before launching a switchback test.
- The regime map suggests testing hybrid approaches that switch between CUPED and baseline based on real-time estimates of autocorrelation during the experiment.
- Extending the framework to include network-structured interference beyond simple spillovers would address common platform settings with user overlap across clusters.
Editorial analysis
A structured set of objections, weighed in public.
Referee Report
Summary. The paper evaluates design-aware variance reduction methods (CUPED, CUPAC, and doubly robust estimators) for switchback experiments relative to a baseline with cluster-robust standard errors. Using a hierarchical simulation framework varying number of clusters, cluster-size imbalance, within-cluster autocorrelation, carryover, and predictive signal strength, it assesses validity (FPR, CI coverage) and efficiency (SE reduction, power, MDE) metrics and produces a practitioner regime map, with sensitivity analysis for cross-cluster spillovers.
Significance. If the simulation regimes are representative, the regime map offers practical guidance on when covariate-adjusted estimators improve efficiency in clustered time-series experiments without compromising validity. The hierarchical design and interference sensitivity are strengths for a simulation study in experimental design.
major comments (2)
- [Simulation framework] Simulation framework (abstract and methods): the chosen ranges and generative models for within-cluster autocorrelation, carryover, and cross-cluster spillovers are not calibrated or validated against empirical moments from production switchback data on online platforms. This is load-bearing for the central claim that the resulting regime map guides real decisions, as the map's recommendations remain conditional on unverified assumptions about dependence structures.
- [Results] §4 (Results and regime map): the efficiency gains for CUPAC and DR are reported as functions of run length and signal strength, but without explicit checks that the ML covariate models in CUPAC avoid overfitting in finite-cluster regimes or that DR remains doubly robust under the simulated carryover, the map's 'most beneficial' regions may overstate gains.
minor comments (1)
- [Abstract] Abstract: the description of the hierarchical framework could more explicitly list the exact generative models used for each parameter (e.g., AR(1) coefficients for autocorrelation).
Simulated Author's Rebuttal
We thank the referee for their constructive comments on our simulation study. We address each major comment below and have revised the manuscript to incorporate clarifications and additional checks where feasible.
read point-by-point responses
-
Referee: Simulation framework (abstract and methods): the chosen ranges and generative models for within-cluster autocorrelation, carryover, and cross-cluster spillovers are not calibrated or validated against empirical moments from production switchback data on online platforms. This is load-bearing for the central claim that the resulting regime map guides real decisions, as the map's recommendations remain conditional on unverified assumptions about dependence structures.
Authors: We agree that the simulation parameters are not calibrated to specific empirical moments from proprietary production data. The ranges were selected based on values commonly reported in the literature on online experiments and clustered time-series designs. We will revise the methods and discussion sections to explicitly note this limitation, clarify that the regime map represents an exploratory sensitivity analysis across plausible regimes rather than calibrated recommendations for real decisions, and add references to prior studies using similar parameter ranges. revision: yes
-
Referee: §4 (Results and regime map): the efficiency gains for CUPAC and DR are reported as functions of run length and signal strength, but without explicit checks that the ML covariate models in CUPAC avoid overfitting in finite-cluster regimes or that DR remains doubly robust under the simulated carryover, the map's 'most beneficial' regions may overstate gains.
Authors: We will add new supplementary analyses in the revised manuscript to address these concerns. This includes cross-validation diagnostics for the ML models used in CUPAC across finite-cluster settings to assess overfitting risk, and targeted simulations verifying the double robustness property of the DR estimator when carryover is present in the data-generating process but not explicitly modeled in the adjustment. These additions will help substantiate the reported efficiency gains. revision: yes
- Calibration and validation of the generative models against empirical moments from production switchback data on online platforms, as such data is proprietary and unavailable.
Circularity Check
No significant circularity; simulation-based evaluation is self-contained
full rationale
The paper presents a comparative simulation study of variance reduction methods (CUPED, CUPAC, DR) versus baseline cluster-robust analysis for switchback experiments. It varies parameters such as number of clusters, imbalance, autocorrelation, carryover, and signal strength in a hierarchical framework to generate a regime map on validity and efficiency. No load-bearing derivations, predictions, or uniqueness claims reduce by construction to fitted inputs or self-citations. The central output is empirical performance metrics from simulations, with no equations or steps that equate outputs to inputs tautologically. This is a standard non-circular simulation design.
Axiom & Free-Parameter Ledger
free parameters (5)
- number of clusters
- cluster-size imbalance
- within-cluster autocorrelation
- carryover
- predictive signal strength
axioms (1)
- domain assumption The hierarchical simulation framework generates data whose dependence structure matches real switchback experiments sufficiently for the validity and efficiency conclusions to transfer.
read the original abstract
Switchback experiments and other clustered randomized designs are widely used on online platforms, but the clustered, time-dependent nature of these designs can make standard variance reduction methods behave differently than in standard A/B tests. We evaluate design-aware variance reduction methods for switchbacks -- CUPED, CUPAC (ML-based covariate adjustment), and doubly robust (DR) estimators -- relative to a baseline switchback analysis with cluster-robust standard errors. Through a hierarchical simulation framework that varies key regime parameters -- number of clusters, cluster-size imbalance, within-cluster autocorrelation, carryover, and predictive signal strength -- we evaluate validity (false positive rate and confidence interval coverage) and efficiency (standard error reduction, power, and minimum detectable effect as a function of run length). We also include a sensitivity analysis for cross-cluster spillovers to quantify bias and inference degradation under mild interference. The primary outcome is a practitioner-oriented regime map: when CUPED, CUPAC, or DR are most beneficial, and when time and cluster dependence and finite-cluster effects limit improvements.
Figures



Forward citations
Cited by 1 Pith paper
-
Power-Optimal Covariate Adjustment for Switchback Experiments
Training the CUPAC covariate and its regression coefficient with a between-cell-weighted loss improves switchback estimator power, with gains concentrated in within-noise-dominated regimes.
Reference graph
Works this paper leans on
-
[1]
W., Masoero, L., McQueen, J., Richardson, T., and Rosen, I
Bajari, P., Burdick, B., Imbens, G. W., Masoero, L., McQueen, J., Richardson, T., and Rosen, I. M. (2023). Experimental design in marketplaces.Statistical Science, 38(3):458–476
2023
-
[2]
and Shephard, N
Bojinov, I. and Shephard, N. (2019). Time series experiments and causal estimands: Exact randomization tests and trading.Journal of the American Statistical Associ- ation, 114(528):1665–1682
2019
-
[3]
Bojinov, I., Simchi-Levi, D., and Zhao, J. (2023). Design and analysis of switchback experiments.Management Science, 69(7):3759–3777
2023
-
[4]
Cameron, A. C. and Miller, D. L. (2015). A practitioner’s guide to cluster-robust inference.Journal of Human Resources, 50(2):317–372
2015
-
[5]
Chamandy, N. (2016). Experimentation in a ridesharing marketplace. Lyft Engineering Blog
2016
-
[6]
Chernozhukov, V., Chetverikov, D., Demirer, M., Duflo, E., Hansen, C., Newey, W., and Robins, J. (2018). Double/debiased machine learning for treatment and structural parameters.The Econometrics Journal, 21(1):C1–C68
2018
-
[7]
Deng, A., Xu, Y., Kohavi, R., and Walker, T. (2013). Improving the sensitivity of online controlled experiments by utilizing pre-experiment data. InProceedings of the Sixth ACM International Conference on Web Search and Data Mining, pages 123–132
2013
-
[8]
M., Ashby, D., and Kerry, S
Eldridge, S. M., Ashby, D., and Kerry, S. (2006). Sample size for cluster random- ized trials: effect of coefficient of variation of cluster size and analysis method. International journal of epidemiology, 35(5):1292–1300
2006
-
[9]
R., Ronchetti, E
Hampel, F. R., Ronchetti, E. M., Rousseeuw, P. J., and Stahel, W. A. (1986).Robust Statistics: The Approach Based on Influence Functions. John Wiley & Sons
1986
-
[10]
arXiv preprint arXiv:2209.00197 , year=
Hu, Y. and Wager, S. (2022). Switchback experiments under geometric mixing.arXiv preprint arXiv:2209.00197
-
[11]
Huber, P. J. (1964). Robust estimation of a location parameter.The Annals of Mathematical Statistics, 35(1):73–101
1964
-
[12]
Johari, R., Li, H., Liskovich, I., and Weintraub, G. Y. (2022). Experimental design in two-sided platforms: An analysis of bias.Management Science, 68(10):7069–7089
2022
-
[13]
(1965).Survey Sampling
Kish, L. (1965).Survey Sampling. John Wiley & Sons
1965
-
[14]
(2020).Trustworthy Online Controlled Experiments: A Practical Guide to A/B Testing
Kohavi, R., Tang, D., and Xu, Y. (2020).Trustworthy Online Controlled Experiments: A Practical Guide to A/B Testing. Cambridge University Press. 17
2020
-
[15]
Li, J. (2020). Improving experimental power through control using predictions as covariate (CUPAC). DoorDash Engineering Blog
2020
-
[16]
and Zeger, S
Liang, K.-Y. and Zeger, S. L. (1986). Longitudinal data analysis using generalized linear models.Biometrika, 73(1):13–22
1986
-
[17]
Pankratev, S. (2026). Powerful switchback experiments — Or not? Working paper
2026
-
[18]
Poyarkov, A., Drutsa, A., Khalyavin, A., Gusev, G., and Serdyukov, P. (2016). Boosted decision tree regression adjustment for variance reduction in online controlled experiments. InProceedings of the 22nd ACM SIGKDD International Conference on Knowledge Discovery and Data Mining, pages 235–244
2016
-
[19]
M., Rotnitzky, A., and Zhao, L
Robins, J. M., Rotnitzky, A., and Zhao, L. P. (1994). Estimation of regression coefficients when some regressors are not always observed.Journal of the American Statistical Association, 89(427):846–866
1994
-
[20]
Rubin, D. B. (1980). Randomization analysis of experimental data: The Fisher randomization test comment.Journal of the American Statistical Association, 75(371):591–593. Staponait˙ e, G., Gamper, J., Giňi¯ unait˙ e, R., and Reklait˙ e, A. (2025). Variance reduction in online marketplace A/B testing. InKDD Workshop on Uplift Modeling and Causal Inference (UMC)
1980
-
[21]
Xiong, R., Chin, A., and Taylor, S. J. (2024). Data-driven switchback experiments: Theoretical tradeoffs and empirical bayes designs.arXiv preprint arXiv:2406.06768. 18 A Supplementary Tables This appendix provides the full numerical results underlying the figures in Section 5. All regimes useτ= 20with 200 replications except where noted. Table 5: Baselin...
discussion (0)
Sign in with ORCID, Apple, or X to comment. Anyone can read and Pith papers without signing in.