REVIEW 3 major objections 5 minor 26 references
Measurement of photo- and radio-luminescence of thin ThF4 films
T0 review · 3 major / 5 minor · reviewed 2026-08-06 · deepseek-v4-flash
Pith's one-line read Thin ThF4 films are quiet enough in the UV to serve as a 229mTh nuclear-clock target.
desk verdict First ThF4 luminescence data look solid, but the background projection in Sec. 8 uses a wrong mean path for internal alphas and the signal estimate has an unaddressed factor-of-6 discrepancy. read the letter →
The pith
A machine-rendered reading of the paper's core claim, the machinery that carries it, and where it could break.
The reading
What carries the argument
The load-bearing element is a single-photoelectron counting measurement in two spectral bands. The authors illuminate a ThF4 film with a vacuum-ultraviolet lamp, move the sample to a photomultiplier station, and count pulses in an ADC window from one-third to four-thirds of the single-photoelectron amplitude, isolating faint UV luminescence from a 0.1 Hz dark background. For radio-luminescence they place an alpha source above the sample and subtract substrate-side measurements, using Monte Carlo acceptance simulations to convert observed rates into light yields. The argument that carries the conclusion is a volume-scaling law: luminescence background is proportional to film thickness, while the 229mTh excitation rate is proportional to the areal density of 229Th, so thinning the film and raising enrichment improves signal to background. The expected signal uses the resonant photo-excitation cross section with 1 kBq/cm2 of 229Th and the n3-dependent isomer width.
What would settle it
Measure UV photo- and radio-luminescence of an actual 50 nm ThF4 film, crystalline and if possible 229Th-doped, under the same lamp and alpha-source geometry. If the UV photo-luminescence does not drop by roughly the predicted factor of 20 relative to the 200 nm film, or if the radio-luminescence at 1 kBq exceeds about 0.1 Hz in 360 s windows, the Section 8 background budget fails.
Extended reading notes
Core claim
On its own terms, the paper's discovery is that ThF4 thin films are quiet enough in the UV to serve as a 229mTh host. Comparing UV luminescence rates measured on the ThF4 side and the substrate side of two commercial optics, the authors isolate 0.70 ± 0.06 Hz (200 nm) and 1.03 ± 0.07 Hz (300 nm) of alpha-induced UV radio-luminescence, whose ratio matches the 1.5 thickness ratio, and a UV photo-luminescence of about 0.23 Hz decaying with a ~400 s lifetime. They then argue that because the background scales with film volume while the 229mTh signal is set by the surface density of 229Th, a 1 cm2, 50 nm film can cut these backgrounds by a factor of about 20 while enrichment keeps the signal at a ~1.1 Hz excitation rate, yielding about six detected decays in 360 s at a 0.027 Hz peak rate. The conclusion is the central sentence of Section 8: the measured backgrounds are significant but do not exceed acceptable limits. The same data also single out ThF4 as a host whose refractive index near 150 nm is far enough from previously tested crystals to test the predicted n3 scaling of the isomer linewidth.
Load-bearing premise
The projection assumes the luminescence measured in thick commercial amorphous films scales linearly with film volume down to a 50 nm crystalline film, and that the 229mTh signal can be held fixed by enrichment; neither a thin film, a crystalline film, nor a 229Th-doped film was measured.
Editorial extensions
If this is right
- A 1 cm2, 50 nm ThF4 film with high 229Th enrichment should show UV photo-luminescence below the expected 229mTh signal rate, making the isomer decay visible in a few hundred seconds.
- The internal alpha radio-luminescence of the proposed film is estimated at 0.2 Hz, requiring repeated long runs for statistical significance rather than a single measurement.
- Visible luminescence of ThF4 is high enough to serve as a veto channel, with negligible probability of accidental coincidence with the UV signal.
- The same apparatus can be used directly to search for 229mTh excitation and decay in ThF4, with a natural-Th control sample needed to separate the 400 s luminescence from the isomer lifetime.
- A successful ThF4 target would provide a solid-state test of the predicted n3 enhancement of the 229mTh radiative width, since ThF4's refractive index differs strongly from previously tested crystals.
Reading between the lines
- If the 400 s UV photo-luminescence decay shares a similar timescale with the expected isomer decay, the volume-scaling assumption should be checked against films of several thicknesses; a surface or defect origin of the luminescence would break that assumption.
- The 50 nm film changes the optical boundary condition: the paper estimates that frustrated total internal reflection recovers about half the acceptance, but a sub-wavelength film could exhibit interference or waveguiding effects that alter both acceptance and the apparent decay rate.
- A natural extension would be to measure luminescence as a function of film thickness and crystallinity, directly testing the linear volume scaling and separating bulk scintillation from substrate or interface contributions.
Editorial analysis
A structured set of objections, weighed in public.
Referee Report
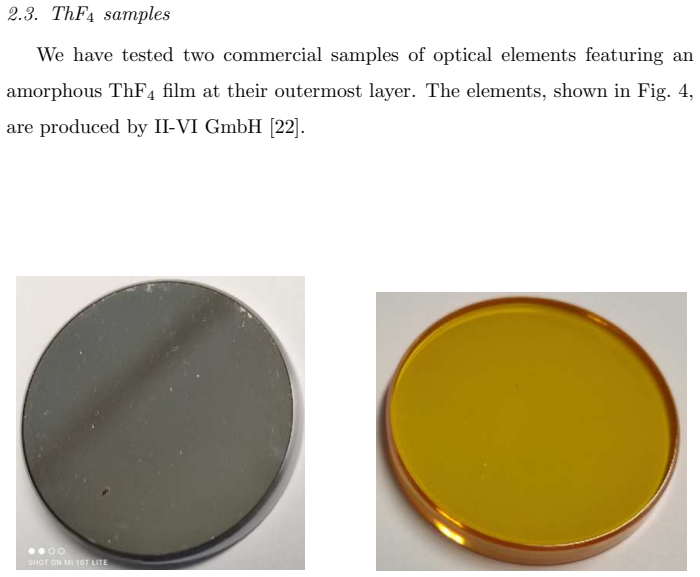
Summary. The manuscript reports measurements of VUV-excited photo-luminescence and 241Am alpha-induced radio-luminescence from commercially produced amorphous ThF4 films (200 nm on ZnSe, 300 nm on Si), using a slow charge-sensitive PMT readout with separate VUV and visible detectors. The authors find that UV luminescence rates are comparable to PMT dark counts (0.23 Hz photo-luminescence from the 200 nm film; 0.70 ± 0.06 Hz UV radio-luminescence from the 200 nm film), derive rough light yields (≈0.09 photons/keV at 180 nm in the UV), and use Geant4 acceptance simulations to project signal and background rates for a hypothetical 50 nm, 1 cm2, 1 kBq 229Th-doped ThF4 target. They conclude that the measured backgrounds are significant but acceptable for detecting roughly six 229mTh decay events in 360 s.
Significance. If the central projection were valid, this would be a useful first characterization of ThF4 thin-film luminescence for nuclear-clock applications, and the measured film-thickness scaling (1.46 ± 0.16 for a 1.5 thickness ratio) is a nice internal consistency check. The paper reports reproducible raw rates and a conservative readout scheme, and it gives Geant4-based acceptance estimates. However, two load-bearing quantitative steps—the numerical evaluation of Eq. (7) and the geometric rescaling of internal radio-luminescence in Sec. 8—are not correct as written; both need revision before the viability conclusion can be relied on.
major comments (3)
- [Sec. 7, Eq. (7)] Equation (7) is not evaluated as stated. With the quoted flux dNγ/dtdλ(λ0) = 1.6×10^13 ph/(cm2 s nm) and n(150 nm) ≈ 1.826, n^3 ≈ 6.09, the expression 6.7×10^-14 nm × n^3 × dNγ/dtdλ gives approximately 6.5 Hz, not 1.1 Hz. The subsequent numbers 217 signal events, 6 detected events, and the 0.017 Hz average signal rate in Sec. 7 are all derived from the 1.1 Hz value; until this arithmetic is corrected (or the flux/units are clarified), the signal-to-background ratios quoted in Sec. 8 are internally inconsistent.
- [Sec. 8, radio-luminescence bullet] The rescaling of the measured external-alpha radio-luminescence to internal 229Th activity uses an incorrect mean path. For an isotropic internal source in a 50 nm slab, the average path length in the film before exiting is not t/2 = 25 nm: the distance to the surface in direction θ is z/|cosθ| or (t − z)/|cosθ|, and for a slab with lateral size large compared with the alpha range R the mean path is of order t ln(R/t). With t = 50 nm and R ≈ 10 µm this is ≈0.27 µm, more than ten times the value assumed in the text. The resulting internal UV radio-luminescence background is therefore plausibly several hertz rather than 0.2 Hz, exceeding the <0.1 Hz continuous-background budget set in Sec. 7. The conclusion that the internal radio-luminescence is 'within an acceptable range' needs to be re-derived with the correct path-length distribution or with a Monte Carlo that tracks internal decays.
- [Sec. 8 and Sec. 7] The final viability statement is supported only by a multi-step extrapolation from the measured samples to an unmeasured target: the proposed 50 nm crystalline 229Th-doped film was not fabricated or tested; the frustrated-TIR acceptance recovery at 50 nm (about 7%) is estimated, not measured; and the downward scaling of the 200–300 nm amorphous-film backgrounds assumes strict proportionality to film volume and area, with negligible luminescence from the intermediate coating layers beneath ThF4. Since the margins after scaling are small (e.g., the rescaled 0.2 Hz internal radio-luminescence versus the 0.1 Hz budget), these assumptions are load-bearing. At minimum, the conclusions should be reworded as an indicative estimate, and a measurement on a 50 nm film—ideally with 229Th doping—should be listed as required validation.
minor comments (5)
- [Figs. 10 and 11] The caption of Fig. 11 describes the fitted curve as having a maximum amplitude of 0.23 Hz, but Sec. 4.1 states that the ThF4+Si sample peaks at about 0.35 Hz; the caption appears to be copied from Fig. 10 and should be corrected.
- [Secs. 4.1 and 4.2] The notation '0.23 Hz/0.69' and '1.4 kHz ×0.70/0.70' is unclear; presumably these are rates corrected by a 69–70% signal-selection efficiency, but the efficiency correction should be written explicitly rather than as a slash or ratio.
- [Sec. 2.1] The statement that the fraction of photo-diode current above 200 nm was 'estimated to be 55%, which is significantly higher than the observed 33%' is confusing: if 55% of the current is above 200 nm, one would expect more than 33% in air; please clarify what accounts for the shortfall.
- [Sec. 5] The sentence 'we used scintillation parameters adapted to the measurement results' is vague; since the light yield is derived from the measured rate and the simulated acceptance, please clarify that this is not a fit that could create a circular determination.
- [Sec. 8] Minor wording issue: 'the using of a small and thin ThF4 film' should read 'the use of a small and thin ThF4 film'.
Circularity Check
No circularity: measured background rates are independent benchmarks and the signal projection is built from external literature values.
full rationale
The central projection does not fit the target to the measured backgrounds. The photo- and radio-luminescence rates in Secs. 4 and 6 are direct experimental benchmarks, and the expected 229mTh signal in Sec. 7 is computed from the measured VUV lamp flux, the literature resonance width n3 dependence [26], and the refractive index [14], with no measured background rate entering the signal formula. The Sec. 8 rescaling of the measured 0.7 Hz UV radio-luminescence to an internal 1 kBq, 50 nm film is a volume/path-length scaling of an external-source measurement, not a fit to a predicted quantity. The phrase in Sec. 5 that scintillation parameters were 'adapted to the measurement results' is loose, but the acceptance simulations are geometric, and the final background projection is based on the measured rates rather than on simulated scintillation yields. The questionable 'cross only half of it' mean-path assumption and the apparent arithmetic discrepancy in Eq. 7 (1.1 Hz vs about 6.5 Hz for n = 1.826) are correctness or consistency concerns, not circularity: they change quantitative conclusions but do not reduce the derivation to its own inputs.
Assumptions & free parameters
free parameters (2)
- Geant4 scintillation light yield =
0.5 photons/keV
- Alpha-to-film hit fraction =
0.264
assumptions (5)
- domain assumption Internal conversion of 229mTh is completely suppressed in ThF4 (B_gamma = 1)
- domain assumption Radiative width scales as Gamma_gamma = n^3 times 3e-19 eV
- ad hoc to paper Backgrounds scale linearly with film volume and area
- domain assumption Amorphous commercial ThF4 films represent crystalline ThF4 for luminescence
- ad hoc to paper Substrate coating layers contribute negligible luminescence
Cite this review
Pith. "Pith review of Measurement of photo- and radio-luminescence of thin ThF4 films." pith.science (2026). https://pith.science/paper/JV2FW5DF
@misc{pith2026250711585,
  author       = {Pith},
  title        = {Pith review of: Measurement of photo- and radio-luminescence of thin ThF4 films},
  year         = {2026},
  howpublished = {\url{https://pith.science/paper/JV2FW5DF}},
  note         = {Machine review of arXiv:2507.11585}
}
abstract
We conducted measurements on the photo- and radio-luminescence of thin ThF$_4$ films in both the UV and visible ranges. In the UV range, we found that both luminescences are at a similar level as the internal dark counting noise of the photo-multiplier-tube (PMT). Our results suggest that thin ThF$_4$ crystals could be used as a target for the search for $^{229m}$Th and as a medium for the future nuclear clock. The measurements indicate that using a small and thin ThF$_4$ film can reduce background noise while maintaining the signal at the same level, achieved by increasing the $^{229}$Th enrichment. Our developed apparatus is now ready for direct measurements of $^{229m}$Th excitation and decay in ThF$_4$.
Figures


Figures from the paper (16 more)


Reference graph
Works this paper leans on
-
[1]
Seiferle, et al., Energy of the 229Th nuclear clock transition, N ature 573 (2019) 243
B. Seiferle, et al., Energy of the 229Th nuclear clock transition, N ature 573 (2019) 243
work page 2019
-
[2]
E. Tkalya, et al., Processes of the nuclear isomer 229mTh(3/2+, 3.5 +- 1.0 eV) resonant excitation by optical photons, Phys. Scr. 53 (1996 ) 296
work page 1996
-
[3]
E. Peik, C. Tamm, Nuclear laser spectroscopy of the 3.5 eV trans ition in Th-229, Europhys. Lett. 61 (2003) 181
work page 2003
-
[4]
L. von der Wense, et al., Direct detection of the 229Th nuclear clo ck tran- sition, Nature 533 (2016) 47
work page 2016
-
[5]
Seiferle, et al., Lifetime Measurement of the 229Th Nuclear Iso mer, Phys
B. Seiferle, et al., Lifetime Measurement of the 229Th Nuclear Iso mer, Phys. Rev. Lett. 118 (2017) 042501
work page 2017
-
[6]
E. Tkalya, Spontaneous Emission Probability for M1 Transition in a D ielec- tric Medium: 229mTh(3/2+, 3.5 +- 1.0 eV) Decay, JETP Lett. 71 (200 0) 311. 28
-
[7]
E. Tkalya, Decay of the low-energy nuclear isomer 229mTh(3/2+ , 3.5 +- 1.0 eV) in solids (dielectrics and metals) A new scheme of experimental research, Phys. Rev. C 61 (2000) 064308
work page 2000
-
[8]
A. Yamaguchi, et al., Laser spectroscopy of triply charged 229T h isomer for a nuclear clock, Nature 629 (2024) 62
work page 2024
Show all 26 references
-
[9]
Tiedau, et al., Laser excitation of the Th-229 nucleus, Phys
J. Tiedau, et al., Laser excitation of the Th-229 nucleus, Phys. R ev. Lett. 132 (2024) 182501
2024
-
[10]
Kraemer, et al., Observation of the radiative decay of the 22 9Th nuclear clock isomer, Nature 617 (2023) 706
S. Kraemer, et al., Observation of the radiative decay of the 22 9Th nuclear clock isomer, Nature 617 (2023) 706
2023
-
[11]
Elwell, et al., Laser excitation of the 229th nuclear isomeric tra nsition in a solid-state host, arXiv:2404.12311 (2024)
R. Elwell, et al., Laser excitation of the 229th nuclear isomeric tra nsition in a solid-state host, arXiv:2404.12311 (2024). URL https://arxiv.org/abs/2404.12311
2024 arXiv
-
[12]
Tkalya, Proposal for a Nuclear Gamma-Ray Laser of Optical Range, Phys
E. Tkalya, Proposal for a Nuclear Gamma-Ray Laser of Optical Range, Phys. Rev. Lett. 106 (2011) 162501
2011
-
[13]
Gouder, et al., Measurements of the band gap of ThF 4 by electron spectroscopy techniques, Phys
T. Gouder, et al., Measurements of the band gap of ThF 4 by electron spectroscopy techniques, Phys. Rev. Research 1 (2019) 03300 5
2019
-
[14]
Heitmann, E
W. Heitmann, E. Ritter, Production and properties of vacuum e vaporated films of thorium fluoride, Appl. Opt. 7 (1968) 307
1968
-
[15]
K., L11798 datasheets (2022)
Hamamatsu Photonics K. K., L11798 datasheets (2022). URL https://www.hamamatsu.com/us/en/product/light-and-radiation-sources
2022
-
[16]
https://www.thorlabs.com/thorproduct.cfm?partnumber=SM05PD7A
Thorlabs, Inc., SM05PDA7A datasheets (2022). URL "https://www.thorlabs.com/thorproduct.cfm?partnumber=SM05PD7A"
2022
-
[17]
K., R6835 datasheets (2022)
Hamamatsu Photonics K. K., R6835 datasheets (2022). URL https://www.hamamatsu.com/us/en/product/optical-sensors/pmt
2022
-
[18]
Available online: (2022)
ORTEC. Available online: (2022). URL https://www.ortec-online.com/products/electronic-instruments/preamplifiers/113 29
2022
-
[19]
Available online: (2022)
CAEN SpA, firmware DPP-PHA. Available online: (2022). URL https://www.caen.it/products/dpp-pha/
2022
-
[20]
Available online: (2022)
CAEN SpA, Digitiser DT5730. Available online: (2022). URL https://www.caen.it/products/dt5730/
2022
-
[21]
Available online: (2022)
CAEN SpA, software COMPASS. Available online: (2022). URL https://www.caen.it/products/compass/
2022
-
[22]
URL https://ii-vi.com/wp-content/uploads/2020/03/IR-Optics-Series-web-n.pdf
II-VI Incorporated, Ir optics series (2022). URL https://ii-vi.com/wp-content/uploads/2020/03/IR-Optics-Series-web-n.pdf
2022
-
[23]
Watanabe, et al., Absorption coefficients of oxygen in the vac uum ul- traviolet., J
K. Watanabe, et al., Absorption coefficients of oxygen in the vac uum ul- traviolet., J. Chem. Phys. 21 (1953) 1026
1953
-
[24]
Agostinelli, et al., Geant4—a simulation toolkit, Nucl
S. Agostinelli, et al., Geant4—a simulation toolkit, Nucl. Instr. and Meth. 506 (2003) 250
2003
-
[25]
Groom, et al., Particle Data Group, Eur
D. Groom, et al., Particle Data Group, Eur. Phys. Jour. C15 (20 00) 1
-
[26]
A. M. Dykhne, E. Tkalya, Matrix element of the anomalously low-e nergy (3.5±0.5 eV) transition in 229Th and the isomer lifetime., J. Exp. Theor. Phys. Lett. 67 (1998) 251. 30
1998
Reviewed August 6, 2026 · model on record in the stance chip above.
Discussion (0). Continue with ORCID to comment.