REVIEW 3 major objections 6 minor 1 cited by
Testing the Breakdown of the Asteroseismic Scaling Relations in Luminous Red Giants
T0 review · 3 major / 6 minor · reviewed 2026-08-12 · deepseek-v4-flash
Pith's one-line read The paper argues that the breakdown of asteroseismic scaling relations in luminous red giants is driven mainly by the large-frequency-separation mapping to mean density, not by the frequency of maximum power scaling.
desk verdict A careful, genuinely new decomposition of the luminous-giant scaling breakdown, but the central Δν-vs-νmax ranking rests on small samples and a selection procedure that could bias the trend; the modeling negative result is the strongest part. read the letter →
The pith
A machine-rendered reading of the paper's core claim, the machinery that carries it, and where it could break.
The reading
What carries the argument
The argument runs through the single-parameter scaling relations, which let each observed asteroseismic quantity be tested separately against independent masses and radii. The $\nu_{\max}$-only relation is $$\frac{M_*}{M_\odot} = \frac{\nu_{\max}}{\nu_{\max,\odot}} \left(\frac{R_{\rm Gaia}}{R_\odot}\right)^2 \left(\frac{T_{\rm eff}}{T_{\rm eff,\odot}}\right)^{1/2},$$ and the $\Delta\nu$-only relation is $$\frac{M_*}{M_\odot} = \left(\frac{F_{\$\Delta$\nu}\,\$\Delta$\nu}{\$\Delta$\nu_\odot}\right)^2 \left(\frac{R_{\rm Gaia}}{R_\odot}\right)^3,$$ where $F_{\Delta\nu}$ is the correction factor mapping the observed large frequency separation to mean density through $(F_{\Delta\nu}\Delta\nu_{\rm obs})/\Delta\nu_\odot = ((M/M_\odot)/(R/R_\odot)^3)^{1/2}$. The benchmarks are the open clusters NGC 6819 and NGC 6791, with isochronal and eclipsing-binary masses, and the high-$\alpha$ sequence as a quasi-coeval population of median mass near $1.04\,M_\odot$. The paper also builds MESA stellar models and GYRE non-adiabatic synthetic frequency spectra to test how measuring $\Delta\nu$ from all modes versus an observationally accessible subset, with and without a metallicity-dependent mixing-length calibration, changes $F_{\Delta\nu}$ and therefore the inferred radius.
What would settle it
A luminosity-selected sample of luminous giants in additional open clusters, or with eclipsing-binary masses, comparing $\nu_{\max}$-only and $\Delta\nu$-only masses would settle the attribution: if the $\Delta\nu$-only masses no longer track the inflated seismic radii while the $\nu_{\max}$-only masses do, the breakdown would move to the $\nu_{\max}$ side.
Extended reading notes
Core claim
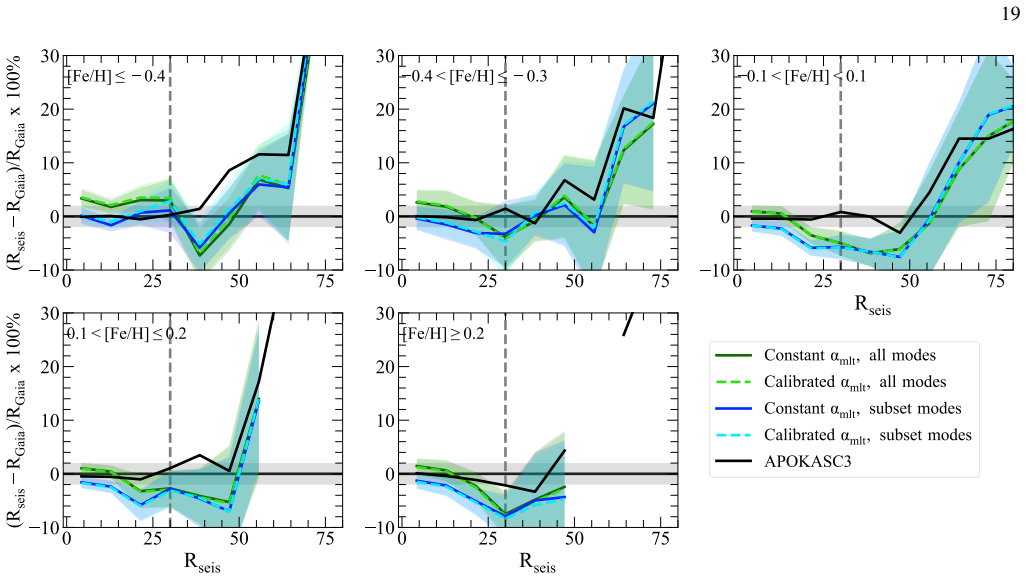
The central claim is that in luminous red giants, conventionally stars with seismic radii above about $30\,R_\odot$, the observed inflation of asteroseismic radii relative to Gaia parallactic radii originates primarily from the $\Delta\nu$-to-mean-density side of the joint scaling relations. The evidence comes from splitting the joint relations into a $\nu_{\max}$-only mass relation and a $\Delta\nu$-only mass relation, applied to open cluster stars and the high-$\alpha$ sequence used as a pseudo-cluster of known mean mass. The $\nu_{\max}$-only relation stays consistent with the high-$\alpha$ median mass across the giant branch, while the $\Delta\nu$-only relation runs over-massive in the 30 to 50 solar radius regime, mirroring the curvature of the joint scaling relations. The paper further claims that theoretical corrections to the $\Delta\nu$ mapping, through either mode selection or mixing-length calibration, alter inferred radii by only about 1 to 3 percent, which cannot account for the roughly 9 percent radius inflation, and that the $F_{\Delta\nu}$ correction is insensitive to the adopted mixing length calibrated to observed effective temperatures.
Load-bearing premise
The high-$\alpha$ sequence is treated as a pseudo-cluster with a single well-defined mass, median $1.04\,M_\odot$ for radii below $30\,R_\odot$, and a narrow age spread, and the 5-$\sigma$ mass cuts used to clean it are assumed not to bias the radius-dependent mass trend.
Editorial extensions
If this is right
- The $\nu_{\max}$-only scaling relation is a reliable mass and radius estimator on the lower giant branch, so surveys that rely on $\nu_{\max}$ alone can proceed with caution there, but they should be calibrated separately before being extended to luminous giants.
- The $\Delta\nu$-only relation is the part of the scaling relations that needs re-examination if the luminous-giant breakdown is to be fixed.
- Changing the way $\Delta\nu$ is measured in theoretical spectra, or calibrating mixing length to observed effective temperatures, will not by itself remove the discrepancy in luminous giant radii.
- Radius calibrations applied through a $F_{\nu_{\max}}$ term do not necessarily correct the mass scale, meaning that calibrated radii and calibrated masses are not interchangeable tests of the scaling relations.
- Future population studies using only one asteroseismic parameter in the luminous giant regime should carry an extra systematic uncertainty until the physical source of the $\Delta\nu$ failure is identified.
Reading between the lines
- If the $\Delta\nu$ attribution is correct, then surface-effect corrections applied to individual oscillation frequencies, which mainly act on the frequency pattern, would not be expected to cure the luminous-giant radius inflation either; the cause would more likely live in how luminous-giant structure maps onto the asymptotic relation.
- A direct extension would be to measure $F_{\Delta\nu}$ empirically for luminous giants using asteroseismic radii anchored to eclipsing binaries at large radius, which would test whether the correction factor is radius dependent rather than merely method dependent.
- The insensitivity of $F_{\Delta\nu}$ to mixing length suggests that the breakdown is not a convective-efficiency calibration problem, leaving non-adiabatic and atmospheric modeling, or missing physics such as magnetic fields or rotation, as the more promising explanations.
- The small number of luminous cluster giants, four in NGC 6819 and one in NGC 6791, means that a larger cluster sample or a dedicated high-$\alpha$ sample with independent radii could sharpen the claim that $\Delta\nu$ dominates over $\nu_{\max}$.
Signed reviews
Editorial analysis
A structured set of objections, weighed in public.
Referee Report
Summary. The paper tests the asteroseismic scaling relations for luminous red giants by separating the contributions of νmax and Δν. It uses parallactic radii from Gaia and independent masses from the open clusters NGC 6791 and NGC 6819 and from the Milky Way's high-α sequence as benchmarks. The authors derive single-parameter scaling relations for νmax and Δν and compare the resulting masses with the benchmarks as a function of radius. They find that the Δν-only relation shows larger, radius-dependent deviations than the νmax-only relation, and they interpret this as evidence that the Δν scaling relation is the main contributor to the previously reported breakdown of the joint scaling relations in luminous giants. They then compute model-based FΔν corrections using MESA+GYRE grids and test the effects of mixing-length calibration and of measuring Δν from all modes versus an observationally motivated subset of modes. These model changes alter the inferred radii by only about 1–3%, which is too small to explain the ≈9% inflated seismic radii. The paper concludes that the theoretical FΔν corrections, at least within the tested model treatments, cannot resolve the luminous-giant discrepancy.
Significance. If the central attribution is correct, the paper identifies the Δν-to-mean-density mapping as the weak link in the asteroseismic scaling relations for luminous giants, which would directly affect Galactic archaeology and planned single-parameter asteroseismic programs such as the Roman Galactic Bulge Time Domain Survey. The modeling null result is also useful: it shows that two plausible model treatments (mixing-length calibration and mode selection) do not resolve the discrepancy, narrowing the search space. The paper is commendably transparent about its limitations: it states that the metallicity-binned Δν deviations are not at 3σ significance and that the cluster luminous-giant sample is only four stars in NGC 6819 and one in NGC 6791. The data and MESA/GYRE inlists are publicly available, which is a strength. The main empirical claim is therefore suggestive but not yet secure; the selection effects in the high-α sample and the small cluster sample need to be quantitatively addressed before the attribution can be regarded as established.
major comments (3)
- [Sec. 2.4.4 and Sec. 3.2.2, Eqs. (6)-(7), Figs. 5-6] The high-α sample is cleaned with a 5σ mass cut applied to the APOKASC3 catalog mass and to the single-parameter scaling-relation masses computed from Eqs. (6) and (7). Because the subsequent analysis is precisely the radius-dependent behavior of those same single-parameter masses, this constitutes a selection on the outcome variable. At fixed radius the single-parameter masses scatter widely, and in the luminous regime the 2–3% inter-pipeline scatter in Δν (Sec. 4.3.2) enlarges that scatter. A one-sided upper cut removes the most over-massive stars in each bin; in the small-N tail above ≈50 R⊙, where the errors are largest, this can depress the rolling median and create the downturn from over-massive to under-massive stars that is interpreted as the Δν curvature. The Δν-only mass scales as R^3 while the νmax-only mass scales as R^2 (Eqs. 6 and 7), so the same cut can affect the two trends differently and artificially produce the relative offset between them. The paper does not quantify this selection effect. Please add a quantitative test—for example, apply the same mass-cut and rolling-median procedure to synthetic data with no true breakdown and show that the observed Δν-versus-νmax difference is not reproduced; if it is reproduced, the central attribution is not secure.
- [Sec. 3.2.2 and Sec. 3.2.1, Tables 3-4] The paper's internal significance statements are weaker than the abstract's claim. Section 3.2.2 states that the metallicity-binned Δν deviations are 'not at a 3σ level of significance,' and Section 3.2.1 reports only four luminous giants in NGC 6819 and one in NGC 6791. Despite this, the abstract asserts that 'the Δν-scaling relation contributes to the observed breakdown in luminous giants more than the νmax relation.' The cluster luminous-giant masses for the single-parameter relations are statistically consistent with the isochrone mass in both clusters (Tables 3 and 4, 'Luminous RGB' rows). Please either soften the abstract to match the stated significance (e.g., 'tentatively indicates' or 'we find suggestive evidence'), or add a combined statistical test across the high-α bins and the cluster stars that accounts for the selection effect raised in the first major comment. The current wording overstates the evidential weight of the analysis.
- [Sec. 2.4.4 and Sec. 3.2.2] The high-α 'pseudo-cluster' benchmark mass (median 1.04 M⊙ for R < 30 R⊙) is used as the seismic-independent reference, but its provenance is not explicitly stated. If this median mass is derived from APOKASC3 catalog masses, then it is not independent of the scaling relations being tested; a global zero-point error in the APOKASC3 calibration would be hidden, and only the radius-dependent trend would be meaningful. Please clarify how the benchmark mass is computed (isochrones, APOKASC3, or other) and test the sensitivity of the Figs. 5 and 6 trends to the assumed benchmark mass and to its possible variation with radius. This is important because the central attribution depends on the benchmark being a valid single-mass reference across the entire giant branch.
minor comments (6)
- [Sec. 2.4.2] The text says NGC 6791 has a turnoff age of '≈ 8 Myr'; this should read '≈ 8 Gyr' to be consistent with the adopted isochrone age of 8.3 ± 0.3 Gyr in Sec. 2.4.3.
- [Eq. (6) and Sec. 3, Fig. 4] Equation (6) shows the νmax-only mass without any Fνmax term, while the surrounding text and the middle panel of Fig. 4 indicate that a constant Fνmax is applied. Please clarify whether Eq. (6) should include Fνmax and, if so, where it enters; this affects the absolute mass scale, though not the radius-dependent curvature.
- [Figs. 5 and 6] The y-axis labels are rendered as 'max' instead of 'νmax'; the symbols are missing in several axis labels and captions throughout the paper (e.g., 'Rseis', 'Mhigh'). Please ensure the math mode renders correctly.
- [Table 1 caption] The caption contains the typo 'Asteroseiemic'; should be 'Asteroseismic'.
- [Sec. 5, bullet list] The bullet 'astreroseismic scaling relationships' contains a typo; should be 'asteroseismic'.
- [Sec. 3.2.2, KS test sentence] The sentence 'Using a Kolmogorov-Smirnov (KS) tests we confirm...' has a subject-verb agreement error; should be 'Using Kolmogorov-Smirnov (KS) tests, we confirm...'.
Circularity Check
No load-bearing circularity: the central claim is anchored to external Gaia and cluster benchmarks, with only minor self-referential inputs.
full rationale
The paper's central claim—that Δν contributes more than νmax to the luminous-giant breakdown—is tested against external benchmarks: Gaia parallactic radii (Sec. 2.3), cluster isochronal masses (Sec. 2.4.3), and the high-α sequence's independently motivated median mass (Sec. 2.4.4). The single-parameter masses in Eqs. 6 and 7 are therefore not defined in terms of the quantities they are used to predict; the comparison is not forced by construction. The FΔν modeling result is a null result: the paper demonstrates insensitivity to mixing length by computing sound-speed profiles and frequency spacings across αmlt = 1.4–2.3 (Figs. 13–14), so the conclusion does not depend on the αmlt calibration being correct. The main self-referential elements are the use of the APOKASC3 catalog (Pinsonneault et al. 2024, with overlapping authorship) and the calibration of the αmlt–[Fe/H] relation using APOKASC3 corrected seismic masses (Sec. 4.3.1). These are inputs, not load-bearing conclusions: APOKASC3 is tied to the fundamental scale, and the FΔν insensitivity result would survive a different calibration. The paper itself limits the strength of its attribution, noting the small number of luminous cluster stars (Sec. 3.2.1), that the Δν discrepancy 'is not at a 3σ level of significance' (Sec. 3.2.2), and that 'the robustness of this conclusion is limited by small sample size and large uncertainties' (Sec. 4). The 5σ mass cut applied to the single-parameter masses when selecting the high-α sample (Sec. 2.4.4) is a selection-on-outcome robustness concern that is not quantified, but it is not a stated identity or a fitted parameter renamed as a prediction; the observed rolling-median curvature is not logically forced by the cut. Overall, no load-bearing circular step was identified.
Assumptions & free parameters
free parameters (4)
- Constant Fnu_max values for RGB and RC =
0.9959 (RGB), 0.9937 (RC)
- Mixing length calibration relation =
alpha_mlt = 0.247 [Fe/H] + 1.869
- Convective overshoot parameters =
f = 0.0014 (text) or 0.014 (inlist); f0 = 0.004
- Gaussian envelope parameters for measuring Delta nu =
alpha = 0.66, beta = 0.88
assumptions (5)
- domain assumption The asteroseismic scaling relations Eqs. (1)-(5) hold with empirical correction factors Fnu_max and FDelta_nu.
- domain assumption The high-alpha sequence is an approximately coeval, single-mass pseudo-cluster with a well-defined median mass.
- domain assumption Gaia parallaxes, APOGEE temperatures, and 2MASS photometry yield unbiased seismic-independent radii when propagated through the Stefan-Boltzmann law.
- domain assumption Non-adiabatic GYRE frequencies computed from MESA models with a grey Eddington T-tau atmosphere adequately represent the radial mode spectrum of luminous red giants.
- domain assumption Surface effects on frequencies are absorbed into the empirical Fnu_max term rather than modelled separately.
Cite this review
Pith. "Pith review of Testing the Breakdown of the Asteroseismic Scaling Relations in Luminous Red Giants." pith.science (2026). https://pith.science/paper/K4H24EHW
@misc{pith2026241110520,
  author       = {Pith},
  title        = {Pith review of: Testing the Breakdown of the Asteroseismic Scaling Relations in Luminous Red Giants},
  year         = {2026},
  howpublished = {\url{https://pith.science/paper/K4H24EHW}},
  note         = {Machine review of arXiv:2411.10520}
}
abstract
Nearly all cool, evolved stars are solar-like oscillators, and fundamental stellar properties can be inferred from these oscillations with asteroseismology. Scaling relations are commonly used to relate global asteroseismic properties, the frequency of maximum power $\nu_{max}$ and the large frequency separation $\Delta \nu$, to stellar properties. Mass, radius, and age can then be inferred with the addition of stellar spectroscopy. There is excellent agreement between seismic radii and fundamental data on the lower red giant branch and red clump. However, the scaling relations appear to breakdown in luminous red giant stars. We attempt to constrain the contributions of the asteroseismic parameters to the observed breakdown. We test the $\nu_{max}$ and $\Delta \nu$ scaling relations separately, by using stars of known mass and radius in star clusters and the Milky Way's high-$\alpha$ sequence. We find evidence that the $\Delta \nu$-scaling relation contributes to the observed breakdown in luminous giants more than the $\nu_{max}$ relation. We test different methods of mapping the observed $\Delta \nu$ to the mean density via a correction factor, $F_{\Delta \nu}$ and find a $\approx 1 - 3\%$ difference in the radii in the luminous giant regime depending on the technique used to measure $F_{\Delta \nu}$. The differences between the radii inferred by these two techniques are too small on the luminous giant branch to account for the inflated seismic radii observed in evolved giant stars. Finally, we find that the $F_{\Delta \nu}$ correction is insensitive to the adopted mixing length, chosen by calibrating the models to observations of $T_{eff}$.
Figures


Figures from the paper (11 more)




Forward citations
Cited by 1 Pith paper
-
Detecting Solar-Like Oscillations in the Highest Mass TESS Giants
Custom-aperture TESS photometry detects solar-like oscillations in 43 intermediate-mass giants (10 above 5 M⊙) and shows APOGEE DR19 log g is ~0.23 dex too high versus seismic values.
Reference graph
Works this paper leans on
-
[1]
, " * write output.state after.block = add.period write newline
ENTRY address archivePrefix author booktitle chapter doi edition editor eprint howpublished institution journal key month number organization pages publisher school series title misctitle type volume year version url label extra.label sort.label short.list INTEGERS output.state before.all mid.sentence after.sentence after.block FUNCTION init.state.consts ...
-
[2]
write newline
" write newline "" before.all 'output.state := FUNCTION format.url url empty "" new.block "" url * "" * if FUNCTION format.eprint eprint empty "" archivePrefix empty "" archivePrefix "arXiv" = new.block " " eprint * " " * new.block " " eprint * " " * if if if FUNCTION format.doi doi empty "" " " doi * " " * if FUNCTION format.pid doi empty eprint empty ur...
-
[3]
thebibliography [1] 20pt to REFERENCES 6pt =0pt -12pt 10pt plus 3pt =0pt =0pt =1pt plus 1pt =0pt =0pt -12pt =13pt plus 1pt =20pt =13pt plus 1pt \@M =10000 =-1.0em =0pt =0pt 0pt =0pt =1.0em @enumiv\@empty 10000 10000 `\.\@m \@noitemerr \@latex@warning Empty `thebibliography' environment \@ifnextchar \@reference \@latexerr Missing key on reference command E...
arXiv 2021
-
[4]
2022, , 259, 35, 10.3847/1538-4365/ac4414
Abdurro'uf , Accetta , K., Aerts , C., et al. 2022, , 259, 35, 10.3847/1538-4365/ac4414
-
[5]
Astropy Collaboration , Robitaille , T. P., Tollerud , E. J., et al. 2013, , 558, A33, 10.1051/0004-6361/201322068
-
[6]
Astropy Collaboration , Price-Whelan , A. M., Sip o cz , B. M., et al. 2018, , 156, 123, 10.3847/1538-3881/aabc4f
-
[7]
Astropy Collaboration , Price-Whelan , A. M., Lim , P. L., et al. 2022, , 935, 167, 10.3847/1538-4357/ac7c74
-
[8]
A., Medupe , T., Abedigamba , O
Balona , L. A., Medupe , T., Abedigamba , O. P., et al. 2013, , 430, 3472, 10.1093/mnras/stt148
Show all 94 references
-
[9]
2011, , 729, L10, 10.1088/2041-8205/729/1/L10
Basu , S., Grundahl , F., Stello , D., et al. 2011, , 729, L10, 10.1088/2041-8205/729/1/L10
2011 doi
-
[10]
J., Dupret , M
Belkacem , K., Goupil , M. J., Dupret , M. A., et al. 2011, , 530, A142, 10.1051/0004-6361/201116490
2011 doi
-
[11]
J., Koch , D., Basri , G., et al
Borucki , W. J., Koch , D., Basri , G., et al. 2010, Science, 327, 977, 10.1126/science.1185402
2010 doi
-
[12]
G., Palumbo , E
Bouma , L. G., Palumbo , E. K., & Hillenbrand , L. A. 2023, , 947, L3, 10.3847/2041-8213/acc589
2023 doi
-
[13]
N., Sandquist , E
Brewer , L. N., Sandquist , E. L., Mathieu , R. D., et al. 2016, , 151, 66, 10.3847/0004-6256/151/3/66
2016 doi
-
[14]
2011, , 525, A2, 10.1051/0004-6361/201015503
Brogaard , K., Bruntt , H., Grundahl , F., et al. 2011, , 525, A2, 10.1051/0004-6361/201015503
2011 doi
-
[15]
L., et al
Brogaard , K., Grundahl , F., Sandquist , E. L., et al. 2021, , 649, A178, 10.1051/0004-6361/202140911
2021 doi
-
[16]
Brown , T. M. 1991, , 371, 396, 10.1086/169900
1991 doi
-
[17]
S., et al
Chiappini , C., Anders , F., Rodrigues , T. S., et al. 2015, , 576, L12, 10.1051/0004-6361/201525865
2015 doi
-
[18]
2016, , 823, 102, 10.3847/0004-637X/823/2/102
Choi , J., Dotter , A., Conroy , C., et al. 2016, , 823, 102, 10.3847/0004-637X/823/2/102
2016 doi
-
[19]
1991, in Solar Interior and Atmosphere, 401--478
Christensen-Dalsgaard , J., & Berthomieu , G. 1991, in Solar Interior and Atmosphere, 401--478
1991
-
[20]
2012, , 757, 190, 10.1088/0004-637X/757/2/190
Corsaro , E., Stello , D., Huber , D., et al. 2012, , 757, 190, 10.1088/0004-637X/757/2/190
2012 doi
-
[21]
P., & Giuli , R
Cox , J. P., & Giuli , R. T. 1968, Principles of stellar structure
1968
-
[22]
2016, , 222, 8, 10.3847/0067-0049/222/1/8
Dotter , A. 2016, , 222, 8, 10.3847/0067-0049/222/1/8
2016 doi
-
[23]
A., Paterno , L., & Ventura , R
Dziembowski , W. A., Paterno , L., & Ventura , R. 1988, , 200, 213
1988
-
[24]
W., Alexander , D
Ferguson , J. W., Alexander , D. R., Allard , F., et al. 2005, , 623, 585, 10.1086/428642
2005 doi
-
[25]
Gaia Collaboration , Vallenari , A., Brown , A. G. A., et al. 2023, , 674, A1, 10.1051/0004-6361/202243940
2023 doi
-
[26]
2020, , 365, 24, 10.1007/s10509-020-3738-2
Gao , X. 2020, , 365, 24, 10.1007/s10509-020-3738-2
2020 doi
-
[27]
E., Allende Prieto , C., Holtzman , J
Garc \' a P \'e rez , A. E., Allende Prieto , C., Holtzman , J. A., et al. 2016, , 151, 144, 10.3847/0004-6256/151/6/144
2016 doi
-
[28]
2016 a , , 832, 121, 10.3847/0004-637X/832/2/121
Gaulme , P., McKeever , J., Jackiewicz , J., et al. 2016 a , , 832, 121, 10.3847/0004-637X/832/2/121
2016 doi
-
[29]
F., Bedding , T
Gaulme , P., Rowe , J. F., Bedding , T. R., et al. 2016 b , , 833, L13, 10.3847/2041-8213/833/1/L13
2016 doi
-
[30]
I., & Bonifacio , P
Gonz \'a lez Hern \'a ndez , J. I., & Bonifacio , P. 2009, , 497, 497, 10.1051/0004-6361/200810904
2009 doi
-
[31]
2015, Journal of Korean Astronomical Society, 48, 93, 10.5303/JKAS.2015.48.2.93
Gould , A., Huber , D., Penny , M., & Stello , D. 2015, Journal of Korean Astronomical Society, 48, 93, 10.5303/JKAS.2015.48.2.93
2015 doi
-
[32]
Grevesse , N., & Sauval , A. J. 1998, , 85, 161, 10.1023/A:1005161325181
1998 doi
-
[33]
2017, , 472, 979, 10.1093/mnras/stx1929
Handberg , R., Brogaard , K., Miglio , A., et al. 2017, , 472, 979, 10.1093/mnras/stx1929
2017 doi
-
[34]
R., Sharma , S., Bland-Hawthorn , J., et al
Hayden , M. R., Sharma , S., Bland-Hawthorn , J., et al. 2022, , 517, 5325, 10.1093/mnras/stac2787
2022 doi
-
[35]
2011, , 530, A100, 10.1051/0004-6361/201016303
Hekker , S., Basu , S., Stello , D., et al. 2011, , 530, A100, 10.1051/0004-6361/201016303
2011 doi
- [36]
-
[37]
R., Huber , D., Shappee , B
Hey , D. R., Huber , D., Shappee , B. J., et al. 2023, , 166, 249, 10.3847/1538-3881/ad01bf
2023 doi
-
[38]
S., Huber , D., Stello , D., & Reyes , C
Hon , M., Kuszlewicz , J. S., Huber , D., Stello , D., & Reyes , C. 2022, , 164, 135, 10.3847/1538-3881/ac8931
2022 doi
-
[39]
S., et al
Hon , M., Huber , D., Kuszlewicz , J. S., et al. 2021, , 919, 131, 10.3847/1538-4357/ac14b1
2021 doi
- [40]
-
[41]
R., Stello , D., et al
Huber , D., Bedding , T. R., Stello , D., et al. 2011, , 743, 143, 10.1088/0004-637X/743/2/143
2011 doi
-
[42]
J., Bedding , T
Huber , D., Ireland , M. J., Bedding , T. R., et al. 2012, , 760, 32, 10.1088/0004-637X/760/1/32
2012 doi
-
[43]
2017, , 844, 102, 10.3847/1538-4357/aa75ca
Huber , D., Zinn , J., Bojsen-Hansen , M., et al. 2017, , 844, 102, 10.3847/1538-4357/aa75ca
2017 doi
-
[44]
L., & Reffert , S
Hunt , E. L., & Reffert , S. 2023, , 673, A114, 10.1051/0004-6361/202346285
2023 doi
- [45]
-
[46]
2012, , 541, A64, 10.1051/0004-6361/201117347
J \' lkov \'a , L., Carraro , G., Jungwiert , B., & Minchev , I. 2012, , 541, A64, 10.1051/0004-6361/201117347
2012 doi
-
[47]
2018, , 856, 10, 10.3847/1538-4357/aab200
Joyce , M., & Chaboyer , B. 2018, , 856, 10, 10.3847/1538-4357/aab200
2018 doi
-
[48]
I., Marchetti , T., et al
Joyce , M., Johnson , C. I., Marchetti , T., et al. 2023, , 946, 28, 10.3847/1538-4357/acb692
2023 doi
-
[49]
2023, Galaxies, 11, 75, 10.3390/galaxies11030075
Joyce , M., & Tayar , J. 2023, Galaxies, 11, 75, 10.3390/galaxies11030075
2023 doi
-
[50]
Kjeldsen , H., & Bedding , T. R. 1995, , 293, 87. astro-ph/9403015
1995 arXiv
-
[51]
R., & Christensen-Dalsgaard , J
Kjeldsen , H., Bedding , T. R., & Christensen-Dalsgaard , J. 2008, , 683, L175
2008
-
[52]
B., Anthony-Twarog , B
Lee-Brown , D. B., Anthony-Twarog , B. J., Deliyannis , C. P., Rich , E., & Twarog , B. A. 2015, , 149, 121, 10.1088/0004-6256/149/4/121
2015 doi
-
[53]
R., Stello , D., et al
Li , Y., Bedding , T. R., Stello , D., et al. 2023, , 523, 916, 10.1093/mnras/stad1445
2023 doi
-
[54]
R., Schiavon , R
Majewski , S. R., Schiavon , R. P., Frinchaboy , P. M., et al. 2017, , 154, 94, 10.3847/1538-3881/aa784d
2017 doi
-
[55]
2016, , 456, 3655, 10.1093/mnras/stv2830
Martig , M., Fouesneau , M., Rix , H.-W., et al. 2016, , 456, 3655, 10.1093/mnras/stv2830
2016 doi
-
[56]
A., Platais , I., et al
Meibom , S., Barnes , S. A., Platais , I., et al. 2015, , 517, 589, 10.1038/nature14118
2015 doi
-
[57]
2012, , 419, 2077, 10.1111/j.1365-2966.2011.19859.x
Miglio , A., Brogaard , K., Stello , D., et al. 2012, , 419, 2077, 10.1111/j.1365-2966.2011.19859.x
2012
-
[58]
T., et al
Miglio , A., Chiappini , C., Mackereth , J. T., et al. 2021, , 645, A85, 10.1051/0004-6361/202038307
2021 doi
-
[59]
Monteiro , M. J. P. F. G., Christensen-Dalsgaard , J., & Thompson , M. J. 1996, , 307, 624
1996
-
[60]
2009, , 508, 877, 10.1051/0004-6361/200912944
Mosser , B., & Appourchaux , T. 2009, , 508, 877, 10.1051/0004-6361/200912944
2009 doi
-
[61]
J., et al
Mosser , B., Belkacem , K., Goupil , M. J., et al. 2011, , 525, L9, 10.1051/0004-6361/201015440
2011 doi
-
[62]
2012, , 537, A30, 10.1051/0004-6361/201117352
Mosser , B., Elsworth , Y., Hekker , S., et al. 2012, , 537, A30, 10.1051/0004-6361/201117352
2012 doi
-
[63]
A., Belkacem , K., et al
Mosser , B., Dziembowski , W. A., Belkacem , K., et al. 2013, , 559, A137, 10.1051/0004-6361/201322243
2013 doi
-
[64]
L., Holtzman , J
Nidever , D. L., Holtzman , J. A., Allende Prieto , C., et al. 2015, , 150, 173, 10.1088/0004-6256/150/6/173
2015 doi
-
[65]
2011, , 192, 3, 10.1088/0067-0049/192/1/3
Paxton , B., Bildsten , L., Dotter , A., et al. 2011, , 192, 3, 10.1088/0067-0049/192/1/3
2011 doi
-
[66]
2013, , 208, 4, 10.1088/0067-0049/208/1/4
Paxton , B., Cantiello , M., Arras , P., et al. 2013, , 208, 4, 10.1088/0067-0049/208/1/4
2013 doi
-
[67]
2015, , 220, 15, 10.1088/0067-0049/220/1/15
Paxton , B., Marchant , P., Schwab , J., et al. 2015, , 220, 15, 10.1088/0067-0049/220/1/15
2015 doi
-
[68]
B., et al
Paxton , B., Schwab , J., Bauer , E. B., et al. 2018, , 234, 34, 10.3847/1538-4365/aaa5a8
2018 doi
-
[69]
2019, , 243, 10, 10.3847/1538-4365/ab2241
Paxton , B., Smolec , R., Schwab , J., et al. 2019, , 243, 10, 10.3847/1538-4365/ab2241
2019 doi
-
[70]
H., Elsworth , Y., Epstein , C., et al
Pinsonneault , M. H., Elsworth , Y., Epstein , C., et al. 2014, , 215, 19, 10.1088/0067-0049/215/2/19
2014 doi
-
[71]
H., Elsworth , Y
Pinsonneault , M. H., Elsworth , Y. P., Tayar , J., et al. 2018, , 239, 32, 10.3847/1538-4365/aaebfd
2018 doi
-
[72]
H., Zinn , J
Pinsonneault , M. H., Zinn , J. C., Tayar , J., et al. 2024, arXiv e-prints, arXiv:2410.00102, 10.48550/arXiv.2410.00102
2024 doi
-
[73]
D., Pinsonneault , M
Roberts , J. D., Pinsonneault , M. H., Johnson , J. A., et al. 2024, , 530, 149, 10.1093/mnras/stae820
2024 doi
-
[74]
1993, , 414, 580, 10.1086/173105
Salaris , M., Chieffi , A., & Straniero , O. 1993, , 414, 580, 10.1086/173105
1993 doi
-
[75]
Sharma , S., Stello , D., Bland-Hawthorn , J., Huber , D., & Bedding , T. R. 2016, , 822, 15, 10.3847/0004-637X/822/1/15
2016 doi
-
[76]
2012, , 757, 99, 10.1088/0004-637X/757/1/99
Silva Aguirre , V., Casagrande , L., Basu , S., et al. 2012, , 757, 99, 10.1088/0004-637X/757/1/99
2012 doi
-
[77]
2018, , 475, 5487, 10.1093/mnras/sty150
Silva Aguirre , V., Bojsen-Hansen , M., Slumstrup , D., et al. 2018, , 475, 5487, 10.1093/mnras/sty150
2018 doi
-
[78]
X., Huang , Y., Wang , H
Sun , W. X., Huang , Y., Wang , H. F., et al. 2020, , 903, 12, 10.3847/1538-4357/abb1b7
2020 doi
-
[79]
V., et al
Szigeti , L., M \'e sz \'a ros , S., Smith , V. V., et al. 2018, , 474, 4810, 10.1093/mnras/stx3027
2018 doi
- [80]
-
[81]
H., et al
Tayar , J., Somers , G., Pinsonneault , M. H., et al. 2017, , 840, 17, 10.3847/1538-4357/aa6a1e
2017 doi
-
[82]
Townsend , R. H. D., & Teitler , S. A. 2013, , 435, 3406, 10.1093/mnras/stt1533
2013 doi
-
[83]
R., Mowlavi , N., et al
Trabucchi , M., Wood , P. R., Mowlavi , N., et al. 2021, , 500, 1575, 10.1093/mnras/staa3356
2021 doi
-
[84]
2018, , 867, 34, 10.3847/1538-4357/aae4e5
Villanova , S., Carraro , G., Geisler , D., Monaco , L., & Assmann , P. 2018, , 867, 34, 10.3847/1538-4357/aae4e5
2018 doi
- [85]
-
[86]
R., Bedding , T
White , T. R., Bedding , T. R., Stello , D., et al. 2011 a , , 743, 161, 10.1088/0004-637X/743/2/161
2011 doi
-
[87]
2011 b , , 742, L3, 10.1088/2041-8205/742/1/L3
---. 2011 b , , 742, L3, 10.1088/2041-8205/742/1/L3
2011 doi
-
[88]
C., Hearty , F
Wilson , J. C., Hearty , F. R., Skrutskie , M. F., et al. 2019, , 131, 055001, 10.1088/1538-3873/ab0075
2019 doi
-
[89]
R., et al
Yu , J., Huber , D., Bedding , T. R., et al. 2018, , 236, 42, 10.3847/1538-4365/aaaf74
2018 doi
-
[90]
E., Chojnowski , S
Zasowski , G., Cohen , R. E., Chojnowski , S. D., et al. 2017, , 154, 198, 10.3847/1538-3881/aa8df9
2017 doi
-
[91]
2021, , 922, 145, 10.3847/1538-4357/ac22a5
Zhang , M., Xiang , M., Zhang , H.-W., et al. 2021, , 922, 145, 10.3847/1538-4357/ac22a5
2021 doi
-
[92]
C., Pinsonneault , M
Zinn , J. C., Pinsonneault , M. H., Bildsten , L., & Stello , D. 2023, , 525, 5540, 10.1093/mnras/stad2560
2023 doi
-
[93]
C., Pinsonneault , M
Zinn , J. C., Pinsonneault , M. H., Huber , D., & Stello , D. 2019 a , , 878, 136, 10.3847/1538-4357/ab1f66
2019 doi
-
[94]
C., Pinsonneault , M
Zinn , J. C., Pinsonneault , M. H., Huber , D., et al. 2019 b , , 885, 166, 10.3847/1538-4357/ab44a9
2019 doi
Reviewed August 12, 2026 · model on record in the stance chip above.
Discussion (0). Continue with ORCID to comment.