Cluster vs Field: Clear Evidence for a Morphology-Density Relation in All Environments at zsim1.6
Pith reviewed 2026-06-26 01:39 UTC · model grok-4.3
The pith
A morphology-density relation already exists for galaxies in both clusters and the field at redshift 1.6.
A machine-rendered reading of the paper's core claim, the machinery that carries it, and where it could break.
Core claim
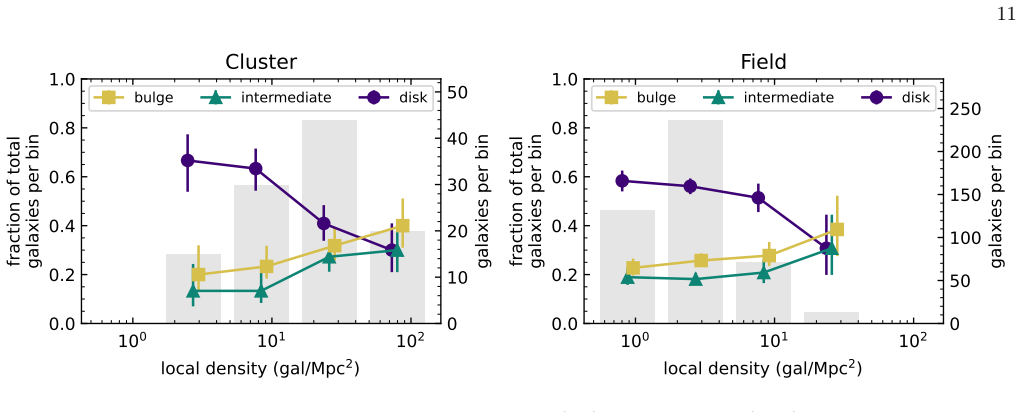
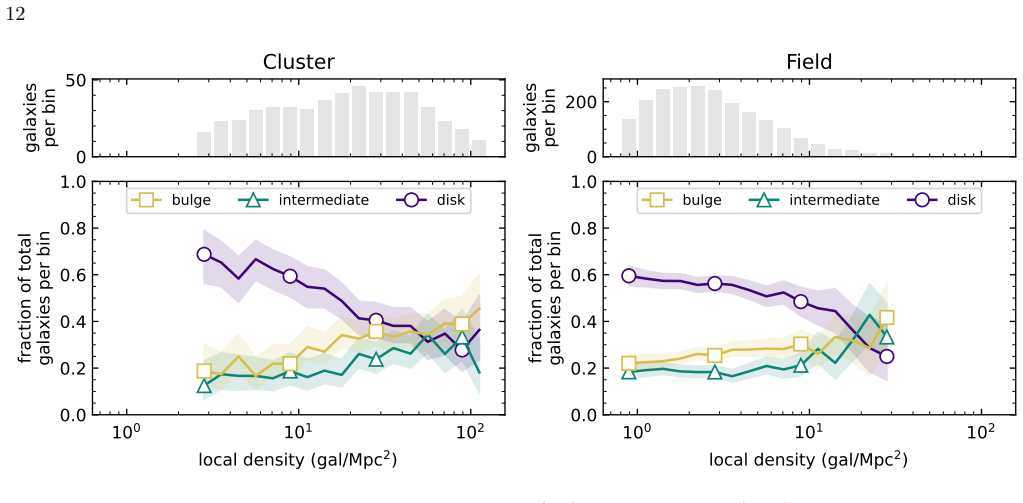
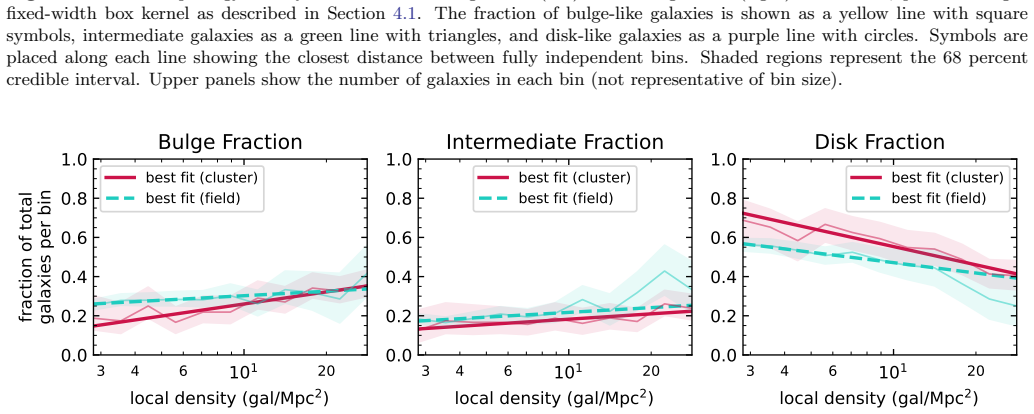
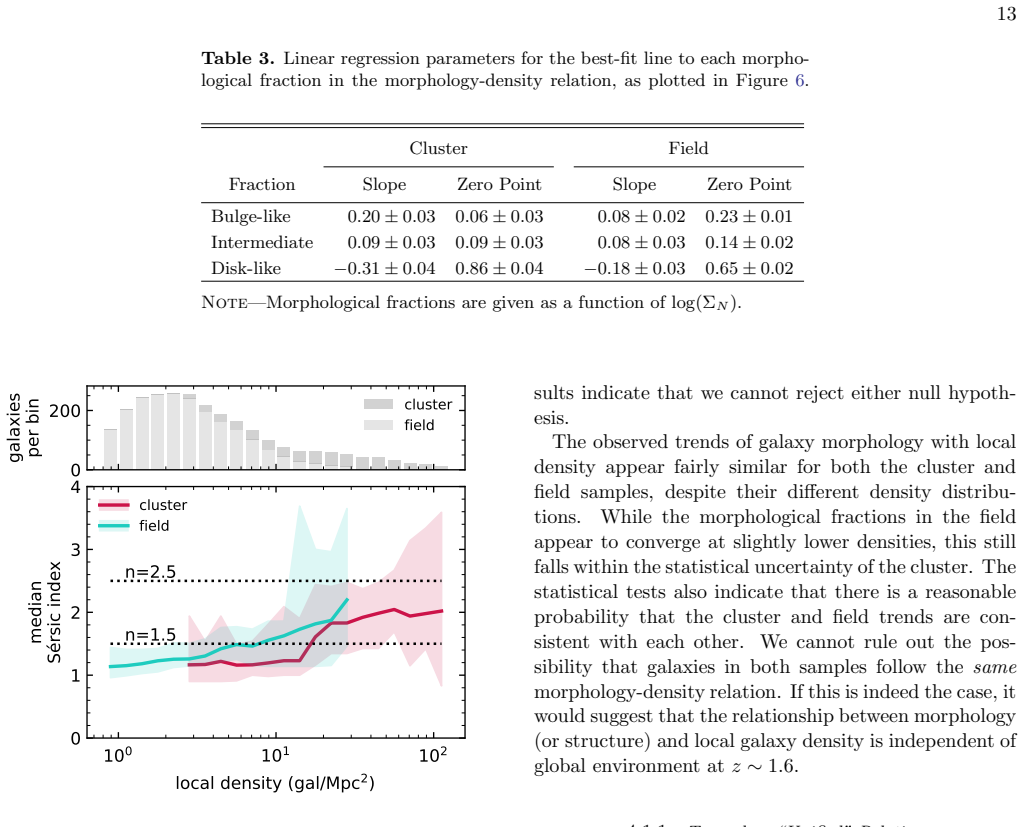
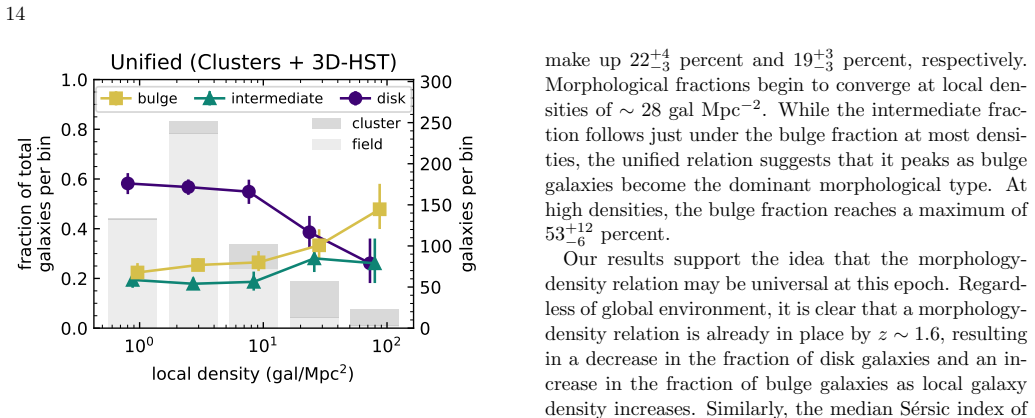
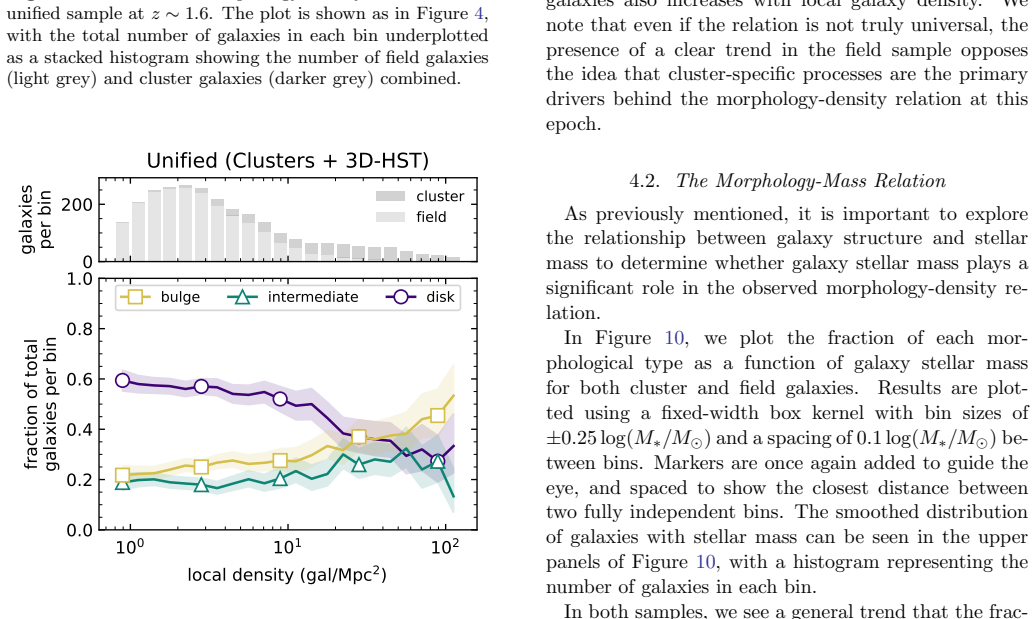
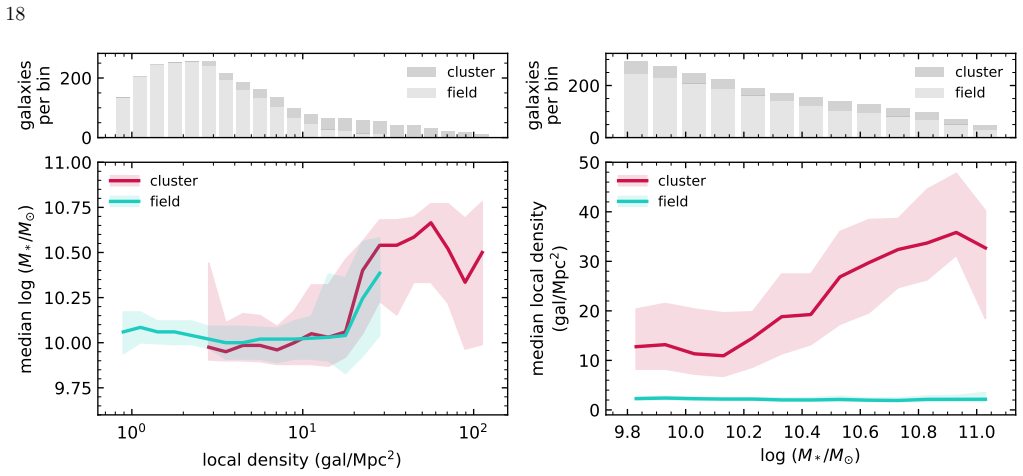
In both the SpARCS cluster sample and the 3D-HST field sample at z∼1.6, the fraction of bulge-like galaxies increases and the fraction of disk-like galaxies decreases with rising local density. Median Sersic index shows a similar positive trend with density in both samples. The data indicate that the morphology-density relation is already established at this epoch and appears independent of whether galaxies sit in a cluster or the field.
What carries the argument
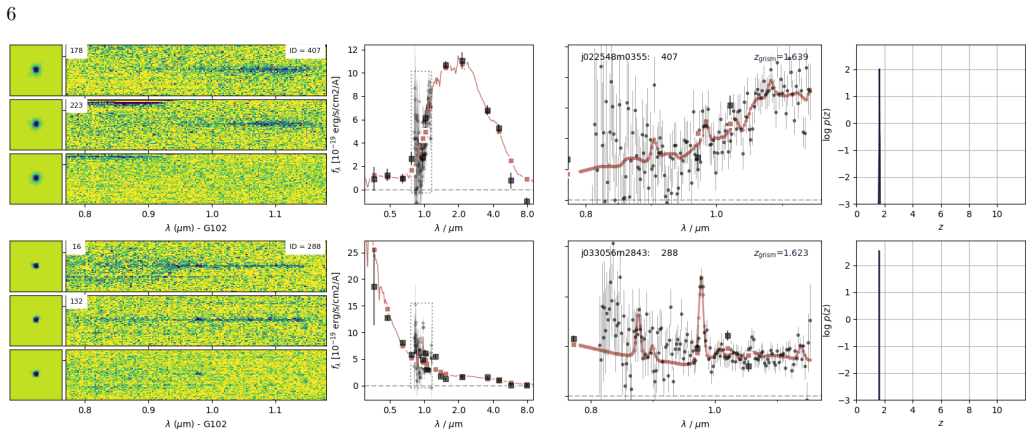
Sersic index measured in rest-frame R-band from F160W imaging, used to classify galaxies as disk-like, bulge-like or intermediate and to track how structure changes with local density from slit and grism spectroscopy.
Load-bearing premise
Local density measurements from slit and grism spectroscopy are comparably accurate and free of selection bias in the cluster and field samples.
What would settle it
A larger field sample at the same redshift showing no rise in median Sersic index with local density would falsify the claim that the morphology-density relation operates independently of global environment.
Figures
read the original abstract
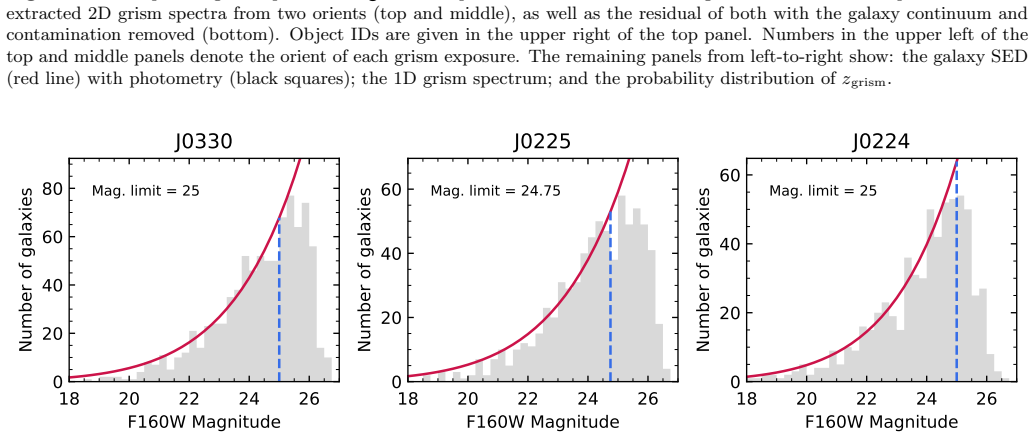
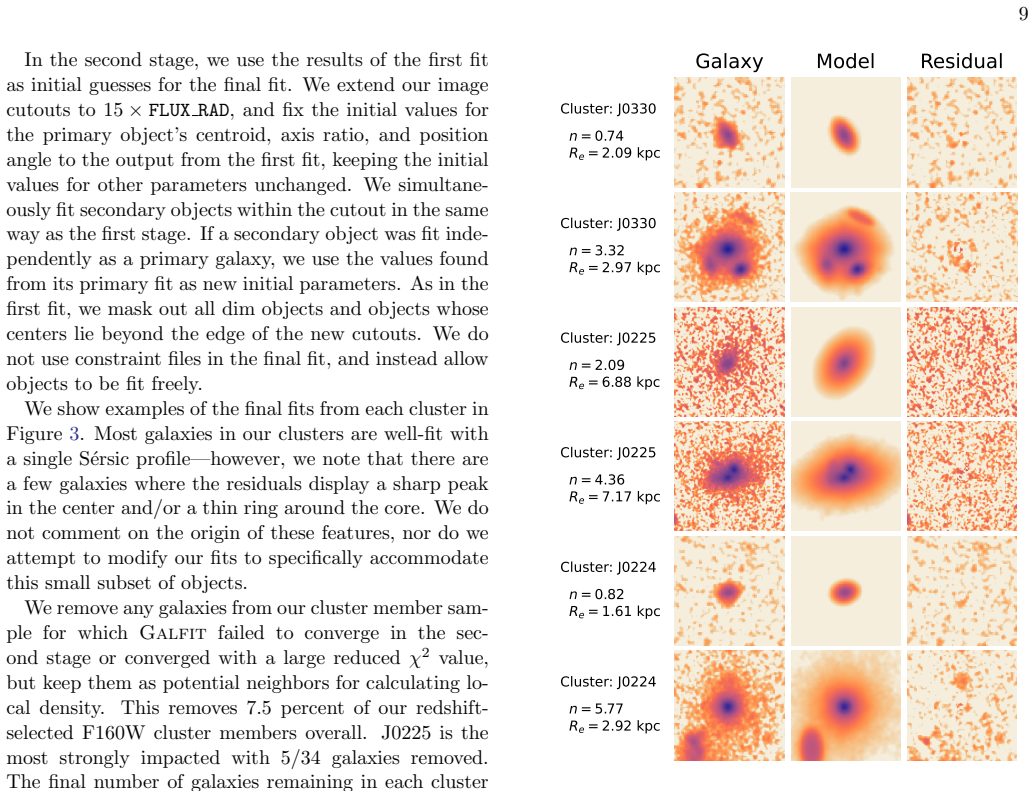
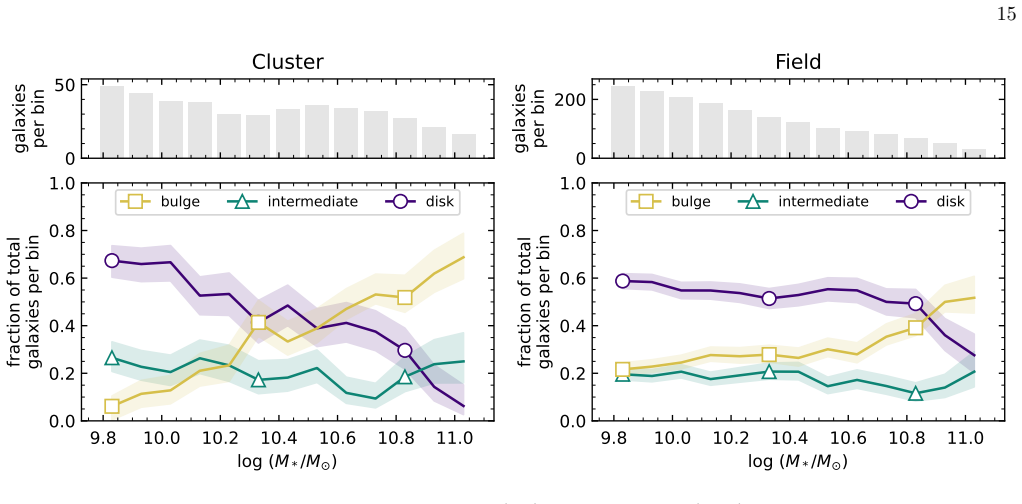
We explore the relationship between galaxy structure, stellar mass, and local galaxy density in three SpARCS clusters at $z\sim1.6$ and compare with field galaxies from the 3D-HST survey. Our cluster and field data include: 1) unprecedented multiband photometry, allowing for accurate stellar mass estimates; 2) extensive slit and grism spectroscopy targeting both star-forming and quiescent galaxies, allowing for high-accuracy local density measurements; and 3) deep imaging in F160W, allowing for accurate rest-frame optical morphologies. Using S\'ersic index measured in rest-frame R-band, we classify galaxies as disk-like, bulge-like, and intermediate. Our sample includes 111 cluster galaxies and 458 field galaxies with reliable S\'ersic measurements. We find that a morphology-density relation is already in-place in both cluster and field galaxies at $z\sim1.6$, such that as local density increases, the fraction of bulge-like galaxies increases and disk-like galaxies decreases. Both samples show similar positive trends between median S\'ersic index and local density. Additionally, we find a general positive relationship between S\'ersic index and stellar mass. The majority of galaxies remain disk-like until reaching stellar masses above $10^{10.25} M_\odot$ in the cluster or $10^{10.8} M_\odot$ in the field, however, we cannot conclude whether the differences in stellar mass trends are significant. Overall, our results show clear morphology-density and morphology-mass relations in place at $z\sim1.6$ and oppose the idea that cluster-specific processes are solely responsible the morphology-density relation. Our data further suggest that the morphology-density relation may be independent of global environment at this epoch.
Editorial analysis
A structured set of objections, weighed in public.
Referee Report
Summary. The manuscript claims that a morphology-density relation is already in place at z∼1.6 in both SpARCS cluster and 3D-HST field galaxies, with the fraction of bulge-like galaxies (high Sérsic index) increasing and disk-like galaxies decreasing as local density increases; similar positive trends between median Sérsic index and local density in both samples suggest the relation may be independent of global environment. The analysis uses 111 cluster and 458 field galaxies with reliable Sérsic measurements from F160W imaging, stellar masses from multiband photometry, and local densities from slit/grism spectroscopy.
Significance. If the local density estimates prove comparable, the result would indicate that the morphology-density relation is established by z∼1.6 across environments and is not driven solely by cluster-specific processes. The consistent use of rest-frame optical morphologies and stellar mass estimates across samples is a methodological strength supporting the observational comparison.
major comments (2)
- [Methods (local density estimation)] § on local density measurements (Methods): The claim that the morphology-density relation is independent of global environment requires the local density metric to be comparably accurate and free of differential bias between the SpARCS slit-spectroscopy sample and the 3D-HST grism-spectroscopy sample. The manuscript provides no explicit tests (e.g., mock catalogs or cross-method comparisons) showing that the chosen estimator (projected nearest-neighbor or fixed-aperture surface density) yields consistent results given the differing redshift precision, line-of-sight contamination, and selection completeness of the two spectroscopic techniques.
- [Results (morphology-density trends)] Results (trends and figures): The reported similarity in Sérsic-index vs. density trends between cluster and field is presented without error bars on the binned medians or fractions, without sample completeness corrections as a function of density, and without robustness checks against alternative density definitions. These omissions make it impossible to evaluate whether the observed trends are statistically significant or could arise from measurement systematics.
minor comments (1)
- [Abstract] Abstract: The stellar-mass thresholds at which galaxies remain disk-like (10^{10.25} M_⊙ in clusters vs. 10^{10.8} M_⊙ in the field) are stated without any assessment of whether the difference is significant given the respective sample sizes and mass distributions.
Simulated Author's Rebuttal
We thank the referee for their constructive comments, which highlight important aspects of our analysis that require clarification and strengthening. We address each major comment below and will incorporate the suggested improvements in a revised manuscript.
read point-by-point responses
-
Referee: [Methods (local density estimation)] § on local density measurements (Methods): The claim that the morphology-density relation is independent of global environment requires the local density metric to be comparably accurate and free of differential bias between the SpARCS slit-spectroscopy sample and the 3D-HST grism-spectroscopy sample. The manuscript provides no explicit tests (e.g., mock catalogs or cross-method comparisons) showing that the chosen estimator (projected nearest-neighbor or fixed-aperture surface density) yields consistent results given the differing redshift precision, line-of-sight contamination, and selection completeness of the two spectroscopic techniques.
Authors: We agree that explicit validation is needed to support the claim of independence from global environment. In the revised manuscript we will add a dedicated subsection (or appendix) presenting mock-catalog tests that incorporate the measured redshift precision, line-of-sight contamination rates, and selection completeness of both the slit and grism samples. These tests will quantify any differential bias in the adopted nearest-neighbor density estimator and demonstrate that the metric remains comparable across the two datasets. revision: yes
-
Referee: [Results (morphology-density trends)] Results (trends and figures): The reported similarity in Sérsic-index vs. density trends between cluster and field is presented without error bars on the binned medians or fractions, without sample completeness corrections as a function of density, and without robustness checks against alternative density definitions. These omissions make it impossible to evaluate whether the observed trends are statistically significant or could arise from measurement systematics.
Authors: We accept that the current presentation lacks these elements. In the revision we will (i) add bootstrap-derived error bars to all binned medians and fractions in the relevant figures, (ii) include a quantitative assessment of sample completeness versus local density for both the cluster and field samples, and (iii) perform and report robustness checks using an alternative fixed-aperture surface-density estimator. These additions will allow a direct evaluation of statistical significance and potential systematics. revision: yes
Circularity Check
No circularity: purely observational comparison of measured quantities
full rationale
The paper reports direct observational trends between measured Sersic index (morphology) and local density (from spectroscopy) in two independent samples. No equations, fitted parameters, or derivations are presented that reduce the reported morphology-density relation to inputs by construction. No self-citation chains, uniqueness theorems, or ansatzes are invoked as load-bearing steps. The central claim rests on empirical comparison of data points, which is self-contained against external benchmarks.
Axiom & Free-Parameter Ledger
axioms (2)
- domain assumption Sersic index measured in rest-frame R-band reliably classifies galaxies as disk-like or bulge-like
- domain assumption Local density estimates from spectroscopy are unbiased between cluster and field samples
Reference graph
Works this paper leans on
-
[1]
G., van den Bergh, S., & Nair, P
Abraham, R. G., van den Bergh, S., & Nair, P. 2003, ApJ, 588, 218, doi: 10.1086/373919
-
[2]
Ahad, S. L., Muzzin, A., Bah´ e, Y. M., & Hoekstra, H. 2024, MNRAS, 528, 6329, doi: 10.1093/mnras/stae341
-
[3]
Balogh, M. L., Navarro, J. F., & Morris, S. L. 2000, ApJ, 540, 113, doi: 10.1086/309323
-
[4]
Bamford, S. P., Nichol, R. C., Baldry, I. K., et al. 2009, MNRAS, 393, 1324, doi: 10.1111/j.1365-2966.2008.14252.x
-
[5]
Bassett, R., Papovich, C., Lotz, J. M., et al. 2013, ApJ, 770, 58, doi: 10.1088/0004-637X/770/1/58
-
[6]
Bekki, K., & Couch, W. J. 2011, MNRAS, 415, 1783, doi: 10.1111/j.1365-2966.2011.18821.x
-
[7]
F., van der Wel , A., Papovich , C., et al
Bell, E. F., van der Wel, A., Papovich, C., et al. 2012, ApJ, 753, 167, doi: 10.1088/0004-637X/753/2/167
-
[8]
Bertin, E., & Arnouts, S. 1996, A&AS, 117, 393, doi: 10.1051/aas:1996164
-
[9]
Bluck, A. F. L., Bottrell, C., Teimoorinia, H., et al. 2019, MNRAS, 485, 666, doi: 10.1093/mnras/stz363
-
[10]
doi:10.5281/zenodo.8370018 , version =
Brammer, G. 2023, grizli, 1.9.11, Zenodo, doi: 10.5281/zenodo.8370018 22
-
[11]
EAZY: A Fast, Public Photometric Redshift Code
Brammer, G. B., van Dokkum, P. G., & Coppi, P. 2008, ApJ, 686, 1503, doi: 10.1086/591786
work page internal anchor Pith review doi:10.1086/591786 2008
-
[12]
, archivePrefix = "arXiv", eprint =
Brammer, G. B., van Dokkum, P. G., Franx, M., et al. 2012, ApJS, 200, 13, doi: 10.1088/0067-0049/200/2/13
-
[13]
Brinchmann, J., Charlot, S., White, S. D. M., et al. 2004, MNRAS, 351, 1151, doi: 10.1111/j.1365-2966.2004.07881.x
-
[14]
Buitrago, F., Trujillo, I., Conselice, C. J., & H¨ außler, B. 2013, MNRAS, 428, 1460, doi: 10.1093/mnras/sts124
-
[15]
Calvi, R., Poggianti, B. M., Fasano, G., & Vulcani, B. 2012, MNRAS, 419, L14, doi: 10.1111/j.1745-3933.2011.01168.x10.1086/122140
work page doi:10.1111/j.1745-3933.2011.01168.x10.1086/122140 2012
-
[16]
2007, ApJS, 172, 270, doi: 10.1086/516591
Cassata, P., Guzzo, L., Franceschini, A., et al. 2007, ApJS, 172, 270, doi: 10.1086/516591
-
[17]
2007, ApJ, 671, 1497, doi: 10.1086/521595
Castellano, M., Salimbeni, S., Trevese, D., et al. 2007, ApJ, 671, 1497, doi: 10.1086/521595
-
[18]
Cerulo, P., Couch, W. J., Lidman, C., et al. 2017, MNRAS, 472, 254, doi: 10.1093/mnras/stx1687
-
[19]
2014, ApJL, 782, L3, doi: 10.1088/2041-8205/782/1/L3
Chiang, Y.-K., Overzier, R., & Gebhardt, K. 2014, ApJL, 782, L3, doi: 10.1088/2041-8205/782/1/L3
-
[20]
Conselice, C. J. 2003, ApJS, 147, 1, doi: 10.1086/375001
-
[21]
Cooper, M. C., Newman, J. A., Madgwick, D. S., et al. 2005, ApJ, 634, 833, doi: 10.1086/432868
-
[22]
Cramer, W. J., Noble, A. G., Massingill, K., et al. 2023, ApJ, 944, 213, doi: 10.3847/1538-4357/acae96
-
[23]
Cramer, W. J., Noble, A. G., Rudnick, G., et al. 2024, ApJ, 975, 144, doi: 10.3847/1538-4357/ad7798 de Vaucouleurs, G. 1961, ApJS, 5, 233, doi: 10.1086/190056
-
[24]
Delahaye, A. G., Webb, T. M. A., Nantais, J., et al. 2017, ApJ, 843, 126, doi: 10.3847/1538-4357/aa756a
-
[25]
and Davis, Marc , month = feb, year =
Djorgovski, S., & Davis, M. 1987, ApJ, 313, 59, doi: 10.1086/164948 D’Onofrio, M., Marziani, P., & Buson, L. 2015, Frontiers in Astronomy and Space Sciences, 2, 4, doi: 10.3389/fspas.2015.00004
- [26]
-
[27]
Dressler, A., Oemler, Augustus, J., Couch, W. J., et al. 1997, ApJ, 490, 577, doi: 10.1086/304890 Euclid Collaboration, Cleland, C., Mei, S., et al. 2025, arXiv e-prints, arXiv:2503.15313, doi: 10.48550/arXiv.2503.15313
work page internal anchor Pith review Pith/arXiv arXiv doi:10.1086/304890 1997
-
[28]
Fasano, G., Poggianti, B. M., Couch, W. J., et al. 2000, ApJ, 542, 673, doi: 10.1086/317047
-
[29]
Fasano, G., Poggianti, B. M., Bettoni, D., et al. 2015, MNRAS, 449, 3927, doi: 10.1093/mnras/stv500
-
[30]
Freeman, K. C. 1970, ApJ, 160, 811, doi: 10.1086/150474
-
[31]
Goto, T., Yamauchi, C., Fujita, Y., et al. 2003, MNRAS, 346, 601, doi: 10.1046/j.1365-2966.2003.07114.x
-
[32]
, archivePrefix = "arXiv", eprint =
Grogin, N. A., Kocevski, D. D., Faber, S. M., et al. 2011, ApJS, 197, 35, doi: 10.1088/0067-0049/197/2/35
-
[33]
Gunn, J. E., & Gott, III, J. R. 1972, ApJ, 176, 1, doi: 10.1086/151605
-
[34]
Harrison, C. M., Johnson, H. L., Swinbank, A. M., et al. 2017, MNRAS, 467, 1965, doi: 10.1093/mnras/stx217
-
[35]
2021, ApJ, 912, 87, doi: 10.3847/1538-4357/abed4d
Hayden, B., Rubin, D., Boone, K., et al. 2021, ApJ, 912, 87, doi: 10.3847/1538-4357/abed4d
-
[36]
2010, ApJ, 711, 192, doi: 10.1088/0004-637X/711/1/192
Rudnick, G. 2010, ApJ, 711, 192, doi: 10.1088/0004-637X/711/1/192
-
[37]
Kauffmann, G., Heckman, T. M., White, S. D. M., et al. 2003, MNRAS, 341, 54, doi: 10.1046/j.1365-8711.2003.06292.x
-
[38]
, archivePrefix = "arXiv", eprint =
Kawinwanichakij, L., Papovich, C., Quadri, R. F., et al. 2017, ApJ, 847, 134, doi: 10.3847/1538-4357/aa8b75
-
[39]
, archivePrefix = "arXiv", eprint =
Koekemoer, A. M., Faber, S. M., Ferguson, H. C., et al. 2011, ApJS, 197, 36, doi: 10.1088/0067-0049/197/2/36
-
[40]
Kriek, M., van Dokkum, P. G., Labb´ e, I., et al. 2009, ApJ, 700, 221, doi: 10.1088/0004-637X/700/1/221
-
[41]
Larson, R. B., Tinsley, B. M., & Caldwell, C. N. 1980, ApJ, 237, 692, doi: 10.1086/157917
-
[42]
Lidman, C., Suherli, J., Muzzin, A., et al. 2012, MNRAS, 427, 550, doi: 10.1111/j.1365-2966.2012.21984.x
-
[43]
A New Non-Parametric Approach to Galaxy Morphological Classification
Lotz, J. M., Primack, J., & Madau, P. 2004, AJ, 128, 163, doi: 10.1086/421849
-
[44]
Marchesini, D., van Dokkum, P. G., F¨ orster Schreiber, N. M., et al. 2009, ApJ, 701, 1765, doi: 10.1088/0004-637X/701/2/1765
-
[45]
Matharu, J., Muzzin, A., Brammer, G. B., et al. 2019, MNRAS, 484, 595, doi: 10.1093/mnras/sty3465
-
[46]
Mei, S., Stanford, S. A., Holden, B. P., et al. 2012, ApJ, 754, 141, doi: 10.1088/0004-637X/754/2/141
-
[47]
and Amodeo, Stefania and Afanasiev, Anton V
Mei, S., Hatch, N. A., Amodeo, S., et al. 2023, A&A, 670, A58, doi: 10.1051/0004-6361/202243551
-
[48]
Mihos, J. C., & Hernquist, L. 1994, ApJL, 431, L9, doi: 10.1086/187460
-
[49]
Momcheva, I. G., Brammer, G. B., van Dokkum, P. G., et al. 2016, ApJS, 225, 27, doi: 10.3847/0067-0049/225/2/27
-
[50]
Moore, B., Katz, N., Lake, G., Dressler, A., & Oemler, A. 1996, Nature, 379, 613, doi: 10.1038/379613a0
-
[51]
2013, ApJ, 767, 39, doi: 10.1088/0004-637X/767/1/39
Muzzin, A., Wilson, G., Demarco, R., et al. 2013, ApJ, 767, 39, doi: 10.1088/0004-637X/767/1/39
-
[52]
Muzzin, A., Wilson, G., Yee, H. K. C., et al. 2009, ApJ, 698, 1934, doi: 10.1088/0004-637X/698/2/1934 —. 2012, ApJ, 746, 188, doi: 10.1088/0004-637X/746/2/188
-
[53]
2020, MNRAS, 499, 3061, doi: 10.1093/mnras/staa2872
Nantais, J., Wilson, G., Muzzin, A., et al. 2020, MNRAS, 499, 3061, doi: 10.1093/mnras/staa2872
-
[54]
Nantais, J. B., van der Burg, R. F. J., Lidman, C., et al. 2016, A&A, 592, A161, doi: 10.1051/0004-6361/201628663 23
-
[55]
B., Muzzin, A., van der Burg, R
Nantais, J. B., Muzzin, A., van der Burg, R. F. J., et al. 2017, MNRAS, 465, L104, doi: 10.1093/mnrasl/slw224
-
[56]
G., McDonald, M., Muzzin, A., et al
Noble, A. G., McDonald, M., Muzzin, A., et al. 2017, ApJL, 842, L21, doi: 10.3847/2041-8213/aa77f3
-
[57]
G., Muzzin, A., McDonald, M., et al
Noble, A. G., Muzzin, A., McDonald, M., et al. 2019, ApJ, 870, 56, doi: 10.3847/1538-4357/aaf1c6
-
[58]
Detailed Structural Decomposition of Galaxy Images
Peng, C. Y., Ho, L. C., Impey, C. D., & Rix, H.-W. 2002, AJ, 124, 266, doi: 10.1086/340952 —. 2010a, AJ, 139, 2097, doi: 10.1088/0004-6256/139/6/2097
work page internal anchor Pith review doi:10.1086/340952 2002
-
[59]
Peng, Y.-j., Lilly, S. J., Kovaˇ c, K., et al. 2010b, ApJ, 721, 193, doi: 10.1088/0004-637X/721/1/193 P´ erez-Mill´ an, D., Fritz, J., Gonz´ alez-L´ opezlira, R. A., et al. 2023, MNRAS, 521, 1292, doi: 10.1093/mnras/stad542
-
[60]
Postman, M., & Geller, M. J. 1984, ApJ, 281, 95, doi: 10.1086/162078
-
[61]
Postman, M., Franx, M., Cross, N. J. G., et al. 2005, ApJ, 623, 721, doi: 10.1086/428881
-
[62]
2020, ApJ, 899, 85, doi: 10.3847/1538-4357/aba42f
Sazonova, E., Alatalo, K., Lotz, J., et al. 2020, ApJ, 899, 85, doi: 10.3847/1538-4357/aba42f
-
[63]
Sersic, J. L. 1968, Atlas de Galaxias Australes
1968
-
[64]
McConnachie, A. W. 2011, ApJS, 196, 11, doi: 10.1088/0067-0049/196/1/11
-
[65]
Skelton, R. E., Whitaker, K. E., Momcheva, I. G., et al. 2014, ApJS, 214, 24, doi: 10.1088/0067-0049/214/2/24
-
[66]
2005, ApJ, 620, 78, doi: 10.1086/426930
Dressler, A. 2005, ApJ, 620, 78, doi: 10.1086/426930
-
[67]
Strateva, I., Ivezi´ c,ˇZ., Knapp, G. R., et al. 2001, AJ, 122, 1861, doi: 10.1086/323301
-
[68]
Strazzullo, V., Pannella, M., Mohr, J. J., et al. 2023, A&A, 669, A131, doi: 10.1051/0004-6361/202245268
-
[69]
2014, ApJ, 789, 164, doi: 10.1088/0004-637X/789/2/164
Tal, T., Dekel, A., Oesch, P., et al. 2014, ApJ, 789, 164, doi: 10.1088/0004-637X/789/2/164
-
[70]
Tasca, L. A. M., Kneib, J. P., Iovino, A., et al. 2009, A&A, 503, 379, doi: 10.1051/0004-6361/200912213 van der Burg, R. F. J., Muzzin, A., Hoekstra, H., et al. 2013, A&A, 557, A15, doi: 10.1051/0004-6361/201321237 van der Wel, A. 2008, ApJL, 675, L13, doi: 10.1086/529432 van der Wel, A., Bell, E. F., H¨ aussler, B., et al. 2012, ApJS, 203, 24, doi: 10.10...
-
[71]
Vulcani, B., Poggianti, B. M., Arag´ on-Salamanca, A., et al. 2011, MNRAS, 412, 246, doi: 10.1111/j.1365-2966.2010.17904.x
-
[72]
Vulcani, B., Poggianti, B. M., Gullieuszik, M., et al. 2023, ApJ, 949, 73, doi: 10.3847/1538-4357/acc5e2
-
[73]
Wang, H., Mo, H. J., Chen, S., et al. 2018, ApJ, 852, 31, doi: 10.3847/1538-4357/aa9e01
-
[74]
Wetzel, A. R., Tinker, J. L., Conroy, C., & van den Bosch, F. C. 2013, MNRAS, 432, 336, doi: 10.1093/mnras/stt469
-
[75]
Whitmore, B. C., & Gilmore, D. M. 1991, ApJ, 367, 64, doi: 10.1086/169602
-
[76]
Whitmore, B. C., Gilmore, D. M., & Jones, C. 1993, ApJ, 407, 489, doi: 10.1086/172531
-
[77]
Wilson, G., Muzzin, A., Yee, H. K. C., et al. 2009, ApJ, 698, 1943, doi: 10.1088/0004-637X/698/2/1943
discussion (0)
Sign in with ORCID, Apple, or X to comment. Anyone can read and Pith papers without signing in.