REVIEW 4 major objections 4 minor 20 references
Investigating the Reliability of the AfriTEC Model During the Descending Phase of Solar Cycle 24 Across East Africa
T0 review · 4 major / 4 minor · reviewed 2026-08-06 · deepseek-v4-flash
Pith's one-line read The paper claims AfriTEC captures East African TEC with errors generally below 1.5 TECU.
desk verdict A useful validation dataset undercut by a headline MAE claim that its own tables contradict. read the letter →
The pith
A machine-rendered reading of the paper's core claim, the machinery that carries it, and where it could break.
The reading
What carries the argument
The load-bearing object is AfriTEC, a neural-network-based regional model that outputs hourly vertical TEC for any African location and day, distributed as a MATLAB toolbox. The argument is carried by comparing that output with GNSS-derived vertical TEC at five IGS stations (MOIU, MAL2, ZAMB, ADIS, and MBAR) using two scalar metrics: mean absolute error (MAE, in TECU) and Pearson correlation coefficient r. Those two numbers are the entire quantitative bridge between model and observation in the paper, and every conclusion about model reliability is read off them.
What would settle it
Recompute AfriTEC's MAE for the same five stations and seasons using an independently processed TEC data set, computed with a documented bias-removal chain and at stations that were definitely not used to train AfriTEC; if the median equinox MAE exceeds 1.5 TECU at most stations, the abstract's headline accuracy claim is false.
Extended reading notes
Core claim
The paper's central claim is that AfriTEC, a neural-network regional model trained on African GNSS TEC data, reliably reproduces quiet-time ionospheric behavior over East Africa in 2016-2017. The abstract states the result as MAE values 'generally below 1.5 TECU' with correlations 'exceeding 0.80'; the paper's own Tables 2-6 list MAE values from 0.974 to 6.964 TECU across the five stations and seasons, and the discussion gives a typical MAE range of 1.2 to 4.6 TECU. The paper further claims AfriTEC outperforms NeQuick in most station-season cases, which it attributes to AfriTEC's regional calibration on African data, while conceding weaknesses during solstices, post-sunset hours, and events tied to the equatorial ionization anomaly. The intended takeaway is that AfriTEC is a useful regional modeling tool for the East African sector, but one that would benefit from real-time solar and geomagnetic index inputs.
Load-bearing premise
The whole evaluation depends on the GNSS-derived TEC serving as an accurate, independent ground truth; the paper does not describe how receiver and satellite biases were removed or whether the five test stations were part of AfriTEC's training data, so a flaw in that reference would shift every MAE and correlation value.
Editorial extensions
If this is right
- If the claims hold, AfriTEC can serve as a quiet-time TEC source for East Africa, filling observational gaps where GNSS receiver coverage is sparse.
- GNSS users in the region could apply AfriTEC-based corrections during low-solar-activity conditions, with error expectations in the 1-5 TECU range rather than the abstract's 1.5 TECU figure.
- The comparison with NeQuick suggests that regional calibration buys real accuracy over a global model in the African low-latitude sector, at least under moderate ionospheric conditions.
- The identified failure modes, especially solstice, post-sunset, and equatorial ionization anomaly periods, point to where adding real-time solar and geomagnetic indices would most improve AfriTEC.
Reading between the lines
- A testable extension the paper leaves open is checking whether any of the five validation stations were part of AfriTEC's training set; if they were, the reported MAE values are in-sample and optimistic for unseen locations.
- The gap between the abstract's 'generally below 1.5 TECU' and the tables' 0.97-6.96 TECU range suggests the summary statistic was computed on a subset of cases; recomputing seasonal median MAE across all five stations would settle which number represents typical performance.
- Because the paper does not document its TEC calibration chain, a natural follow-up is to re-run the same comparison with an openly documented bias-removal and slant-to-vertical mapping procedure, then see whether AfriTEC's daytime underestimation persists.
- The paper's closing suggestion of a hybrid model can be turned into a concrete test: blend AfriTEC with NeQuick and check whether the ensemble's equinox MAE falls below the better single model at MOIU and MBAR.
Editorial analysis
A structured set of objections, weighed in public.
Referee Report
Summary. The manuscript evaluates the AfriTEC model against GNSS-derived TEC at five East African stations (MOIU, MAL2, ZAMB, ADIS, MBAR) during the descending phase of Solar Cycle 24 (2016-2017), using MAE and the Pearson correlation coefficient, and it compares AfriTEC with NeQuick. The paper's central claim is that AfriTEC effectively captures the diurnal and seasonal behavior of TEC, with MAE values generally below 1.5 TECU and correlation coefficients exceeding 0.80, and that performance is best during equinoxes. The reported tables, however, show most MAE values between 1.69 and 6.96 TECU, the discussion states a range of 1.2 to 4.6 TECU, and the seasonal narrative is internally inconsistent.
Significance. A clean regional validation of AfriTEC would be valuable for African space-weather applications, and the explicit NeQuick comparison and reliance on public data are strengths. The paper, however, is not usable in its current form: the headline numerical claims are contradicted by the paper's own tables, and the manuscript does not establish that the five validation stations were outside AfriTEC's training data. These issues affect every derived conclusion, not just the framing.
major comments (4)
- [Abstract and Conclusion; Tables 2-6] The abstract and the first two bullets of the Conclusion state that MAE values are 'generally below 1.5 TECU' and that the model performs particularly well during equinoxes. Tables 2-6 contain 38 non-NaN AfriTEC MAE entries; only six meet the 1.5 TECU threshold (all but one at ZAMB), while the remaining 32 entries range from 1.690 to 6.964 TECU, including 6.307 and 6.964 TECU at MBAR in 2016. The headline accuracy claim is therefore not supported by the reported data.
- [Discussion ('Diurnal Variation of VTEC over East African Sector') and 'Seasonal Variations in MAE and Correlation…] The Discussion states that MAE ranged approximately between 1.2 and 4.6 TECU, which contradicts Tables 4 (e.g., MBAR September 2016: 6.307 TECU; December 2016: 6.964 TECU). Furthermore, the Abstract and Conclusion claim especially strong performance during equinoxes, but the 'Seasonal Variations in MAE and Correlation Coefficient' subsection concludes 'The AfriTEC model exhibits stronger performance during solstice periods', and the tables broadly show lower MAE in June and December. The paper cannot support both statements simultaneously.
- [Weaknesses of the AfriTEC Model] The first Weakness bullet cites a MOIU outlier with MAE 10.583 TECU 'likely corresponding to March Equinox 2016'. Table 2 lists MOIU March Equinox 2016 MAE as 4.583 TECU, and no 10.583 value appears in any table or figure. The provenance of this outlier, and which computation it belongs to, must be clarified; as written, the reference is unsupported by the presented data.
- [GNSS Data Processing and AfriTEC Model Data] The GNSS processing section describes the data only as 'processed using MATLAB scripts' and gives no details on differential code bias estimation and removal, elevation cutoff, cycle-slip handling, or the mapping function used to convert slant to vertical TEC. This is doubly important because AfriTEC is a neural network trained on African GNSS TEC data (Okoh et al., 2019): the manuscript never states whether any of the five validation stations (ZAMB, ADIS, MOIU, MAL2, MBAR) were part of the training set. If they were, the reported MAE and correlation values are not an independent validation. The authors should either confirm non-overlap using the station list from Okoh et al. or reframe the paper as a reproducibility/self-consistency check rather than a performance assessment.
minor comments (4)
- [Seasonal Variation Analysis and Tables 2-6] The text refers to 'Tables 1 - 5' and to 'Table 2' when discussing ZAMB, but the seasonal metrics appear in Tables 2-6; ZAMB is Table 3, MBAR is Table 4, ADIS is Table 5, and MAL2 is Table 6. Please correct all table cross-references.
- [AfriTEC Model Data] The phrase 'African GNNS TEC model' should read 'African GNSS TEC model'.
- [Competing Interests] The competing-interests statement says 'The author declares no competing interests', but the manuscript lists four authors; the statement should be pluralized or signed by all authors.
- [Figure 2 caption and Results text] The caption and text describe the MOIU period as '10-21 January 2016', but the text later says 'January 13 and 14' as the active days; please check the date range for consistency with the actual data interval used.
Circularity Check
Partial circularity: AfriTEC is validated against the same class of GNSS TEC data it was trained on, with no disclosed holdout or training-window separation, while the abstract's 'MAE generally below 1.5 TECU' claim is contradicted by the paper's own Tables 2-6.
-
fitted input called prediction
[AfriTEC Model Data subsection (p. 6) and Weaknesses of the AfriTEC Model bullet list (p. 18)]
"Using TEC data collected from GNSS receivers in different African locations for TEC modeling throughout the continent, (Okoh et al. 2019) developed the AfriTEC model. ... AfriTEC's data-driven nature means its performance is highly reliant on the quality and density of GNSS observational data used in its training."
The object being validated is a neural network fitted to GNSS-derived TEC over Africa, and the validation reference is GNSS-derived TEC at five East African IGS stations over 2016-2017. The paper never discloses whether ZAMB, ADIS, MOIU, MAL2, or MBAR were held out from the training set of Okoh et al.
-
self citation load bearing
[Introduction, paragraph 3 (p. 3)]
"In East Africa, the AfriTEC model has shown promising results in representing TEC patterns during both quiet and disturbed conditions. However, the model's accuracy tends to vary with latitude, time of day, and levels of geomagnetic activity Data et al. (2025)."
The premise that AfriTEC has already shown promising performance in East Africa, used to motivate this study, is supported only by Data et al. (2025), whose first author (E. A. Data) is the present paper's first author and whose second author (D. A. Terefe) is also a co-author here. The same self-reference is cited for the claim that the AfriTEC toolbox 'allows us to acquire a diurnal profile for any day of the year.' This is a self-citation chain: the paper's motivation and its account of how the model data were obtained rest on the authors' own prior unverified work. However, the paper's central quantitative comparison to GNSS data is presented in the new tables, so this self-citation is secondary rather than the entire derivation.
full rationale
The central derivation here is an empirical evaluation, not a first-principles derivation, so most circularity patterns do not apply; the GNSS reference data are external to the AfriTEC MATLAB toolbox. The grounds for a partial-circularity score are two. First, AfriTEC is a neural network trained on African GNSS-derived TEC (Okoh et al. 2019), and it is validated here against GNSS-derived TEC at five East African IGS stations for 2016-2017 with no disclosed train/validation split and no statement that the validation period postdates the training data; the paper's own Weaknesses section concedes that performance is 'highly reliant on the quality and density of GNSS observational data used in its training.' If any validation station or epoch is in the training set, the MAE and r values are in-sample fit statistics, so the 'prediction' claim is partly forced by construction. Second, the Introduction's premise that AfriTEC is already promising in East Africa rests on Data et al. (2025), a self-citation by the present first author and a co-author; that premise is load-bearing for the motivation but not for the tables. Weighing against higher scores, the comparison target (ICTP/ARPL GNSS TEC) is external to the model itself, and the errors are not computed by this paper's equations from the model's own training targets, so this is not a full self-definitional collapse. Separately, the paper's headline claim is falsified by its own tables: the Abstract and Conclusion state MAE 'generally below 1.5 TECU,' yet only 6 of 38 non-NaN AfriTEC MAE entries in Tables 2-6 are at or below 1.5 TECU, with values up to 6.964 TECU; the Discussion states a range of 1.2-4.6 TECU, and the Weaknesses section cites a MOIU outlier of 10.583 TECU that does not appear in Table 2. Additionally, the Abstract's emphasis on equinox performance contradicts the Seasonal Variation section, which states AfriTEC 'exhibits stronger performance during solstice periods,' a claim the tables support. These are internal contradictions rather than circularity, but they reinforce that the central claim is not even supported by the paper's own reported numbers.
Assumptions & free parameters
assumptions (5)
- domain assumption GNSS-derived TEC from the ICTP ARPLS repository is correctly calibrated (differential code biases removed)
- domain assumption The AfriTEC MATLAB toolbox as downloaded represents the model described in Okoh et al. 2019
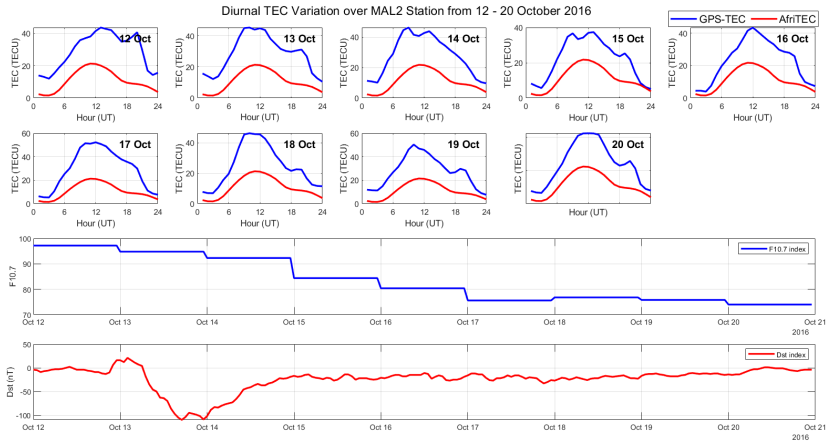
- domain assumption The selected short time windows (e.g., 10-21 Jan 2016, 12-20 Oct 2016, 6-10 Sep 2017) are representative of the corresponding seasons
- domain assumption The five stations are representative of the East African equatorial and low-latitude ionosphere
- domain assumption The validation stations are not part of the AfriTEC training set
Cite this review
Pith. "Pith review of Investigating the Reliability of the AfriTEC Model During the Descending Phase of Solar Cycle 24 Across East Africa." pith.science (2026). https://pith.science/paper/K65BPWEV
@misc{pith2026250710275,
  author       = {Pith},
  title        = {Pith review of: Investigating the Reliability of the AfriTEC Model During the Descending Phase of Solar Cycle 24 Across East Africa},
  year         = {2026},
  howpublished = {\url{https://pith.science/paper/K65BPWEV}},
  note         = {Machine review of arXiv:2507.10275}
}
read the original abstract
This study investigates the reliability of the African Regional Ionospheric Total Electron Content (AfriTEC) model during the descending phase of Solar Cycle 24 (2016-2017) across East Africa. Using GNSS-derived TEC data from five equatorial and low-latitude stations MOIU, MAL2, ZAMB, ADIS, and MBAR the model's performance is assessed through statistical metrics, including Mean Absolute Error (MAE) and correlation coefficient r. Results indicate that the AfriTEC model effectively captures the diurnal and seasonal behavior of TEC, particularly during equinoxes, with MAE values generally below 1.5 TECU and correlation coefficients exceeding 0.80. However, discrepancies emerge during solstice periods and post-sunset hours, reflecting the model's limitations in representing complex ionospheric processes such as the Equatorial Ionization Anomaly (EIA). To benchmark its performance, AfriTEC is also compared against the widely used NeQuick model. AfriTEC demonstrates superior regional adaptability and reduced error under most conditions, though it remains sensitive to localized ionospheric disturbances. These findings suggest that while AfriTEC is a valuable tool for ionospheric modeling in whole Africa especially at East African sector, enhancements incorporating real-time solar and geomagnetic indices could further improve its predictive capabilities.
Figures


Figures from the paper (6 more)


Reference graph
Works this paper leans on
-
[1]
Chemin, Y. (2023). Ionosphere - New Perspectives: New Perspectives. BoD - Books on Demand
work page 2023
-
[2]
Data, E.A., Terefe, D.A. & Gebino, G.K. Performance evaluation of AfriTEC model during quiet and disturbed time over East African sector. Astrophys Space Sci 370, 45 (2025). https://doi.org/10.1007/s10509-025-04437-4
-
[3]
Soni, S., & Gour, P. S. (2021, January 29). Flare related geomagnetic storms with coronal mass ejections, radio bursts and jumps in solar wind plasma density. International Journal of Innovative Research and Growth, 10(2). https://doi.org/10.26671/ijirg.2020.2.10.101
-
[4]
Okoh, D., Seemala, G., Rabiu, B., Habarulema, J. B., Jin, S., Shiokawa, K., Otsuka, Y., Aggarwal, M., Uwamahoro, J., Mungufeni, P., Segun, B., Obafaye, A., Ellahony, N., Okonkwo, C., Tshisaphungo, M., & Shetti, D. (2019, December). A Neural Network-Based Ionospheric Model Over Africa From Constellation Observing System for Meteorology, Ionosphere, and Cli...
work page 2019
-
[5]
Ryutova, M. (2018). Physics of magnetic flux tubes. Springer
work page 2018
-
[6]
Aarons, J. (1993). The longitudinal morphology of equatorial F-layer irregularities relevant to their occurrence. Space Science Reviews, 63(3-4), 209--243. Springer
work page 1993
-
[7]
Komjathy, A. (1997). Global ionospheric total electron content mapping using the Global Positioning System (PhD thesis). University of New Brunswick
work page 1997
-
[8]
Yizengaw, E., Carter, B. A., Retterer, J. M., Groves, K. M., & Caton, R. G. (2014). Regional GPS TEC calibration model for Africa. Radio Science, 49(9), 731--741. Wiley Online Library
work page 2014
Show all 20 references
-
[9]
Clette, F., & Lefevre, L. (2016). The new Sunspot Number: assembling all corrections. Solar Physics, 291(9-10), 2629--2651. Springer
2016
-
[10]
O., Baki, P., Cilliers, P
Olwendo, J. O., Baki, P., Cilliers, P. J., & Doherty, P. (2018). Characteristics of ionospheric TEC variations and scintillation over Kenya during the descending phase of solar cycle 24. Advances in Space Research, 61(2), 536--548. Elsevier
2018
-
[11]
Bilitza, D., Altadill, D., Truhlik, V., Shubin, V., Galkin, I., Reinisch, B., & Huang, X. (2014). The International Reference Ionosphere 2012 - A model of international collaboration. Space Science Reviews, 180(1--4), 49--92. Springer
2014
-
[12]
I., Adeniyi, J
Fagbola, O. I., Adeniyi, J. O., Radicella, S. M., & Okeke, P. N. (2011). A seasonal variation study of TEC over the African sector. Space Weather, 9(10), S10001. Wiley
2011
-
[13]
Data, E. A. (2025). Variation of Total Electron Content over May 10 - 13 2024 Geomagnetic Super Storm in South Africa. International Journal of Astrophysics and Space Science, 13(2), 21-35. https://doi.org/10.11648/j.ijass.20251302.11
2025 doi
-
[14]
Liu, L., Le, H., Chen, Y., Zhang, H., & Wan, W. (2017). Solar cycle variation of ionospheric TEC over the African region. Journal of Geophysical Research: Space Physics, 122(5), 5166--5178. AGU
2017
-
[15]
Tsai, L.-C., Su, S.-Y., Yeh, H.-C., Liu, C.-H., & Chao, C.-K. (2016). Ionospheric behavior during equinoxes over the equatorial region. Journal of Geophysical Research: Space Physics, 121(6), 5942--5951. AGU
2016
-
[16]
O., Oyeyemi, E
Adewale, A. O., Oyeyemi, E. O., & Adeloye, A. B. (2012). TEC prediction at low latitude using neural networks. Radio Science, 47(4), RS4005
2012
-
[17]
Zhang, M.-L., Xiao, Z., Wang, Y., & Hao, Y.-Q. (2009). The climatological morphology of the equatorial ionization anomaly based on long-term ionosonde observations. Annales Geophysicae, 27, 3321-3330
2009
-
[18]
Pesnell, W. D. (2012). Solar cycle predictions (invited review). Solar Physics, 281(1), 507-532
2012
-
[19]
O., Cilliers, P
Olwendo, J. O., Cilliers, P. J., Baki, P., & Rabiu, A. B. (2016). Characterization of ionospheric variability and GNSS performance over the East African sector during solar maximum. Advances in Space Research, 58(12), 2550-2565
2016
-
[20]
M., & Leitinger, R
Radicella, S. M., & Leitinger, R. (2001). The evolution of the NeQuick model. Advances in Space Research, 27(1), 35-40
2001
Reviewed August 6, 2026 · model on record in the stance chip above.
Discussion (0). Continue with ORCID to comment.