AI Data Centers and the Water Use Feedback Loop
Pith reviewed 2026-06-26 12:21 UTC · model grok-4.3
The pith
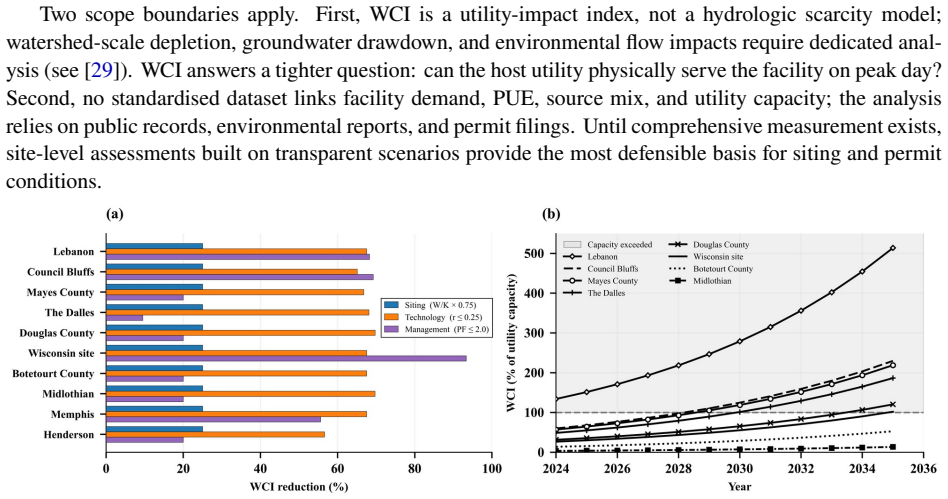
The Water Consumption Impact index shows AI data center water use burdens local utilities from 0.2% to 134% of capacity across ten US sites.
A machine-rendered reading of the paper's core claim, the machinery that carries it, and where it could break.
Core claim
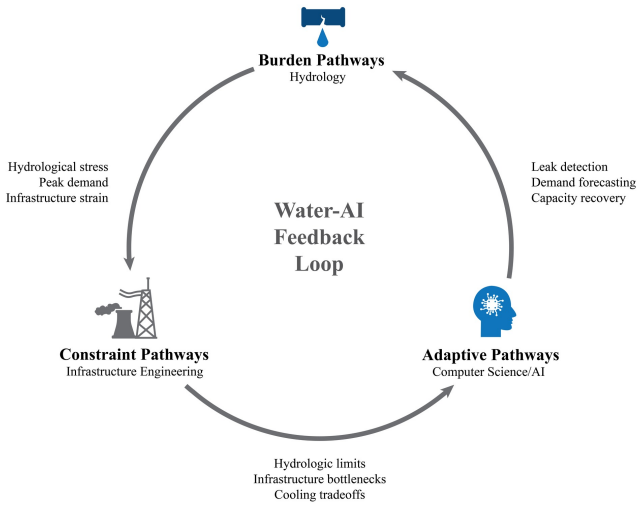
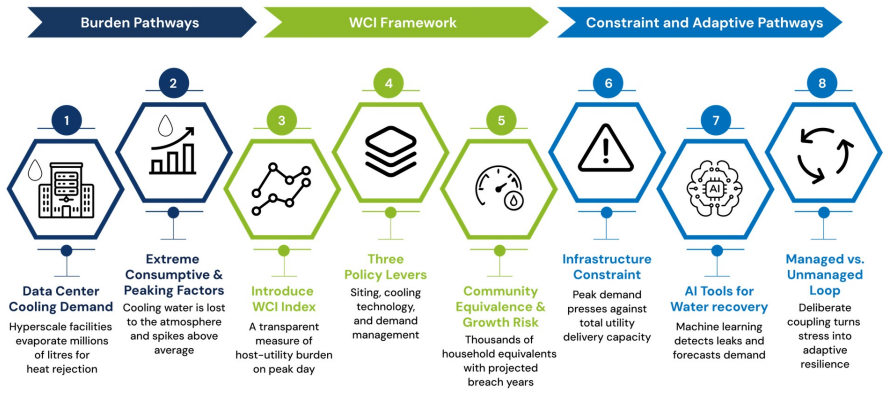
The paper claims that the Water and AI Feedback Loop can be formalized by linking cooling-driven consumption, scarcity-driven siting limits, and AI-enabled efficiency gains; the new Water Consumption Impact index then quantifies the resulting community-scale utility burden and demonstrates that this burden ranges from 0.2% to 134% of host capacity at the ten studied US sites.
What carries the argument
The Water Consumption Impact index, which quantifies community-scale utility burden from data center water consumption.
If this is right
- Data center location decisions are shaped by local water availability through the feedback loop.
- Some host communities experience negligible added burden while others face demands exceeding their entire utility capacity.
- AI-driven improvements in water management can close the loop by offsetting consumption increases.
- Treating the three dynamics in isolation underestimates their combined effects on siting and resource planning.
Where Pith is reading between the lines
- The index could be adapted to compare burdens from other large water users such as manufacturing plants.
- Regional water planning agencies could incorporate the index when reviewing new data center permits.
- Extending the analysis beyond the US would test whether the three-order-of-magnitude variation holds in different climates and regulatory settings.
Load-bearing premise
The ten US sites provide a representative sample of the feedback loop dynamics and the index calculation accurately reflects real community water burden without unaccounted factors such as seasonal variation or alternative cooling technologies.
What would settle it
Water-use and capacity data from a new set of data centers outside the original ten sites that fall consistently outside the reported 0.2–134% range would falsify the claimed span of the burden.
Figures
read the original abstract
AI data centres consume water for cooling, water scarcity constrains siting, and AI tools can improve water system efficiency. These dynamics are studied separately yet form a feedback loop. This review formalises the Water and AI Feedback Loop, introduces the Water Consumption Impact index to quantify community-scale utility burden, and demonstrates across ten US sites that burden spans three orders of magnitude, from 0.2% to 134% of host capacity.
Editorial analysis
A structured set of objections, weighed in public.
Referee Report
Summary. The manuscript formalizes the Water and AI Feedback Loop (data-center cooling water use, scarcity-driven siting constraints, and AI-enabled efficiency gains), introduces a Water Consumption Impact index to quantify community-scale utility burden, and applies the index to ten US sites to report that the burden spans three orders of magnitude (0.2 % to 134 % of host capacity).
Significance. If the index definition, data sources, and calculations are shown to be robust, the reported three-order-of-magnitude variability would provide a concrete, site-specific metric for assessing water-system stress from AI infrastructure and could usefully integrate previously separate strands of research on cooling technology, water policy, and AI optimization.
major comments (1)
- [Abstract] Abstract: the central empirical claim (three-order-of-magnitude span across ten sites) is presented without any definition or formula for the Water Consumption Impact index, without listing the ten sites or selection criteria, and without describing data sources, seasonal adjustments, or uncertainty quantification; these omissions make the reported range unverifiable and therefore load-bearing for the paper's main result.
Simulated Author's Rebuttal
We thank the referee for highlighting the need for greater self-containment in the abstract. We agree that the central empirical claim requires supporting details to be verifiable at a glance and will revise accordingly.
read point-by-point responses
-
Referee: [Abstract] Abstract: the central empirical claim (three-order-of-magnitude span across ten sites) is presented without any definition or formula for the Water Consumption Impact index, without listing the ten sites or selection criteria, and without describing data sources, seasonal adjustments, or uncertainty quantification; these omissions make the reported range unverifiable and therefore load-bearing for the paper's main result.
Authors: We agree the abstract as written omits key definitional and methodological elements. The full manuscript defines the Water Consumption Impact index (including its formula) in Section 3, enumerates the ten sites together with explicit selection criteria in Section 4.1, and details the underlying data sources, seasonal adjustments, and uncertainty quantification in Sections 4.2–4.3 and 5. To make the abstract self-contained, we will insert a concise one-sentence definition of the index, name the sites and selection rationale, and briefly note the data sources and adjustments. These additions will render the reported range verifiable from the abstract while remaining within typical length limits. revision: yes
Circularity Check
No significant circularity
full rationale
The paper introduces the Water Consumption Impact index as a new quantification tool and applies it directly to observed data from ten US sites to report a range in burden. No equations, derivations, fitted parameters renamed as predictions, or self-citation chains are described that would reduce any claimed result to its own inputs by construction. The abstract and summary contain no load-bearing steps matching the enumerated circularity patterns; the central demonstration is an empirical application of a defined index rather than a self-referential derivation.
Axiom & Free-Parameter Ledger
Reference graph
Works this paper leans on
-
[1]
Shehabi, S
A. Shehabi, S. J. Smith, A. Hubbard, A. Newkirk, N. Lei, M. A. Siddik, B. Holecek, J. G. Koomey, E. Masanet, and D. A. Sartor. 2024 United States data center energy usage report. Technical Report LBNL-2001637,LawrenceBerkeleyNationalLaboratory,2024.URLhttps://eta.lbl.gov/publications/ 2024-lbnl-data-center-energy-usage-report
2024
-
[2]
Powering intelligence 2026: Updated scenarios of U.S
Electric Power Research Institute. Powering intelligence 2026: Updated scenarios of U.S. data center electricity use and power strategies. Technical report, EPRI, February 2026. URL https: //powering-intelligence.epri.com
2026
-
[3]
Energy Information Administration
U.S. Energy Information Administration. Short-term energy outlook. Technical report, U.S. Depart- ment of Energy, April 2026. URL https://www.eia.gov/outlooks/steo/
2026
-
[4]
D. Mytton. Data centre water consumption.npj Clean Water, 4:11, 2021. doi:10.1038/s41545-021- 00101-w
-
[5]
M. A. Siddik, A. Shehabi, and L. Marston. The environmental footprint of data centers in the United States.Environmental Research Letters, 16(6):064017, 2021. doi:10.1088/1748-9326/abfba1
-
[6]
MakingAIless“thirsty”: Uncovering and addressing the secret water footprint of AI models.Communications of the ACM, 68(7):54–63,
PengfeiLi,JianyiYang,MohammadA.Islam,andShaoleiRen. MakingAIless“thirsty”: Uncovering and addressing the secret water footprint of AI models.Communications of the ACM, 68(7):54–63,
-
[7]
doi:10.1145/3724499. 38
- [8]
-
[9]
N. Lei, J. Lu, A. Shehabi, and E. Masanet. The water use of data center workloads: A review and assessment of key determinants.Resources, Conservation and Recycling, 211:107612, 2025. doi:10.1016/j.resconrec.2025.108310
-
[10]
Alex de Vries and Yu Gao. The carbon and water footprints of data centers and what this could mean for artificial intelligence.Patterns, 6(4):101177, 2025. doi:10.1016/j.patter.2025.101177
-
[11]
Principles for sustainable water use by data centers
Water-AI Nexus Center of Excellence. Principles for sustainable water use by data centers. Insight Report, 2025. URL https://water-ai-nexus.org/insight-report/
2025
-
[12]
Zohar Barnett-Itzhaki. The water footprint of artificial intelligence: Emerging solutions and gover- nance imperatives.Water Research, 299:125866, 2026. doi:10.1016/j.watres.2026.125866
-
[13]
Google’s Uruguay data center approved after reformulation
DataCenterDynamics. Google’s Uruguay data center approved after reformulation. DataCenterDy- namics news article, 2023. URL https://www.datacenterdynamics.com/en/news/googles-uruguay- data-center-approved-after-reformulation/
2023
-
[14]
The cloud vs
Mongabay. The cloud vs. drought: Water hog data centers threaten Latin America, critics say. Mongabay environmental news, 2023. URL https://news.mongabay.com/2023/11/the-cloud- vs-drought-water-hog-data-centers-threaten-latin-america-critics-say/
2023
-
[15]
Martin Tironi and Camila Albornoz. Divergent futures in a damaged territory: The rise of data centers and water conflicts in Santiago de Chile.Journal of Urban Technology, 32(4):51–68, 2025. doi:10.1080/10630732.2025.2546784
-
[16]
The ongoing impact of Amsterdam’s data center moratorium
DataCenterDynamics. The ongoing impact of Amsterdam’s data center moratorium. DataCenterDy- namics analysis, 2022. URL https://www.datacenterdynamics.com/en/analysis/the-ongoing-impact- of-amsterdams-data-center-moratorium/
2022
-
[17]
Policy decision paper, 2025
CommissionforRegulationofUtilities.Largeenergyusersconnectionpolicydecision(CRU/202504). Policy decision paper, 2025. URL https://consult.cru.ie/en/consultation/review-large-energy-users- connection-policy
2025
-
[18]
Waterandwastewateragreement(ProjectDomino/OrlaLLC/Meta)
CityofLebanon,Indiana. Waterandwastewateragreement(ProjectDomino/OrlaLLC/Meta). Legal Agreement, 2025. URL https://lebanon.in.gov/wp-content/uploads/2025/01/Project-Domino-Water- and-Wastewater-Agreement-Final-11.03.25.pdf
2025
-
[19]
Yuelin Han, Pengfei Li, Adam Wierman, and Shaolei Ren. Small bottle, big pipe: Quantifying and addressing the impact of data centers on public water systems.arXiv preprint arXiv:2603.02705,
- [20]
-
[21]
Global data center water stress analysis: 43% in high-stress areas
S&P Global Platts. Global data center water stress analysis: 43% in high-stress areas. Technical report,S&PGlobal,2025. URLhttps://www.spglobal.com/sustainable1/en/insights/special-editorial/ beneath-the-surface-water-stress-in-data-centers
2025
-
[22]
M. Hayslep, E. Keedwell, and R. Farmani. Leakage prediction in real-world water distribution networksusingmulti-objectivemulti-genegeneticprogramming.ACMTransactionsonEvolutionary Learning and Optimization, 1(1):1–25, 2025. doi:10.1145/3729431. 39
-
[23]
R.J.L.Taloma. Machinelearningforsmartwaterdistributionsystems: Exploringapplications,chal- lenges and future perspectives.Artificial Intelligence Review, 58(3):75, 2025. doi:10.1007/s10462- 024-11093-7
-
[24]
G. Fu, Y. Jin, S. Sun, Z. Yuan, and D. Butler. The role of deep learning in urban water management: A critical review.Water Research, 223:119098, 2022. doi:10.1016/j.watres.2022.118973
-
[25]
WaterTwin-AI. AI-enhanced digital twin platform for smart water distribution: Integrating machine learning models with IoT-driven predictive analytics. Preprint, 2025. URL https://www.preprints. org/manuscript/202510.1750
arXiv 2025
-
[26]
F.Kratzert,D.Klotz,C.Brenner,K.Schulz,andM.Herrnegger. Towardslearninguniversal,regional, and local hydrological behaviors via machine learning applied to large-sample datasets.Hydrology and Earth System Sciences, 23(12):5089–5110, 2019. doi:10.5194/hess-23-5089-2019
-
[27]
G. S. Nearing, F. Kratzert, A. K. Sampson, C. M. Pelissier, D. Klotz, J. M. Frame, and H. V. Gupta. Whatroledoeshydrologicalscienceplayintheageofmachinelearning?WaterResourcesResearch, 57(3):e2020WR028091, 2021. doi:10.1029/2020WR028091
-
[28]
R. Liemberger and A. Wyatt. Quantifying the global non-revenue water problem.Water Supply, 19 (3):831–837, 2019. URL https://doi.org/10.2166/ws.2018.129
-
[29]
N. Lei and E. Masanet. Climate- and technology-specific PUE and WUE estimations for U.S. data centers using a hybrid statistical and thermodynamics-based approach.Resources, Conservation and Recycling, 180:106175, 2022. doi:10.1016/j.resconrec.2022.106323
-
[30]
M. A. B. Siddik, J. R. Sanchez, and A. Shehabi. Spatially and temporally detailed water and carbon footprintsofU.S.electricitygenerationanduse.WaterResourcesResearch,50(12):WR038350,2024. doi:10.1029/2024WR038350
-
[31]
Amanambu, Jonathan Frame, and Adeyemi Olusola
Amobichukwu C. Amanambu, Jonathan Frame, and Adeyemi Olusola. Where AI runs determines water stress.ESSOAr preprint, 2026. doi:10.22541/essoar.15001296/v1
-
[32]
S. N. Ahmed, K. Bencala, S. Nummer, C. L. Schultz, and A. Seck. 2025 Washington Metropolitan Areawatersupplystudy. TechnicalReportICPRBReport25-1,InterstateCommissiononthePotomac River Basin, 2025. URL https://www.potomacriver.org/wp-content/uploads/2025/12/2025_WMA_ Water_Supply_Study_ICPRB_Dec-2025.pdf
2025
-
[33]
L. Karimi, L. Yacuel, J. D. Johnson, J. Ashby, M. Green, M. Renner, A. Bergman, R. Norwood, and K. L. Hickenbottom. Water-energy tradeoffs in data centers: A case study in hot-arid climates. Resources, Conservation and Recycling, 181:106194, 2022. doi:10.1016/j.resconrec.2022.106194
-
[34]
Medalie, J
L. Medalie, J. W. Roy, and D. Lorenz. USGS water use statistics for the nation. Technical report, US Geological Survey, 2025. URL https://pubs.usgs.gov/publication/pp1894D/full
2025
-
[35]
Data centers and water use in the Potomac River basin, March 2026
Interstate Commission on the Potomac River Basin. Data centers and water use in the Potomac River basin, March 2026. URL https://www.potomacriver.org/focus-areas/water-resources-and-drinking- water/water-resources/planning/data-centers-and-water-use-in-the-potomac-river-basin/
2026
-
[36]
Datacenterwateruse: Frequentlyaskedquestions
SusquehannaRiverBasinCommission. Datacenterwateruse: Frequentlyaskedquestions. Technical report, SRBC, 2025. URL https://www.srbc.gov/about/news/docs/srbc-data-centers-faq.pdf. 40
2025
-
[37]
Zúñiga Uribe et al
J. Zúñiga Uribe et al. Artificial intelligence in water distribution networks: A systematic review of models, input variables, databases, and output strategies for leak detection.Smart Cities, 9(3):45,
-
[38]
URL https://www.mdpi.com/2624-6511/9/3/45
doi:10.3390/smartcities9030045. URL https://www.mdpi.com/2624-6511/9/3/45
-
[39]
and LimnoTech
Meta Platforms Inc. and LimnoTech. Volumetric water benefits assessment for data center opera- tions. Technical assessment, 2025. URL https://sustainability.atmeta.com/wp-content/uploads/2025/ 08/REVISED_FINAL_Meta_2024_Volumetric_Water_Benefit_Report_08.21.2025.pdf
2025
-
[40]
Datacenterswaterfootprint: Theneedformoretransparency
C.Privette,W.Sobczak,andJ.Zhuang. Datacenterswaterfootprint: Theneedformoretransparency. AGU Advances, 7(1):e2025AV002140, 2026. doi:10.1029/2025AV002140
-
[41]
Andrea Marinoni, Erik Cambria, Luca Dal Zilio, Weisi Lin, Mauro Dalla Mura, Jocelyn Chanussot, Edoardo Ragusa, Chi Yan Tso, Yihao Zhu, and Benjamin Horton. The data heat island effect: quantifying the impact of AI data centers in a warming world.arXiv preprint arXiv:2603.20897,
-
[42]
doi:10.48550/arXiv.2603.20897
work page internal anchor Pith review Pith/arXiv arXiv doi:10.48550/arxiv.2603.20897
-
[43]
Michael Rubinovitz. Here comes the cloud: The effect of data centers on homeowners in Northern Virginia.SSRN preprint, 2026. doi:10.2139/ssrn.6136790
-
[44]
F.Jiang,C.Duan,andB.Chen. Facility-levelenergy-drivenwaterfootprintandscarcityimplications of Chinese data centers: A bottom-up analysis and scenario-based projection.Applied Energy, 399: 126522, 2025. doi:10.1016/j.apenergy.2025.126522
-
[45]
Data center electricity consumption in Ireland: 22% of na- tionalgrid
Central Statistics Office Ireland. Data center electricity consumption in Ireland: 22% of na- tionalgrid. Statisticalreport,2025. URLhttps://www.cso.ie/en/releasesandpublications/ep/p-dcmec/ datacentresmeteredelectricityconsumption2024/
2025
-
[46]
2025 corporate environmental report
Apple Inc. 2025 corporate environmental report. Technical report, Apple Inc., 2025. URL https: //www.apple.com/environment/pdf/Apple_Environmental_Progress_Report_2025.pdf
2025
-
[47]
The Dalles data center water expansion: Community and infrastructure reporting
Oregon Public Broadcasting. The Dalles data center water expansion: Community and infrastructure reporting. NewsInvestigation,2026. URLhttps://www.opb.org/article/2026/01/15/as-googles-water- demands-grow-the-dalles-aims-to-pull-more-from-mount-hood-forest/
2026
-
[48]
Microsoft data centers will use up to 8.4 million gallons of water each year, recordsshow
Wisconsin Public Radio. Microsoft data centers will use up to 8.4 million gallons of water each year, recordsshow. WisconsinPublicRadionewsarticle,basedonpublicrecordsrequest,September2025. URL https://www.wpr.org/news/microsoft-data-centers-8-million-gallons-water-each-year
-
[49]
S. N. Ahmed, K. Bencala, S. Nummer, C. L. Schultz, and A. Seck. 2025 Washington Metropolitan Area water supply study: Demand and resource availability forecast for the year 2050.Interstate Commission on the Potomac River Basin (ICPRB REPORT NO. ICP-596), December 2025
2025
-
[50]
Drinking water infrastructure needs survey and assessment, 7th report
US EPA. Drinking water infrastructure needs survey and assessment, 7th report. Technical Report EPA/816-R-23-001, United States Environmental Protection Agency, 2023. URL https://www.epa. gov/dwsrf/epas-7th-drinking-water-infrastructure-needs-survey-and-assessment
2023
-
[51]
Infrastructure investment benefits and water system resilience
Value of Water Campaign. Infrastructure investment benefits and water system resilience. White Paper Report, 2025. URL https://www.thevalueofwater.org/
2025
-
[52]
A. Alkrush, E. Habib, and H. Alquobaity. Data centers cooling: A critical review of techniques, challenges, and energy saving solutions.International Journal of Refrigeration, 160:246–262, 2024. doi:10.1016/j.ijrefrig.2024.02.007. 41
-
[53]
W. E. Gnibga, A. A. Chien, A. Blavette, and A. C. Orgerie. FlexCoolDC: Datacenter cooling flexibilityforharmonizingwater,energy,carbon,andcosttrade-offs. InProceedingsofthe15thACM InternationalConferenceonFutureandSustainableEnergySystems(E-Energy’24),pages305–316. ACM, 2024. doi:10.1145/3632775.3661936
-
[54]
D. E. Sickinger, O. D. Van Geet, S. A. Belmont, T. Carter, and D. Martinez. Thermosyphon cooler hybridsystemforwatersavingsinanenergy-efficientHPCdatacenter: Resultsfrom24monthsandthe impact on water usage effectiveness. Technical Report NREL/TP-2C00-72196, National Renewable Energy Laboratory, 2018
2018
-
[55]
H. Jager and H. S. Yoon. Data centers as an emerging threat to freshwater biodiversity in the United States.Water Biology and Security, 5:100585, 2026. doi:10.1016/j.watbs.2026.100585
-
[56]
Data center water demand analysis and global infrastructure investment
Roland Berger. Data center water demand analysis and global infrastructure investment. Technical report, Roland Berger GmbH, 2025. URL https://www.rolandberger.com/en/Insights/Publications/ Water-demands-of-the-data-economy.html
2025
-
[57]
Lebanon, Indiana data center announcement
Meta Platforms Inc. Lebanon, Indiana data center announcement. Press Release, 2026. URL https://about.fb.com/news/2026/02/metas-new-data-center-lebanon-indiana-marks-milestone- ai-investment/
2026
-
[58]
F. Farfan and A. Lohrmann. Gone with the clouds: Estimating the electricity and water foot- print of digital data services in Europe.Energy Conversion and Management, 277:116617, 2023. doi:10.1016/j.enconman.2023.117225
-
[59]
C. Falk, S. Acharyya, B. Chou, and J. Sorensen. From FLOPs to footprints: The resource cost of artificialintelligence.arXivpreprintarXiv:2512.04142,2025. URLhttps://arxiv.org/abs/2512.04142
arXiv 2025
-
[60]
Wattnet: matching electricity consumption with low-carbon, low-water footprint energy supply
M. Castrill, P. Melguizo, and A. García. Wattnet: matching electricity consumption with low-carbon, low-water footprint energy supply.arXiv preprint arXiv:2601.11623., 2026. doi:10.48550/arXiv.2601.11623
work page internal anchor Pith review Pith/arXiv arXiv doi:10.48550/arxiv.2601.11623 2026
-
[61]
M. Herrera, G. Ortiz, L. Gonzalez, and J. Perez. Sustainable AI infrastructure: A scenario-based forecast of water footprint under uncertainty.Journal of Cleaner Production, 381:135038, 2025. doi:10.1016/j.jclepro.2025.146528
-
[62]
B.XiaoandF.You. Environmentalimpactandnet-zeropathwaysforsustainableartificialintelligence serversintheUSA.NatureSustainability,8(12):1456–1468,2025.doi:10.1038/s41893-025-01681-y
-
[63]
North America data center market report: $1 trillion projected development
JLL. North America data center market report: $1 trillion projected development. Technical report, JonesLangLaSalle,2025.URLhttps://www.jll.com/en-us/insights/market-dynamics/north-america- data-centers
2025
-
[64]
US data center economic analysis: $6.7 trillion cumu- lative capex projection
McKinsey and Company. US data center economic analysis: $6.7 trillion cumu- lative capex projection. Technical report, McKinsey and Company, 2025. URL https://www.mckinsey.com/industries/technology-media-and-telecommunications/our-insights/ the-cost-of-compute-a-7-trillion-dollar-race-to-scale-data-centers
2025
-
[65]
Sameer H. Shah. Four water insecurity concerns about datacenters driving the AI revolution.PLOS Water, 5(1):e0000500, 2026. doi:10.1371/journal.pwat.0000500. 42
-
[66]
URL https://www.nytimes.com/2025/07/14/technology/meta-data-center-water.html
JackHealyandMarinaFang.TheirwatertapsrandrywhenMetabuiltnextdoor.TheNewYorkTimes, July 2025. URL https://www.nytimes.com/2025/07/14/technology/meta-data-center-water.html
2025
-
[67]
Port Washington, Wisconsin data center water infrastructure reporting
Spectrum News. Port Washington, Wisconsin data center water infrastructure reporting. News Coverage, 2025. URL https://spectrumnews1.com/wi/milwaukee/news/2025/09/23/data-center-port- washington
2025
-
[68]
Z. J. Lyle, J. M. VanBriesen, and C. Samaras. Climate risk index for US drinking water utilities: As- sessinghazard,vulnerability,andexposurefor1,455utilities.CommunicationsEarth&Environment, 7:68, 2025. doi:10.1038/s43247-025-03044-z
-
[69]
S. Solomon. Sustainable by design: Next-generation datacenters consume zero wa- ter for cooling. The Microsoft Cloud Blog, December 9, 2024, 2024. URL https://www.microsoft.com/en-us/microsoft-cloud/blog/2024/12/09/sustainable-by-design-next- generation-datacenters-consume-zero-water-for-cooling/
2024
-
[70]
Commission Delegated Regulation (EU) 2024/1364 establishing a common Union rating scheme for data centres
European Commission. Commission Delegated Regulation (EU) 2024/1364 establishing a common Union rating scheme for data centres. Official Journal of the European Union, 2024. URL https: //eur-lex.europa.eu/eli/reg_del/2024/1364/oj/eng
2024
-
[71]
Data drain: The land and water impacts of the AI boom.Land Lines Maga- zine, 2025
Jon Gorey. Data drain: The land and water impacts of the AI boom.Land Lines Maga- zine, 2025. URL https://www.lincolninst.edu/publications/land-lines-magazine/articles/land-water- impacts-data-centers/
2025
-
[72]
Green Data Centre Technology Roadmap
Infocomm Media Development Authority. Green Data Centre Technology Roadmap. Technical report, IMDA, Government of Singapore, 2024. URL https://www.imda.gov.sg/how-we-can-help/ green-dc-roadmap
2024
-
[73]
Energy Efficiency Act (Energieeffizienzgesetz, EnEfG)
Federal Republic of Germany. Energy Efficiency Act (Energieeffizienzgesetz, EnEfG). Federal Law Gazette, 2023. URL https://climate-laws.org/document/energy-efficiency-act-enefg_d64e
2023
-
[74]
FOIA Friday: Professor, students find NDAs between localities and data cen- ter companies
Virginia Mercury. FOIA Friday: Professor, students find NDAs between localities and data cen- ter companies. Virginia Mercury, 2024. URL https://virginiamercury.com/2024/10/25/foia-friday- professor-students-find-ndas-with-data-center-companies-localities-say-theyre-used-often/
2024
-
[75]
SC county sued over its Google data center water-use secrecy
Joseph Bustos. SC county sued over its Google data center water-use secrecy. The Post and Courier, 2024. URL https://www.postandcourier.com/business/dorchester-google-data-center-foia- lawsuit-water-charleston/article_13536bb8-fe45-11ee-8e2c-ab63a46ae251.html
2024
-
[76]
Lawsuit seeks to force release of projected water use by Microsoft data centers
Wisconsin Public Radio. Lawsuit seeks to force release of projected water use by Microsoft data centers. Wisconsin Public Radio, 2025. URL https://www.wpr.org/news/microsoft-data-centers- lawsuit-force-release-projected-water-use
2025
-
[77]
Microsoft water and sewer infrastructure agreement
Town of Leesburg, Virginia. Microsoft water and sewer infrastructure agreement. Capital Projects, Town of Leesburg, 2024. URL https://www.leesburgva.gov/departments/capital-projects/current- projects/utilities-projects/microsoft-water-and-sewer
2024
-
[78]
Louisiana data center investment announcement: $400M water infrastructure
Amazon News. Louisiana data center investment announcement: $400M water infrastructure. PressRelease,2026. URLhttps://www.aboutamazon.com/news/company-news/amazon-data-center- louisiana-new-jobs. 43
2026
-
[79]
Tackling the trillion-gallon problem: Water loss reduction ini- tiatives benefit utilities and consumers alike
Megan Bondar. Tackling the trillion-gallon problem: Water loss reduction ini- tiatives benefit utilities and consumers alike. Bluefield Research, December 2025. URL https://www.bluefieldresearch.com/tackling-the-trillion-gallon-problem-water-loss-reduction- initiatives-benefit-utilities-and-consumers-alike/
2025
-
[80]
H. Jun and S. Jung. Exploration of deep learning leak detection model across multiple smart water distribution systems.Water Resources Management, 39(4):1234–1253, 2025. doi:10.1007/s11269- 025-04272-w
discussion (0)
Sign in with ORCID, Apple, or X to comment. Anyone can read and Pith papers without signing in.