REVIEW 3 major objections 5 minor 1 cited by
The Milky Way's bulge formed in two episodes: an almost instantaneous early collapse that made ~60% of its stars, then a delayed gas infall around 9 Gyr ago that made the rest.
Reviewed by Pith at T0; open to challenge. T0 means a machine referee read the full paper against a public rubric. the ladder, T0–T4 →
T0 review · deepseek-v4-flash
2026-08-03 17:47 UTC pith:K7Q2URNZ
load-bearing objection A well-executed, honest parameter search, but the claim that a second infall is 'chemically required' rests on a model contrast the paper never actually runs. the 3 major comments →
The Two-infall Model Revisited: Constraints on Milky Way Bulge Assembly from >30,000 Galactic Chemical Evolution Models and Machine Learning
The pith
A machine-rendered reading of the paper's core claim, the machinery that carries it, and where it could break.
Core claim
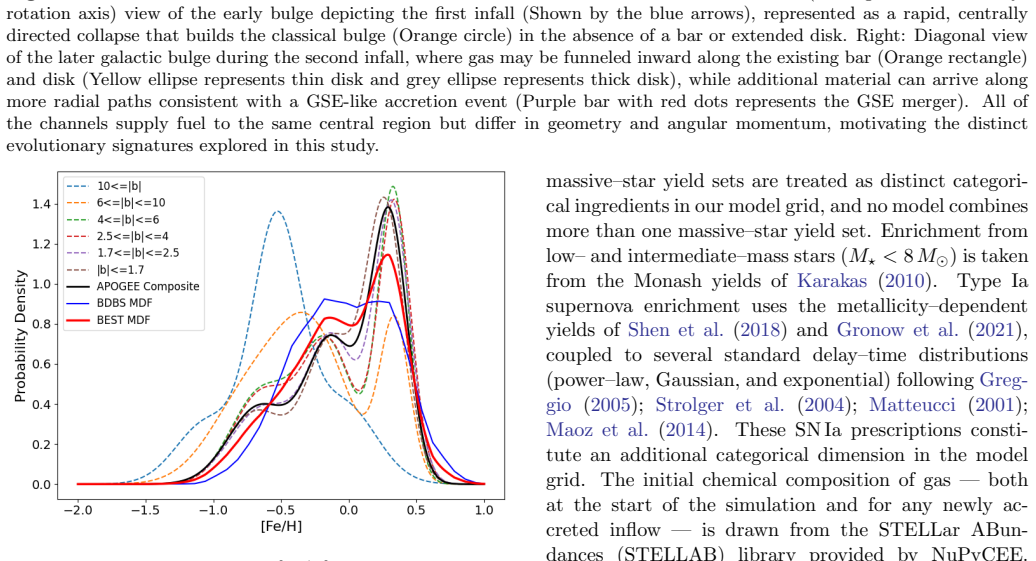
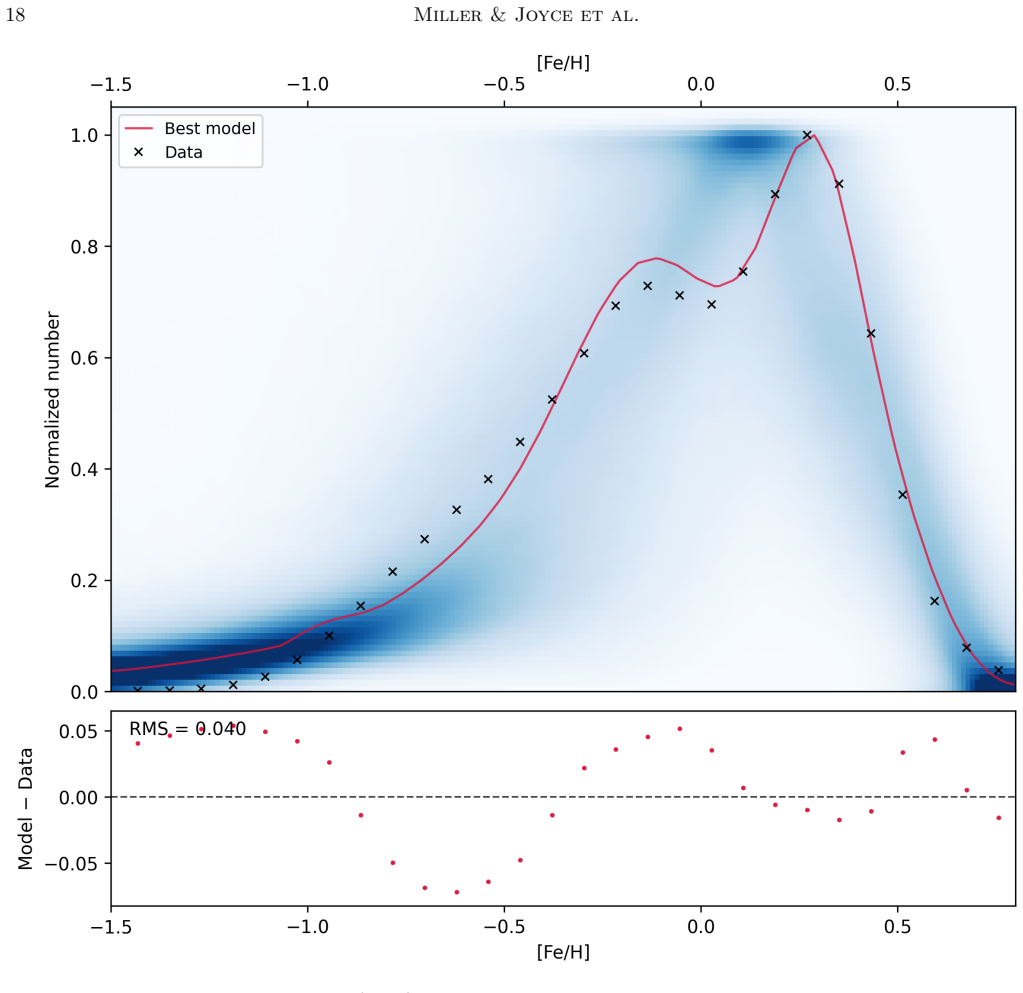
The paper's central claim is that the Milky Way bulge's chemical patterns—a bimodal metallicity distribution with peaks near [Fe/H] ≈ −0.3 and +0.3, and an alpha-to-iron decline at high metallicity—are reproduced only when gas falls into the bulge in two episodes governed by a two-exponential infall law. The maximum-a-posteriori solution places the first infall at t1 ≈ 0.1 Gyr with timescale τ1 ≈ 0.09 Gyr and star-formation efficiency ≈ 2.9 Gyr⁻¹, building about 60% of the mass; the second infall begins at t2 ≈ 5.1 Gyr, lasts τ2 ≈ 1.7 Gyr, carries about 40% of the mass, and runs at roughly 28% lower efficiency. The later episode is presented not as an option but as a chemical necessity: with
What carries the argument
The workhorse is a one-zone galactic chemical evolution model with a time-dependent star-formation efficiency and a two-component exponential infall history. The first mode, a rapid high-efficiency collapse, builds the old alpha-enhanced population; the second mode, a delayed lower-efficiency inflow, dilutes the interstellar medium and lets Type Ia supernovae add iron, producing the metal-rich, low-alpha sequence. The parameter space—infall onset times and timescales, mass ratio between episodes, star-formation efficiencies, IMF upper mass, and supernova Ia normalization, plus categorical yield and IMF choices—is explored with a hybrid genetic algorithm refined by differential-evolution MCMC
Load-bearing premise
The load-bearing premise is that the hand-built composite metallicity distribution—equal-weight averaging of two surveys with different selection effects and a fitted latitude scaling—faithfully represents the bulge's true MDF; if that target is biased, every inferred infall parameter shifts.
What would settle it
Rebuild the composite MDF target using only one survey at a time, or with a different latitude weighting, and rerun the optimization: if the MAP values for t2, τ2, σ2, and ΔSFE move outside the quoted 68% highest-density intervals, the inferred two-infall history is an artifact of target construction.
If this is right
- If correct, the old alpha-enhanced bulge population formed within roughly the first 0.2 Gyr of cosmic history—an extreme early starburst that set the chemical baseline.
- The second infall adds a younger, roughly 40%-mass component around 8–9 Gyr ago; its reduced efficiency is what creates the metal-rich peak and the downturn in alpha/Fe.
- The bulge's age–metallicity relation implied by reproducing the MDF favors a revised, older age scale for super-solar-metallicity bulge dwarfs over the original younger ages.
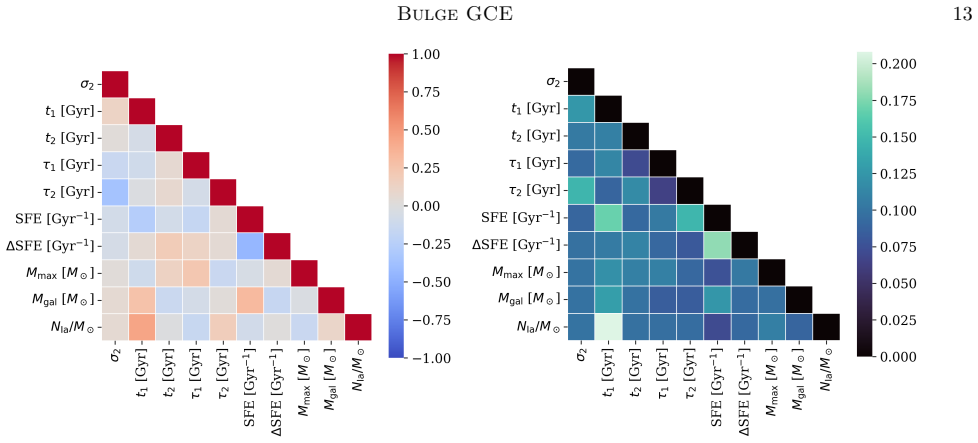
- Because infall timing, mass ratio, and efficiency are strongly covariant, current MDF data constrain only combinations of parameters, not each individually; the existence of a second episode is the robust part.
- The second infall epoch overlaps both the last major merger and the era of bar formation, so bulge chemistry alone cannot yet distinguish merger-fed from bar-driven late gas supply.
Where Pith is reading between the lines
- Editorial extension: the composite target MDF is an equal 50/50 blend of two surveys with different selection functions; re-running the fit under alternative weightings could shift the MAP values for t2, τ2, and ΔSFE substantially, since no sensitivity analysis is presented.
- Editorial extension: if reduced second-infall efficiency is the real cause of the low-alpha metal-rich population, spatially resolved multi-zone models should predict a correlation between alpha and vertical metallicity gradients—something the single-zone approach cannot capture.
- Editorial extension: upcoming large asteroseismic samples in the bulge could test the age-scale choice directly; if the younger ages for metal-rich bulge stars survive, the model's preferred age–metallicity relation would be overturned.
- Editorial extension: the degeneracy analysis suggests a single observable, such as the height of the super-solar MDF peak or the position of the alpha knee, may be nearly sufficient to certify a second infall; a simple test is to fit single-infall models to each [alpha/Fe] sequence and check whether any can reproduce the downturn.
Editorial analysis
A structured set of objections, weighed in public.
Referee Report
Summary. The paper presents a two-infall galactic chemical evolution model of the Milky Way bulge, implemented in an extension of OMEGA+ ("OMEGA++"), and constrains its parameters by fitting a composite MDF assembled from APOGEE DR16 and BDBS data. The optimization uses a hybrid genetic algorithm with DEMC refinement over a 15-dimensional space (10 continuous, 5 categorical), and the resulting weighted ensemble is treated as a pseudo-posterior. The headline results are an early rapid first infall (t1≈0.1 Gyr, τ1≈0.09 Gyr, SFE≈2.9 Gyr−1) that forms ~60% of the bulge mass, followed by a delayed second infall (t2≈5.1 Gyr, τ2≈1.7 Gyr, σ2≈0.69) with reduced SFE, which the authors claim is chemically required to reproduce the metal-rich MDF peak and low-[α/Fe] population. The model's AMR is then compared to observations, favoring the Joyce et al. (2023) age scale over Bensby et al. (2017). Independent MCMC runs for each categorical combination (Appendix A) are used to validate the GA sampler. The manuscript is honest about its pseudo-posterior nature and lists several modeling limitations, but it does not perform a nested single-infall comparison and the composite MDF target is constructed without sensitivity analysis.
Significance. If the central claims hold, the paper would provide a quantitative, observationally constrained picture of bulge assembly with an early rapid collapse and a delayed, sub-dominant second gas infall—relevant to classical versus secular bulge formation debates. The work's main strengths are the unusually wide parameter search, the explicit cross-validation of the GA+DEMC sampler against 288 independent MCMC runs (Appendix A), the transparent treatment of degeneracies via PCA and mutual information, and the out-of-sample use of the AMR rather than fitting it directly. However, the central qualitative claim that a second infall is 'chemically required' is not supported by a nested model test, and the quantitative MAP/HDI values rest entirely on a hand-assembled composite MDF target whose construction is not stress-tested. These issues currently limit the paper's conclusions to conditional on unexamined assumptions.
major comments (3)
- [§5.4.2 / §6] The headline claim that a non-zero second infall is 'chemically required' is not demonstrated by any nested model comparison. Table 1 samples σ2 only over 0.1–10.0, so σ2 = 0 is outside the explored prior. The statement in §5.4.2 that 'models with strictly negligible second infall fail' is unsupported by a figure, loss comparison, or likelihood-ratio test. Moreover, the time-dependent ΔSFE parameter can produce late-time SN Ia enrichment and a declining [α/Fe] track even with zero second infall gas (A2=0 in Eq. 2). Thus the data may require two star-formation phases, but not necessarily two gas infalls. Please add a single-infall (or σ2→0) control model and compare its best ensemble loss and MDF/AMR residuals; if such a model cannot fit, show that explicitly. Otherwise, soften the claim to 'two enrichment phases' rather than 'two infalls.'
- [§2, Eq. (1)] The composite MDF target is the only optimization target, yet its construction is not tested for robustness. The latitude scaling N/N0 = 1.029 e^{0.476 b} is fitted to Zoccali et al. (2018) and applied to APOGEE latitude fits, then combined 50/50 by equal weight with the BDBS red-clump MDF. The paper itself notes that BDBS appears less bimodal than APOGEE, so the equal-weight choice is substantive. The MAP/HDI values in Table 2 (σ2≈0.69, t2≈5.15 Gyr, ΔSFE≈0.72) are all derived from this specific target. Please provide a sensitivity analysis: re-run the optimization (or re-weight the existing model ensemble) under alternative weightings (e.g., 30/70, 70/30) or with the BDBS-only and APOGEE-only targets. If t2, σ2, and ΔSFE are stable, report this; if they shift, quantify the shift and adjust the conclusions accordingly.
- [§3.5 / §4] The pseudo-posterior weights are computed from an uncalibrated ensemble loss L_ensemble = 0.7 L_WRMSE + 0.2 L_cosine + 0.1 L_Huber, with no noise model for the MDF bins. Consequently, the 68% HDI values in Table 2 are not calibrated posterior intervals in a statistical sense—they depend on arbitrary loss weights and bin choices. Since the paper repeatedly uses these intervals to assert constraints (e.g., 't1 is notably more constrained,' 'σ2 is not well constrained'), the absence of a noise model is load-bearing. Please either (a) formulate a likelihood (e.g., Poisson or Gaussian per bin with the published/estimated uncertainties) and re-derive the posterior, or (b) at minimum, demonstrate that the MAP/HDI conclusions are stable under sensible variations of the loss weights and binning (e.g., 0.6/0.3/0.1, 0.8/0.1/0.1, and varied bin widths). This would also make the 'cannot fit' statemen
minor comments (5)
- [Throughout] Notation is inconsistent: the onset of the second infall is called t2 in Table 1 and the text, but tmax,2 in Eq. (2). Please unify. Also, the parameter ΔSFE is written as both 'ΔSFE' and 'δ SFE' in §5.3 and §5.4.4; pick one.
- [Abstract / §5.1] The abstract states '>30,000 GCE models', but Table 5 in Appendix A reports 262,144 GA+DEMC model evaluations (and 9,437,184 MCMC evaluations). The count in the abstract appears inconsistent with the total; please clarify what the 30,000 refers to (e.g., unique posterior-weighted models after filtering).
- [References] Reference typos: 'Truemam et al. 2025' in §5.2 should be 'Trueman', and the reference list contains both 'Truemam' and 'Trueman' entries; similarly, 'Cˆot´e et al.' appears with inconsistent accents. Also, the software list includes 'ChatGPT, Gemini'—if these were used in manuscript preparation, this is acceptable, but (i) for reproducibility, specify their role (e.g., text editing vs code generation), and (ii) consider whether journal policy requires this disclosure.
- [Figure 11 caption] The caption says 'one for each unique choice of categorical model ingredients Table 1)'—a closing parenthesis is missing. Also, the HDI annotations in Figures 3 and 11 are hard to read at the plotted scale; consider enlarging or tabulating the values.
- [§5.2 / Fig. 8] The Ti panel shows a systematic underprediction, which the paper attributes to yield uncertainties. Given that Ti is a known problem, it would help to state explicitly whether the model residuals for Ti are included in any quantitative goodness-of-fit metric, or whether the fit is driven entirely by the MDF (as implied by Eq. 7).
Circularity Check
No circular reduction; the central inference is an independent parameter fit with an out-of-sample AMR by-product.
full rationale
The paper's quantitative core is a fit of a two-infall GCE model to an observational composite MDF using an explicit ensemble loss (Eq. 7). The MAP/HDI values for t1, tau1, t2, tau2, sigma2, SFE, DeltaSFE, etc. are outputs of that fit, not inputs to it. The AMR comparison is explicitly stated to be a post-optimization by-product and is not used as an optimization target, so the preference for the Joyce et al. (2023) ages is an out-of-sample model output rather than a fitted quantity. The Johnson et al. (2022) MDF and Joyce et al. (2023) AMR are externally anchored observational/age data sets even though they share authors; self-citation overlap of this kind is bias evidence, not circularity. The main scientific caveat is that the claim that a second infall is 'chemically required' is not supported by a fitted single-infall baseline: Eq. 2 imposes a two-infall form and Table 1 samples sigma2 only over 0.1-10.0, so sigma2=0 is outside the explored prior, and no nested model comparison is shown. That is a model-comparison and inference-calibration gap, not a circular reduction of the kind where a prediction equals its input by construction. The paper also transparently acknowledges that its one-zone model cannot uniquely identify the number of infall episodes. Because no derivation step reduces to its own input or to an unverified self-citation, no circularity is established.
Axiom & Free-Parameter Ledger
free parameters (11)
- t1 (first infall onset) =
0.098 Gyr
- tau1 (first infall timescale) =
0.093 Gyr
- t2 (second infall onset) =
5.145 Gyr (HDI 3.25–8.45)
- tau2 (second infall timescale) =
1.74 Gyr (HDI 0.5–3.7)
- sigma2 (second/first infall mass ratio) =
0.69 (HDI 0.11–3.1)
- SFE (first-phase star formation efficiency) =
2.93 Gyr^-1 (bimodal; secondary peak ~25)
- dSFE (multiplicative SFE drop at t2) =
0.72 (HDI 0.39–0.85)
- Mmax (IMF upper mass cutoff) =
108.4 Msun
- MBulge (final stellar mass normalization) =
1.01e10 Msun
- NIa/Msun (SN Ia normalization) =
5.8e-4
- Loss weight coefficients (0.7/0.2/0.1) =
0.7, 0.2, 0.1
axioms (8)
- domain assumption Bulge is a single well-mixed gas reservoir with instantaneous mixing
- domain assumption Inflow-only evolution, no outflows
- ad hoc to paper Gas infall rate has the two-exponential form of Eq. 2
- domain assumption Infalling and initial gas is pre-enriched according to the STELLAB library
- ad hoc to paper Composite MDF target defined by Eq. 1 latitude scaling and 50/50 equal weighting of APOGEE and BDBS
- domain assumption Nucleosynthetic yield grids (LC18, Karakas, Nomoto, Shen, Gronow) and SN Ia delay-time distributions are correct
- ad hoc to paper Final-mass window 5e9 < Mfinal < 3e10 Msun used as a model filter
- domain assumption IMF family spans the true bulge IMF
Cite this review
Pith. "Pith review of The Two-infall Model Revisited: Constraints on Milky Way Bulge Assembly from >30,000 Galactic Chemical Evolution Models and Machine Learning." pith.science (2026). https://pith.science/paper/K7Q2URNZ
@misc{pith2026251208090,
  author       = {Pith},
  title        = {Pith review of: The Two-infall Model Revisited: Constraints on Milky Way Bulge Assembly from >30,000 Galactic Chemical Evolution Models and Machine Learning},
  year         = {2026},
  howpublished = {\url{https://pith.science/paper/K7Q2URNZ}},
  note         = {Machine review of arXiv:2512.08090}
}
read the original abstract
We constrain the formation history of the Milky Way bulge using a two-infall galactic chemical evolution (GCE) algorithm implemented in the N'OMEGA+ code. We recover a best-fit scenario in which the bulge forms through an early, rapid starburst ($t_1 \sim 0.1$ Gyr, $\tau_1 \sim 0.09$ Gyr, and star formation efficiency (SFE) $\sim 3~\mathrm{Gyr}^{-1}$), followed by a delayed, lower-mass second infall ($t_2 \sim 5.1$ Gyr, $\tau_2 \sim 1.7$ Gyr, and $\sigma_2 \sim 0.69$). Our model adopts mass- and metallicity-dependent nucleosynthetic yields from modern stellar grids and explores a wide GCE parameter space in infall timing, SFE, mass partitioning, initial mass function upper mass, and type Ia supernova normalization, optimized via a hybrid genetic algorithm with Markov Chain Monte Carlo refinement. The later infall features a reduced SFE ($\Delta\mathrm{SFE} \sim 0.72$), reproducing the metal-rich peak of the bulge metallicity distribution function (MDF) and the decline in [$\alpha$/Fe] at high [Fe/H]. Our model naturally favors the M. Joyce et al. age--metallicity relation over the ages in T. Bensby et al. Degeneracy and principal component analyses show that the infall history, SFE, and mass partitioning are strongly covariant---the bulge's observed MDF, abundance trends, and age distribution constrain only their combinations, not each parameter independently. The results support a composite bulge origin---an early, rapid collapse builds the majority of the mass, while a younger component is required to match the late-stage enrichment.
Figures






Forward citations
Cited by 1 Pith paper
-
Evaluating the Sensitivity of the Age Inferences of Red Giant Stars to Machine Learning Methodology
Ages inferred for red giant stars via machine learning are generally insensitive to hyperparameters and architecture but somewhat sensitive to training set choice, especially for the oldest, coolest, and lowest-metall...
Reference graph
Works this paper leans on
-
[1]
, " * write output.state after.block = add.period write newline
ENTRY address archivePrefix author booktitle chapter doi edition editor eprint howpublished institution journal key month number organization pages publisher school series title misctitle type volume year version url label extra.label sort.label short.list INTEGERS output.state before.all mid.sentence after.sentence after.block FUNCTION init.state.consts ...
-
[2]
write newline
" write newline "" before.all 'output.state := FUNCTION format.url url empty "" new.block "" url * "" * if FUNCTION format.eprint eprint empty "" archivePrefix empty "" archivePrefix "arXiv" = new.block " " eprint * " " * new.block " " eprint * " " * if if if FUNCTION format.doi doi empty "" " " doi * " " * if FUNCTION format.pid doi empty eprint empty ur...
-
[3]
Uncertainties in Galactic Chemical Evolution Models
thebibliography [1] 20pt to REFERENCES 6pt =0pt \@twocolumntrue 12pt -12pt 10pt plus 3pt =0pt =0pt =1pt plus 1pt =0pt =0pt -12pt =13pt plus 1pt =20pt =13pt plus 1pt \@M =10000 =-1.0em =0pt =0pt 0pt =0pt =1.0em @enumiv\@empty 10000 10000 `\.\@m \@noitemerr \@latex@warning Empty `thebibliography' environment \@ifnextchar \@reference \@latexerr Missing key o...
Pith/arXiv arXiv 2017
-
[4]
Abadi , M. G., Navarro , J. F., Steinmetz , M., & Eke , V. R. 2003 a , , 591, 499, 10.1086/375512
doi:10.1086/375512 2003
- [5]
-
[6]
Arentsen , A., Starkenburg , E., Martin , N. F., et al. 2020, , 491, L11, 10.1093/mnrasl/slz156
-
[8]
2010, Astronomy and Astrophysics, 519, A77, 10.1051/0004-6361/201014353
Babusiaux , C., G \'o mez , A., Hill , V., et al. 2010, Astronomy and Astrophysics, 519, A77, 10.1051/0004-6361/201014353
-
[9]
K., Matteucci , F., Origlia , L., & Rich , R
Ballero , S. K., Matteucci , F., Origlia , L., & Rich , R. M. 2007, , 467, 123, 10.1051/0004-6361:20066596
-
[11]
2018 b , , 56, 223, 10.1146/annurev-astro-081817-051826
---. 2018 b , , 56, 223, 10.1146/annurev-astro-081817-051826
-
[12]
2019, , 489, 1082, 10.1093/mnras/stz2158
Battino , U., Tattersall , A., Lederer-Woods , C., et al. 2019, , 489, 1082, 10.1093/mnras/stz2158
-
[13]
Baugh , C. M., Cole , S., & Frenk , C. S. 1996, , 283, 1361, 10.1093/mnras/283.4.1361
-
[14]
Belokurov, V., Erkal, D., Evans, N. W., Koposov, S. E., & Deason, A. J. 2018, Monthly Notices of the Royal Astronomical Society, 478, 611, 10.1093/mnras/sty982
-
[15]
2011, Astronomy and Astrophysics, 533, A134, 10.1051/0004-6361/201117059
Bensby , T., Ad \'e n , D., Mel \'e ndez , J., et al. 2011, Astronomy and Astrophysics, 533, A134, 10.1051/0004-6361/201117059
-
[16]
2017, , 605, A89, 10.1051/0004-6361/201730560
Bensby , T., Feltzing , S., Gould , A., et al. 2017, , 605, A89, 10.1051/0004-6361/201730560
-
[17]
2008, The Astronomical Journal, 136, 2846, 10.1088/0004-6256/136/6/2846
Bigiel, F., Leroy, A., Walter, F., et al. 2008, The Astronomical Journal, 136, 2846, 10.1088/0004-6256/136/6/2846
-
[18]
Binney, J., Gerhard, O. E., Stark, A. A., Bally, J., & Uchida, K. I. 1991, Monthly Notices of the Royal Astronomical Society, 252, 210, 10.1093/mnras/252.2.210
-
[19]
2002, Monthly Notices of the Royal Astronomical Society, 330, 591, 10.1046/j.1365-8711.2002.05116.x
Bissantz, N., & Gerhard, O. 2002, Monthly Notices of the Royal Astronomical Society, 330, 591, 10.1046/j.1365-8711.2002.05116.x
arXiv 2002
-
[20]
Braak, C. J. T. 2006, Statistics and Computing, 16, 239
2006
-
[21]
Calamida , A., Sahu , K. C., Casertano , S., et al. 2015, , 810, 8, 10.1088/0004-637X/810/1/8
-
[22]
Cescutti , G., Chiappini , C., & Hirschi , R. 2018, in IAU Symposium, Vol. 334, Rediscovering Our Galaxy, ed. C. Chiappini , I. Minchev , E. Starkenburg , & M. Valentini , 94--97, 10.1017/S1743921317008183
-
[23]
2003, , 115, 763, 10.1086/376392
Chabrier , G. 2003, , 115, 763, 10.1086/376392
doi:10.1086/376392 2003
-
[24]
Chaplin , W. J., Serenelli , A. M., Miglio , A., et al. 2020, Nature Astronomy, 4, 382, 10.1038/s41550-019-0975-9
-
[25]
2022, The Astrophysical Journal, 934, 28, 10.3847/1538-4357/ac795c
Chen, B.-H., & Li, Z.-Y. 2022, The Astrophysical Journal, 934, 28, 10.3847/1538-4357/ac795c
-
[26]
2001, , 554, 1044, 10.1086/321427
Chiappini , C., Matteucci , F., & Romano , D. 2001, , 554, 1044, 10.1086/321427
doi:10.1086/321427 2001
-
[27]
2003, , 339, 63, 10.1046/j.1365-8711.2003.06154.x
Chiappini , C., Romano , D., & Matteucci , F. 2003, , 339, 63, 10.1046/j.1365-8711.2003.06154.x
arXiv 2003
-
[28]
2013, The Astrophysical Journal, 764, 21, 10.1088/0004-637X/764/1/21
Chieffi, A., & Limongi, M. 2013, The Astrophysical Journal, 764, 21, 10.1088/0004-637X/764/1/21
-
[29]
C., Fragkoudi , F., Khoperskov , S., Di Matteo , P., & Combes , F
Ciambur , B. C., Fragkoudi , F., Khoperskov , S., Di Matteo , P., & Combes , F. 2021, , 503, 2203, 10.1093/mnras/staa3814
-
[30]
1990, , 233, 82
Combes , F., Debbasch , F., Friedli , D., & Pfenniger , D. 1990, , 233, 82
1990
-
[31]
C \^o t \'e , B., Ritter , C., O'Shea , B. W., et al. 2016, , 824, 82, 10.3847/0004-637X/824/2/82
-
[32]
Côté, B., Silvia, D. W., O’Shea, B. W., Smith, B., & Wise, J. H. 2018, The Astrophysical Journal, 859, 67, 10.3847/1538-4357/aabe8f
-
[33]
2019, The Astrophysical Journal, 887, 213, 10.3847/1538-4357/ab5a88
Côté, B., Yagüe, A., Világos, B., & Lugaro, M. 2019, The Astrophysical Journal, 887, 213, 10.3847/1538-4357/ab5a88
-
[34]
Dubay , L. O., Johnson , J. A., Johnson , J. W., & Roberts , J. D. 2025, arXiv e-prints, arXiv:2508.00988, 10.48550/arXiv.2508.00988
-
[36]
1999 b , , 517, 103, 10.1086/307200
---. 1999 b , , 517, 103, 10.1086/307200
-
[37]
2015, , 454, 3641, 10.1093/mnras/stv2247
Fanali , R., Dotti , M., Fiacconi , D., & Haardt , F. 2015, , 454, 3641, 10.1093/mnras/stv2247
-
[38]
Feuillet , D. K., Sahlholdt , C. L., Feltzing , S., & Casagrande , L. 2021, , 508, 1489, 10.1093/mnras/stab2614
-
[39]
Figer , D. F. 2005, , 434, 192, 10.1038/nature03293
-
[40]
2012, Journal of Machine Learning Research, 13, 2171
Fortin, F.-A., De Rainville , F.-M., Gardner, M.-A., Parizeau, M., & Gagn\'e, C. 2012, Journal of Machine Learning Research, 13, 2171
2012
-
[41]
Fragkoudi , F., Grand , R. J. J., Pakmor , R., et al. 2020, , 494, 5936, 10.1093/mnras/staa1104
-
[42]
2020, , 499, 1116, 10.1093/mnras/staa2866
Fraser-McKelvie , A., Merrifield , M., Arag \'o n-Salamanca , A., et al. 2020, , 499, 1116, 10.1093/mnras/staa2866
-
[43]
1998, , 338, 161
Fuhrmann , K. 1998, , 338, 161
1998
-
[44]
Gaudi , B. S. 2022, in Bulletin of the American Astronomical Society, Vol. 54, 102.146
2022
-
[45]
2023, in American Astronomical Society Meeting Abstracts, Vol
Ghosh-Coutinho , I., Dorn-Wallenstein , T., Levesque , E., & Davenport , J. 2023, in American Astronomical Society Meeting Abstracts, Vol. 241, American Astronomical Society Meeting Abstracts \#241, 401.31
2023
-
[46]
2012, The Messenger, 147, 25
Gilmore , G., Randich , S., Asplund , M., et al. 2012, The Messenger, 147, 25
2012
-
[47]
A., Rejkuba , M., Zoccali , M., et al
Gonzalez , O. A., Rejkuba , M., Zoccali , M., et al. 2013, , 552, A110, 10.1051/0004-6361/201220842
-
[48]
2011, Astronomy and Astrophysics, 530, A54, 10.1051/0004-6361/201116548
---. 2011, Astronomy and Astrophysics, 530, A54, 10.1051/0004-6361/201116548
-
[49]
LSST Cadence Optimization White Paper: The Definitive Map of the Galactic bulge
Gonzalez , O. A., Clarkson , W., Debattista , V. P., et al. 2018, arXiv e-prints, arXiv:1812.08670, 10.48550/arXiv.1812.08670
work page internal anchor Pith review Pith/arXiv arXiv doi:10.48550/arxiv.1812.08670 2018
-
[50]
Green, P. J. 1995, Biometrika, 82, 711. http://www.jstor.org/stable/2337340
arXiv 1995
-
[51]
2005, , 441, 1055, 10.1051/0004-6361:20052926
Greggio , L. 2005, , 441, 1055, 10.1051/0004-6361:20052926
-
[52]
2012, , 548, A60, 10.1051/0004-6361/201219761
Grieco , V., Matteucci , F., Pipino , A., & Cescutti , G. 2012, , 548, A60, 10.1051/0004-6361/201219761
-
[53]
Griffith , E., Weinberg , D. H., Johnson , J. A., et al. 2021, , 909, 77, 10.3847/1538-4357/abd6be
-
[54]
2021, , 656, A94, 10.1051/0004-6361/202140881
Gronow , S., C \^o t \'e , B., Lach , F., et al. 2021, , 656, A94, 10.1051/0004-6361/202140881
-
[55]
Hayden, M. R., Bovy, J., Holtzman, J. A., et al. 2015, The Astrophysical Journal, 808, 132, 10.1088/0004-637X/808/2/132
-
[56]
2011, Astronomy and Astrophysics, 534, A80, 10.1051/0004-6361/200913757
Hill , V., Lecureur , A., G \'o mez , A., et al. 2011, Astronomy and Astrophysics, 534, A80, 10.1051/0004-6361/200913757
-
[57]
Asteroseismology with the Roman Galactic Bulge Time-Domain Survey
Huber , D., Pinsonneault , M., Beck , P., et al. 2023, arXiv e-prints, arXiv:2307.03237, 10.48550/arXiv.2307.03237
work page internal anchor Pith review Pith/arXiv arXiv doi:10.48550/arxiv.2307.03237 2023
-
[58]
Jacquier , V., Cirillo , E. N. M., & Spitoni , C. 2024, arXiv e-prints, arXiv:2405.09198, 10.48550/arXiv.2405.09198
work page internal anchor Pith review Pith/arXiv arXiv doi:10.48550/arxiv.2405.09198 2024
-
[59]
Johnson , C. I., Rich , R. M., Kobayashi , C., et al. 2013, The Astrophysical Journal, 765, 157, 10.1088/0004-637X/765/2/157
-
[60]
Johnson , C. I., Rich , R. M., Simion , I. T., et al. 2022, , 515, 1469, 10.1093/mnras/stac1840
-
[61]
Joyce, M., Johnson, C. I., Marchetti, T., et al. 2023, The Astrophysical Journal, 946, 28, 10.3847/1538-4357/acb692
-
[63]
D., Pignatari, M., Stancliffe, R
Keegans, J. D., Pignatari, M., Stancliffe, R. J., et al. 2023, The Astrophysical Journal Supplement Series, 268, 8, 10.3847/1538-4365/ace102
-
[64]
Kennicutt , Jr., R. C., & De Los Reyes , M. A. C. 2021, , 908, 61, 10.3847/1538-4357/abd3a2
-
[65]
Kim , Y. K., Lee , Y. S., Beers , T. C., & Koo , J.-R. 2021, , 911, L21, 10.3847/2041-8213/abf35e
-
[66]
Kobayashi , C., Karakas , A. I., & Lugaro , M. 2020, , 900, 179, 10.3847/1538-4357/abae65
-
[67]
Kobayashi , C., Karakas , A. I., & Umeda , H. 2011, , 414, 3231, 10.1111/j.1365-2966.2011.18621.x
arXiv 2011
-
[68]
2020, , 643, A69, 10.1051/0004-6361/202038686
Kordopatis , G., Recio-Blanco , A., Schultheis , M., & Hill , V. 2020, , 643, A69, 10.1051/0004-6361/202038686
-
[69]
2001, , 322, 231, 10.1046/j.1365-8711.2001.04022.x
Kroupa , P. 2001, , 322, 231, 10.1046/j.1365-8711.2001.04022.x
arXiv 2001
-
[70]
2015, , 580, A126, 10.1051/0004-6361/201424171
Kubryk , M., Prantzos , N., & Athanassoula , E. 2015, , 580, A126, 10.1051/0004-6361/201424171
-
[71]
Kunder , A., Koch , A., Rich , R. M., et al. 2012, The Astronomical Journal, 143, 57, 10.1088/0004-6256/143/3/57
-
[72]
Kunder , A., Rich , R. M., Koch , A., et al. 2016, The Astrophysical Journal, 821, L25, 10.3847/2041-8205/821/2/L25
-
[73]
Lane , J. M. M., Bovy , J., & Mackereth , J. T. 2023, , 526, 1209, 10.1093/mnras/stad2834
-
[74]
K., Walter , F., Sandstrom , K., et al
Leroy , A. K., Walter , F., Sandstrom , K., et al. 2013, , 146, 19, 10.1088/0004-6256/146/2/19
-
[75]
2020, , 497, 3557, 10.1093/mnras/staa2205
Lian , J., Zasowski , G., Hasselquist , S., et al. 2020, , 497, 3557, 10.1093/mnras/staa2205
-
[76]
Licquia , T. C., & Newman , J. A. 2015, , 806, 96, 10.1088/0004-637X/806/1/96
-
[77]
2018, , 237, 13, 10.3847/1538-4365/aacb24
Limongi , M., & Chieffi , A. 2018, , 237, 13, 10.3847/1538-4365/aacb24
-
[78]
2024, , 976, 161, 10.3847/1538-4357/ad8352
Liu , H., Du , C., Ye , D., Zhang , J., & Deng , M. 2024, , 976, 161, 10.3847/1538-4357/ad8352
-
[79]
L \'o pez-Corredoira , M., Cabrera-Lavers , A., & Gerhard , O. E. 2005, , 439, 107, 10.1051/0004-6361:20053075
-
[80]
Lucey, M., Sanderson, R. E., Horta, D., et al. 2025, The Astrophysical Journal, 982, 87, 10.3847/1538-4357/adb9e8
-
[81]
Majewski , S. R., Schiavon , R. P., Frinchaboy , P. M., et al. 2017, The Astronomical Journal, 154, 94, 10.3847/1538-3881/aa784d
-
[82]
2014, , 52, 107, 10.1146/annurev-astro-082812-141031
Maoz , D., Mannucci , F., & Nelemans , G. 2014, , 52, 107, 10.1146/annurev-astro-082812-141031
-
[83]
Marchetti , T., Joyce , M., Johnson , C. I., et al. 2024, , 682, A96, 10.1051/0004-6361/202347570
-
[84]
2001, The chemical evolution of the Galaxy , Vol
Matteucci , F. 2001, The chemical evolution of the Galaxy , Vol. 253, 10.1007/978-94-010-0967-6
discussion (0)
Sign in with ORCID, Apple, or X to comment. Anyone can read and Pith papers without signing in.