REVIEW 4 major objections 4 minor 28 references
Predicted disease compositions of human gliomas estimated from multiparametric MRI can predict endothelial proliferation, tumor grade, and overall survival
T0 review · 4 major / 4 minor · reviewed 2026-08-14 · deepseek-v4-flash
Pith's one-line read Voxel-wise MRI disease compositions predict glioma grade, endothelial proliferation, and overall survival.
desk verdict The PDC idea is worth a look, but the voxel-level train/test split makes the predictive claims unsubstantiated; the authors admit the leakage themselves. read the letter →
The pith
A machine-rendered reading of the paper's core claim, the machinery that carries it, and where it could break.
The reading
What carries the argument
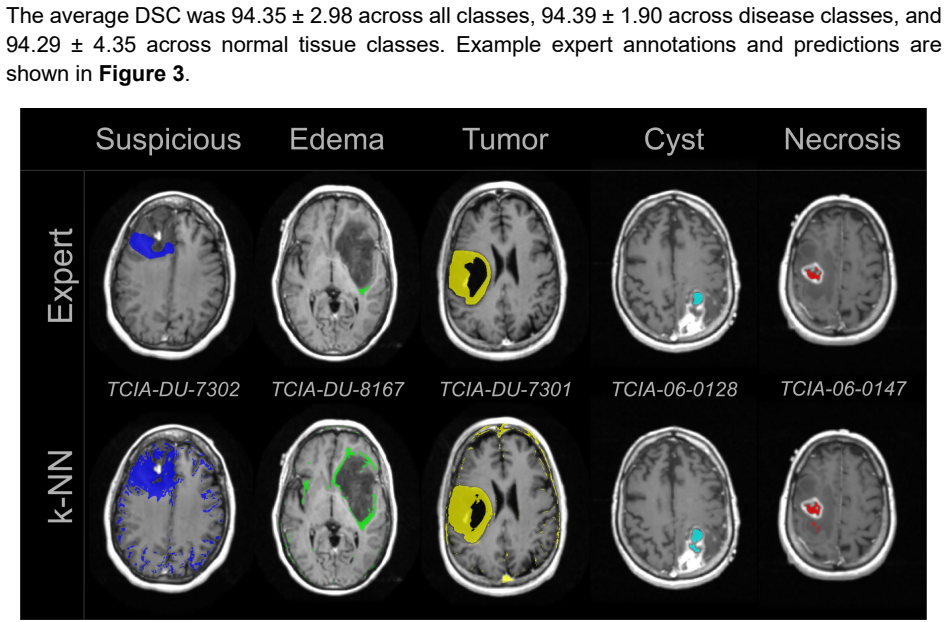
Predicted disease composition (PDC) is the central object: the per-slice percentage of voxels assigned by the k-NN classifier to each of five disease categories—suspicious, edema, tumor, cyst, and necrosis. The k-NN classifier is the mechanism that generates it: ten neighbors, Euclidean distance, standardized features, trained on a random three-quarters of 611,930 expert-annotated voxels and tested on the remaining quarter, then applied to 13,018,171 voxels from seventeen patients. These composition percentages, combined with diagnostic age, serve as the independent variables in linear regression and canonical discriminant analysis, so the whole argument reduces to whether the PDC percentages carry outcome information.
What would settle it
Retrain the k-NN model with a strict patient-level split (train on some patients, test on the remaining patients) and recompute the Dice score and the overall-survival, grade, and endothelial-proliferation statistics; if the p-values rise above 0.05 or the Dice score drops substantially below the reported 94%, the reported predictions come from voxel leakage rather than a generalizable imaging biomarker.
Extended reading notes
Core claim
The paper's central claim is that a voxel-wise k-nearest-neighbor model, trained on expert annotations of five MRI contrasts (T1, T1-GD, T2, FLAIR, ADC), can label individual voxels as one of five disease classes or four normal-tissue classes, and that the resulting slice-level percentages—the predicted disease composition—are clinically informative. In the authors' cohort, %Tumor alone explained 27.9% of the variability in overall survival through the equation Predicted OS = 7.67 − 0.037(%Tumor), and discriminant models using PDC plus age separated lower-grade glioma from glioblastoma (76.5% accuracy, p = 0.014) and endothelial proliferation status (88.2% accuracy, p = 0.003). The model's voxel labels agreed with expert annotations at a Dice similarity coefficient of 94.35% ± 2.98. The authors conclude that PDC derived from multiparametric MRI can act as a non-invasive imaging biomarker for glioma grade, endothelial proliferation, and overall survival.
Load-bearing premise
The load-bearing premise is that a classifier trained on randomly selected voxels from the same patients—rather than on separate patients—produces disease-composition estimates that generalize to unseen patients, since neighboring voxels from the same tumor share nearly identical feature values.
Editorial extensions
If this is right
- Clinicians could estimate overall survival from the equation Predicted OS = 7.67 − 0.037(%Tumor) using only MRI, before any tissue is obtained.
- Non-invasive discrimination of lower-grade glioma from glioblastoma at 76.5% accuracy could guide decisions about whether to biopsy, resect, or treat empirically.
- The endothelial-proliferation model's 100% specificity suggests MRI-computed disease composition may identify highly angiogenic tumor zones that are the most informative biopsy targets.
- Since IDH1 and TP53BP1 mutation status were not significantly predicted, PDC is best interpreted as a macroscopic tissue-composition biomarker, not a molecular surrogate.
- A direct extension is to test whether PDC maps remain predictive across scanner manufacturers, field strengths, and multi-b-value DWI protocols, since the authors report their data varied on all of these.
Reading between the lines
- A stricter test of the central claim would be patient-level cross-validation: training the k-NN on some patients and testing on the rest, which would reveal how much of the reported accuracy comes from voxel leakage between neighboring train and test voxels.
- If PDC reflects biologically distinct tissue compartments, then serial MRI scans could track changes in %Tumor or %Necrosis over treatment; the paper's cross-sectional design does not test this.
- The near-significant mutation results (TP53BP1 p = 0.097, IDH1 p = 0.054) suggest that adding texture, shape, or perfusion features to the PDC vector could push molecular prediction over the significance threshold.
- Scanner harmonization of ADC maps may matter more than the other sequences, because DWI acquisition parameters varied most across patients and ADC was the only computed, rather than native, sequence.
Signed reviews
Editorial analysis
A structured set of objections, weighed in public.
Referee Report
Summary. The paper proposes a voxel-wise radiomics pipeline for glioma characterization: multiparametric MRI (T1, T1-GD, T2, FLAIR, ADC) is registered to T1-GD, expert annotations define nine tissue classes, a k-NN classifier is trained on 611,930 annotated voxels from 14 patients, and the classifier's predictions on 11 slices per patient yield Predicted Disease Compositions (PDC). These PDC are then used in linear regression and canonical discriminant analysis to predict overall survival, tumor grade, and endothelial proliferation in 17 patients. The paper reports a Dice similarity coefficient of 94.34% and significant p-values for OS (0.008), grade (0.014), and EP (0.003).
Significance. If the predictive claims were valid, the work would offer a non-invasive, voxel-resolved MRI method for assessing clinically important glioma features, with potential decision-support value. Strengths include the use of publicly available TCGA/TCIA data, a clinically grounded annotation scheme, and a clearly described machine-learning pipeline. However, the significance is currently contingent on a validation strategy that does not establish generalization to unseen patients; the voxel-level train/test split and in-sample outcome analyses substantially weaken the evidentiary value of the reported accuracies and p-values.
major comments (4)
- [Sections 2.5, 3.1, and 4] The k-NN classifier is trained and tested on voxels randomly split within the same 14 patients, with no patient-level separation (Section 2.5). Because neighboring voxels are spatially correlated and share patient-specific intensity distributions, the reported DSC of 94.34% largely reflects interpolation within the same scans, not classification performance on unseen patients. The authors acknowledge this risk in the Discussion ('a voxel neighboring a train voxel will be assigned to the test feature vector and could lead to over fitting'), but the abstract and conclusions still assert predictive accuracy. This is load-bearing: the PDC used in the outcome regressions (Section 3.2) and CDA are derived from the same patients, so the reported p-values (OS p=0.008, grade p=0.014, EP p=0.003) are not independent evidence of predictive utility. Patient-level cross-validation or a held-out patient cohort is required to support the central claim.
- [Abstract vs. Section 3.2] The abstract states that linear combinations of PDCs and diagnostic age predicted OS (p=0.008), but Section 3.2 (Linear Regression) reports only a univariate regression of %Tumor on OS (F(1,15)=7.186, p=0.017). No multivariate model including age is presented. Please clarify which analysis yields p=0.008, report the full model, and reconcile the discrepancy.
- [Section 3.2 and Table 5] The regression and canonical discriminant analyses are performed on the same 17 patients whose PDC were generated by the classifier, with no held-out validation or cross-validation for the outcome models. With only 10 LGG and 7 GBM patients, the reported classification accuracies (76.5%, 88.2%) and p-values are in-sample estimates and are likely optimistic. Please provide a validation scheme for the PDC-outcome associations (e.g., leave-one-patient-out for the full pipeline) or clearly label these results as exploratory.
- [Section 2.6] The authors state that linear regression is appropriate for OS because 'all cohort subjects experienced the same events.' This implies no censoring, but the paper does not explicitly confirm that all 17 patients had a recorded death event during follow-up. If any patient was censored, Cox proportional hazards regression or another survival analysis should be used. Please clarify the censoring status of all patients.
minor comments (4)
- [Section 3] There are two subsections numbered '3.2' (Linear Regression and Canonical Discriminant Analysis). The second should be renumbered (e.g., 3.3).
- [Table 2] The row 'Parameters constant across sequences: Field strength 2.90 ±0.39 [1.50, 3.00]' lists a mean of 2.90 T, which is not a standard MRI field strength (typical values are 1.5 or 3.0 T). This appears to be a typo or a miscalculation; please correct.
- [Figure 2] The caption states the model was tested using a '25% hold-out method.' Please specify that the hold-out was at the voxel level, not the patient level, to avoid ambiguity.
- [Section 2.5] The k-NN model parameters in Table 3 include prior probabilities that appear to sum to approximately 0.9996; please verify that rounding is intentional and that the priors are based on the training set class frequencies.
Circularity Check
Voxel-level train/test split without patient separation makes the PDC-based outcome predictions in-sample, not independent predictions.
-
fitted input called prediction
[Section 2.5 (k-NN Radiomics Algorithm); Section 3.1 (k-NN model accuracy)]
"Our model trained on a randomly selected three-fourths of the labeled observations (N = 458,948) and tested on the remaining one-fourth (N = 152,982)."
The hold-out set is composed of individual voxels drawn from the same 14 patients as the training voxels, not from held-out patients. Because neighboring voxels share spatial autocorrelation, registration, and patient-specific intensity normalization, the reported DSC of 94.34% and 97.0% accuracy reflect same-scan interpolation rather than prediction of a new patient's voxel classes. The PDCs used in all downstream outcome analyses are computed from these same-patient predictions, so the endpoint 'predicted disease compositions' is not independent of the patients whose outcomes are later fit. The authors acknowledge this: 'a voxel neighboring a train voxel will be assigned to the test feature vector and could lead to over fitting.'
-
fitted input called prediction
[Abstract; Section 3.2 (Linear Regression and CDA)]
"Linear combinations of PDCs and diagnostic age predicted OS (p = 0.008), grade (p = 0.014), and endothelia proliferation (p = 0.003)"
These p-values are computed by fitting linear regression and canonical discriminant analysis on the same 17 patients whose PDCs were generated by the classifier described in the previous step. There is no independent validation cohort and no patient-level cross-validation for the PDC-outcome models, so the reported 'predictions' are the in-sample fitted values of models estimated on the same subjects. The abstract's predictive claim is therefore supported only by in-sample fit, not by out-of-sample prediction.
full rationale
The central derivation chain is: expert voxel annotations -> k-NN classifier -> per-voxel class predictions -> PDC percentages -> regression and CDA against OS, grade, and endothelial proliferation. The first and last links are evaluated on the same patients. The k-NN model is trained on random voxels from 14 patients and tested on the remaining voxels of the same patients, so the DSC of 94.34% is not a patient-level generalization result. The PDC-outcome regressions are then fit to the same 17 patients, so the reported p-values (OS p=0.008, grade p=0.014, EP p=0.003) are in-sample associations. The paper itself acknowledges this limitation in the Discussion when it states that a test voxel neighboring a train voxel could lead to overfitting. This is not a definitional circularity: PDC is not defined in terms of OS, grade, or EP, and there is no load-bearing self-citation chain. Rather, the 'prediction' language reduces to a fitted in-sample model, which is the fitted-input-called-prediction pattern. A score of 6 is appropriate because the features (MRI intensities) and outcomes (histology and survival) are independent measurements; the circularity lies in the validation scheme and in labeling in-sample fits as predictions.
Assumptions & free parameters
free parameters (4)
- k (number of nearest neighbors) =
10
- Prior probabilities for k-NN classes =
[0.0177, 0.0089, 0.0831, 0.0002, 0.0002, 0.1448, 0.0447, 0.5335, 0.1665]
- Feature standardization mu and sigma =
mu [105.77, 124.69, 144.49, 67.62, 148.69]; sigma [134.92, 150.77, 182.78, 74.05, 219.84]
- CDA stepwise entry threshold =
F probability < 0.1
assumptions (4)
- domain assumption Voxel-level MRI intensity patterns after registration and normalization correspond to the five expert-defined disease states.
- domain assumption Expert annotations on a single pre-selected T1-GD slice provide ground truth for disease class, and agreement between two experts is sufficient.
- domain assumption Overall survival can be treated as an uncensored continuous variable in linear regression because all subjects experienced the same events.
- domain assumption The proportions of predicted classes across 11 slices (PDC) capture tumor composition relevant to clinical outcomes.
invented entities (1)
-
Predicted disease composition (PDC) phenotypes
Cite this review
Pith. "Pith review of Predicted disease compositions of human gliomas estimated from multiparametric MRI can predict endothelial proliferation, tumor grade, and overall survival." pith.science (2026). https://pith.science/paper/KBNRVU55
@misc{pith2026190802334,
  author       = {Pith},
  title        = {Pith review of: Predicted disease compositions of human gliomas estimated from multiparametric MRI can predict endothelial proliferation, tumor grade, and overall survival},
  year         = {2026},
  howpublished = {\url{https://pith.science/paper/KBNRVU55}},
  note         = {Machine review of arXiv:1908.02334}
}
read the original abstract
Background and Purpose: Biopsy is the main determinants of glioma clinical management, but require invasive sampling that fail to detect relevant features because of tumor heterogeneity. The purpose of this study was to evaluate the accuracy of a voxel-wise, multiparametric MRI radiomic method to predict features and develop a minimally invasive method to objectively assess neoplasms. Methods: Multiparametric MRI were registered to T1-weighted gadolinium contrast-enhanced data using a 12 degree-of-freedom affine model. The retrospectively collected MRI data included T1-weighted, T1-weighted gadolinium contrast-enhanced, T2-weighted, fluid attenuated inversion recovery, and multi-b-value diffusion-weighted acquired at 1.5T or 3.0T. Clinical experts provided voxel-wise annotations for five disease states on a subset of patients to establish a training feature vector of 611,930 observations. Then, a k-nearest-neighbor (k-NN) classifier was trained using a 25% hold-out design. The trained k-NN model was applied to 13,018,171 observations from seventeen histologically confirmed glioma patients. Linear regression tested overall survival (OS) relationship to predicted disease compositions (PDC) and diagnostic age (alpha = 0.05). Canonical discriminant analysis tested if PDC and diagnostic age could differentiate clinical, genetic, and microscopic factors (alpha = 0.05). Results: The model predicted voxel annotation class with a Dice similarity coefficient of 94.34% +/- 2.98. Linear combinations of PDCs and diagnostic age predicted OS (p = 0.008), grade (p = 0.014), and endothelia proliferation (p = 0.003); but fell short predicting gene mutations for TP53BP1 and IDH1. Conclusions: This voxel-wise, multi-parametric MRI radiomic strategy holds potential as a non-invasive decision-making aid for clinicians managing patients with glioma.
Figures


Reference graph
Works this paper leans on
-
[1]
Barnholtz-Sloan JS, Ostrom QT, Cote D. Epidemiology of Brain Tumors. Neurologic Clinics 2018;36:395-419. doi: 10.1016/j.ncl.2018.04.001
-
[2]
WHO classification of tumours of the central nervous system, revised, 4th edition
Cavenee WK, Wiestler OD, Ohgaki H, Louis H, editors. WHO classification of tumours of the central nervous system, revised, 4th edition. Lyon: IARC; 2016. p 15-76
work page 2016
-
[3]
Comprehensive, integrative genomic analysis of diffuse lower-grade gliomas
The cancer genome atlas research network. Comprehensive, integrative genomic analysis of diffuse lower-grade gliomas. The New England Journal of Medicine 2015;372:2481-2498. doi: 10.1056/NEJMoa1402121
-
[4]
Toward an effective strategy in glioblastoma treatment
Messaoudi K, Clavreul A, Lagarce F. Toward an effective strategy in glioblastoma treatment. Part I: Resistance mechanisms and strategies to overcome resistance of glioblastoma to temozolomide. Drug Discov Today 2015;20:899–905. doi: 10.1016/j.drudis.2015.02.011
-
[5]
Limitations of stereotactic biopsy in the initial management of gliomas
Jackson RJ, Fuller GN, Abi -Said D, et al. Limitations of stereotactic biopsy in the initial management of gliomas. Neuro Oncol 2001;3:193-200. doi: 10.1093/neuonc/3.3.193
-
[6]
Grimm F, Naros G, Gutenberg A, Keric N, Giese A, Gharabaghi A. Blurring the boundaries between frame-based and frameless sterotaxy: feasibility study for brain biopsies performed with the use of a head -mounted robot. Journal of Neurosurgery 2015;123:732- 742. doi: 10.3171/2014.12.JNS141781
-
[7]
Molecular imaging of diffuse low grade glioma
Pope WB, Spitler K. Molecular imaging of diffuse low grade glioma. Duffau H editor. Diffuse low-grade gliomas in adults, 2nd edition. Springer, Cham; 2017. p 173- 195. doi: 10.1007/978-3-319-55466-2_10
-
[8]
Utility of multiparametr ic 3 -T MRI for glioma characterization
Roy B, Gupta R, Maudsley K, et al. Utility of multiparametr ic 3 -T MRI for glioma characterization. Neuroradiology 2013;55:603-613. doi: 10.1007/s00234-013-1145-x
Show all 28 references
-
[9]
The utility of diffusion MRI with quantitative ADC measurements for differentiating high -grade from low -grade cerebral gliomas: Evidence from a meta- analysis
Zhang L, Min Z, Tang M, Chen S, Lei X, Zhang X. The utility of diffusion MRI with quantitative ADC measurements for differentiating high -grade from low -grade cerebral gliomas: Evidence from a meta- analysis. Journal of the Neurological Sciences 201;373:9 -15. doi: 10.1016/j....
-
[10]
Radiomics: images are more than pictures, they are data
Gillies R, Kinahan P, Hricak, H. Radiomics: images are more than pictures, they are data. Radiology 2016;278:563-77. doi: 10.1148/radiol.2015151169
2016 doi
-
[11]
Classification of small lesions in breast MRI: Evaluating the role of dynamically extracted texture features through feature selection
Nagarajan MB, Huber MB, Schlossbauer T, Leinsinger G, Krol A, Wismuller A. Classification of small lesions in breast MRI: Evaluating the role of dynamically extracted texture features through feature selection. J Med Biol Eng 2013;33(1). doi: 10.5405/jmbe.1183
2013 doi
-
[12]
Development and clinical application of radiomics in lung cancer
Chen B, Zhang R, Gan Y, Yang L, Li W. Development and clinical application of radiomics in lung cancer. Radiation Oncology 2017;12:1-8. doi: 10.1186/s13014-017-0885-x
2017 doi
-
[13]
Automatic classification of prostate cancer Gleason scores from multiparametric magnetic resonance images
Fehr D, Veeraraghavan H, Wibmer A, et al. Automatic classification of prostate cancer Gleason scores from multiparametric magnetic resonance images. Proc Natl Acad Sci U S A 2015;112:E6265–6273. doi: 10.1073/pnas.1505935112
2015 doi
-
[14]
Data-driven grading of brain gliomas: A multiparametric MR imaging study
Caulo M, Panara V, Tortora D, et al. Data-driven grading of brain gliomas: A multiparametric MR imaging study. Radiology 2014;272:494–503. doi: 10.1148/radiol.14132040
2014 doi
-
[15]
The multimodal brain tumor image segmentation benchmark (BRATS)
Menze BH, Jakab A, Bauer S, et al. The multimodal brain tumor image segmentation benchmark (BRATS). IEEE Trans Med Imaging 2015;34:1993- 2024. doi: 10.1109/TMI.2014.2377694
2015
-
[16]
Advancing the cancer genome atlas glioma MRI collections with expert segmentation labels and radiomic features
Bakas S, Akbari H, Sotiras A, et al. Advancing the cancer genome atlas glioma MRI collections with expert segmentation labels and radiomic features. Sci Data 2014;4:170117. doi: 10.1038/sdata.2017.117
2014 doi
-
[17]
Brain tumor segmentation and radiomics survival prediction: Contribution to the BRATS 2017 challenge
Isensee F, Kickingereder P, Wick W, Bendszuz M, Maier -Hein KH. Brain tumor segmentation and radiomics survival prediction: Contribution to the BRATS 2017 challenge. Lecture notes in computer science 2018;10370:287- 297. doi: /10.1007/978- 3-319-75238- 9_25
2017 doi
-
[18]
Voxel -based clustered imaging by multiparameter diffusion tensor images for glioma grading
Inano R, Oishi N, K unieda T, et al. Voxel -based clustered imaging by multiparameter diffusion tensor images for glioma grading. NeuroImage: Clinical 2014;5:396 -407. doi: 10.1016/j.nicl.2014.08.001
2014 doi
-
[19]
Radiomics strategy for glioma grading using texture features from multiparametric MRI
Tian Q, Yan LF, Zhang X, et al. Radiomics strategy for glioma grading using texture features from multiparametric MRI. JMRI 2018. doi: 10.1002/jmri.26010
2018 doi
-
[20]
Diffusion weighted magnetic resonance imaging and its recent trend—a survey
Chilla GS, Tan TH, Xu C, Poh CL. Diffusion weighted magnetic resonance imaging and its recent trend—a survey. Quant Imaging Med Surg 2015;5:407-422. doi: 10.3978/j.issn.2223- 4292.2015.03.01
2015
-
[21]
The dilemma of low grade glioma
Whittle IR. The dilemma of low grade glioma. Journal of Neurology, Neurosurgery & Psychiatry 2004;75:31-36. doi: 10.1136/jnnp.2004.040501
2004 arXiv
-
[22]
Improving diagnostic accuracy and interobserver concordance in the classification and grading of primary gliomas
Coons SW, Johnson PC, Scheithauer BW, Yates AJ, Pearl DK. Improving diagnostic accuracy and interobserver concordance in the classification and grading of primary gliomas. Cancer 1997;79:1381-93. doi: 10.1002/(SICI)1097 -0142(19970401)79:7<1381::AID- CNCR16>3.0.CO;2-W
1997 doi
-
[23]
Intracranial mass lesions: dynamic contrast -enhanced susceptibility-weighted echo-planar perfusion MR imaging
Cha S, Knopp EA, Johnson G, et al. Intracranial mass lesions: dynamic contrast -enhanced susceptibility-weighted echo-planar perfusion MR imaging. Radiology 2002;223:11–29. doi: 10.1148/radiol.2231010594
2002 doi
-
[24]
Cho H, Lee S, Kim J, Park H. (2018). Classification of the glioma grading using radiomics analysis. PeerJ 2018; 6: e5982. doi: 10.7717/peerj.5982
2018 doi
-
[25]
Population-Based Studies on Incidence, Survival Rates, and Genetic Alterations in Astrocytic and Oligodendroglial Gliomas
Ohgaki H, Kleihues P. Population-Based Studies on Incidence, Survival Rates, and Genetic Alterations in Astrocytic and Oligodendroglial Gliomas. Journal of Neuropathology: Experimental Neurology 2005;64:479-489. doi: 10.1093/jnen/64.6.479
2005 doi
-
[26]
CBTRUS Statistical Report: Primary Brain and Central Nervous System Tumors Diagnosed in the United States in 2008- 2012
Ostrom QT, Gittleman H, Fulop J, et al. CBTRUS Statistical Report: Primary Brain and Central Nervous System Tumors Diagnosed in the United States in 2008- 2012. Neuro- Oncology 2015;17:1–62. doi: 10.1093/neuonc/nov189
2008 doi
-
[27]
Demographic variation in incidence of adult glioma by subtype, United States, 1992-2007
Dubrow R, Darefsky AS. Demographic variation in incidence of adult glioma by subtype, United States, 1992-2007. BMC Cancer 2011;11:325-335. doi: 10.1186/1471-2407-11-325
1992 doi
-
[28]
Anatomical features of glioblastoma and their potential impact on survival
Nestler U, Lutz K, Pichlmeier U, et al. Anatomical features of glioblastoma and their potential impact on survival. Acta Neurochir 2015;157:179-186. doi: 10.1007/s00701-014-2271-x
2015 doi
Reviewed August 14, 2026 · model on record in the stance chip above.
Discussion (0). Continue with ORCID to comment.