REVIEW 3 major objections 7 minor 23 references
Visualizing Cloud-native Applications with KubeDiagrams
T0 review · 3 major / 7 minor · reviewed 2026-08-07 · deepseek-v4-flash
Pith's one-line read KubeDiagrams, an open-source tool, turns Kubernetes manifests, Helm charts, Kustomize files, or live cluster state into up-to-date architecture diagrams with semantic grouping.
desk verdict A genuinely useful open-source tool for Kubernetes diagram generation, but the paper overstates the live-cluster capability and dresses up six blog posts as a user study. read the letter →
The pith
A machine-rendered reading of the paper's core claim, the machinery that carries it, and where it could break.
The reading
What carries the argument
The central mechanism is the KubeDiagrams transformation pipeline: source artifacts or live cluster state become YAML manifests, are parsed with PyYAML, transformed into an internal graph, emitted as a .dot file, and rendered by Graphviz into final images. Its semantic core is a small visual semiotics of three meta-concepts, clusters, nodes, and edges, with eight instantiations, plus a declarative YAML configuration layer that maps resource kinds and labels to visual containers, icons, and edge styles. This configuration layer is what lets custom resources and user-defined logical clusters enter diagrams without code changes.
What would settle it
Take a cluster whose Deployments, Services, and ConfigMaps have no app, tier, or component labels and generate a diagram with KubeDiagrams; if the output still separates applications into distinct logical clusters, the semantic-grouping claim stands, but if it collapses into one flat namespace with unlabeled resources, the central value claim fails.
Extended reading notes
Core claim
On its own terms, the paper's discovery is that a scriptable, configuration-driven pipeline can provide continuously current architectural views of Kubernetes systems without requiring manual drawing. KubeDiagrams parses YAML manifests produced by helm, kustomize, helmfile, or kubectl, builds an internal graph, emits a Graphviz .dot file, and renders PNG, JPG, GIF, TIFF, SVG, PDF, and DOT outputs. The visual encoding carries the semantic content: cluster containers for namespaces, Helm charts, applications, and components; nodes for resources; three edge styles distinguishing explicit references, label-based selectors, and owner/controller relations; and custom icons for custom resources. Case studies on WordPress, cert-manager, and minikube demonstrate the tool across business applications, operators, and control planes.
Load-bearing premise
The central claim of semantic fidelity depends on Kubernetes resources carrying consistent labels such as app, tier, or component so that KubeDiagrams can infer logical groupings; when users omit or apply labels inconsistently, the paper states that diagrams may flatten logical groupings or misrepresent boundaries between services.
Editorial extensions
If this is right
- Teams can embed diagram generation in CI/CD pipelines so architecture documentation regenerates on every push or deployment.
- Diagrams can be produced from manifests, Helm charts, Kustomize files, helmfile descriptions, and live cluster state with one tool, a combination the paper's survey finds in no other tool.
- Label-based clustering and typed edges make diagrams reflect application boundaries and relationships rather than raw resource listings.
- The declarative configuration mechanism lets users visualize custom resources and domain-specific groupings without modifying the tool itself.
- The comparative analysis suggests KubeDiagrams occupies a unique niche among surveyed tools in combining resource-kind coverage, input formats, and output formats.
Reading between the lines
- A natural extension, not tested in the paper: infer logical grouping from owner references and selectors when labels are missing, which would soften the label-convention dependence.
- If the same pipeline were fed metrics or logs, it could overlay live behavior on static structure, turning generated documentation into a runtime lens.
- The paper's adoption evidence is anecdotal; a controlled study measuring onboarding time or debugging accuracy would test whether the perceived gains are real.
- The tool's rapid adoption suggests a broader pattern: CI/CD systems may increasingly treat generated diagrams as build artifacts, making architecture documentation reproducible rather than hand-maintained.
Editorial analysis
A structured set of objections, weighed in public.
Referee Report
Summary. The paper presents KubeDiagrams, an open-source command-line and Python-library tool that generates architecture diagrams from Kubernetes YAML manifests, Helm charts, Kustomize overlays, helmfile descriptors, or a live cluster state via kubectl. The tool supports 47 resource kinds, label-based semantic clustering, official Kubernetes icons, three edge types, and seven output formats. The paper describes the tool's architecture and visual semiotics, illustrates it with three case studies (WordPress, cert-manager, minikube), compares it with fourteen other tools on activity and features, and analyzes practitioner feedback drawn from six blog/Reddit sources. The authors claim the design is grounded in a user-centered study of real-world visualization practices.
Significance. The functional core of the paper is plausible and partly checkable: the public repository provides installable packages, a container image, and example configurations for the case studies. If the tool works as described, it is a useful addition to the Kubernetes visualization ecosystem, and the completeness of the comparative table is a useful service to the community. However, the paper's evaluation is the weakest part. The 'practitioner study' consists of six self-selected grey-literature items analyzed by quote counting, and Section VI admits that no formal usability study was performed. Moreover, the documented live-cluster command cannot produce semantically complete diagrams because `kubectl get all` omits several important resource kinds. These issues do not disprove the tool's usefulness, but they require the claims to be qualified or the evidence strengthened.
major comments (3)
- [II.A.a (see also I)] The only live-cluster command shown in the paper, `kubectl get all -o yaml | kube-diagrams -o diagram.png -`, cannot deliver the 'semantically rich architecture diagrams from live cluster states' promised in Section I. The `kubectl get all` alias returns only pods, services, deployments, replicasets, statefulsets, daemonsets, jobs, and cronjobs; it omits ConfigMaps, Secrets, Ingresses, PersistentVolumeClaims, NetworkPolicies, ServiceAccounts, and most other kinds that the tool claims to support. A user following the paper's instructions would therefore get a diagram that lacks configuration, storage, and policy resources, which are central to the tool's claimed semantic completeness. Section VI mentions only the omission of ephemeral resources (Events, TokenReview), not this more serious gap. The authors should either replace the example with a comprehensive command (for example, `kubectl get all,cm,secret,ingress,pvc,networkpolicy,serviceaccount -o yaml | kube-diagrams -o diagram.png -`) or explicitly state that the live-cluster path is partial and requires the user to supply additional resources.
- [V and Abstract] The Abstract and Section I state that the design is 'grounded in a user-centered study of real-world visualization practices,' but the evidence presented in Section V is a convenience sample of six blog posts and Reddit threads, analyzed by counting thematic quotes (Table III, Fig. 9). Section VI concedes that 'the project has not undergone a formal usability study.' Further, one of the six sources ([20]) is a release announcement, which is not 'unprompted user feedback' in the sense the paper intends. The testimonial-based claims are therefore post-hoc and anecdotal. The language should be revised to describe the evidence as informal community feedback, and the 'study' framing should be removed or replaced with a clearly labeled exploratory analysis.
- [VI (Limitations)] The label-convention dependency acknowledged in Section VI is not a peripheral limitation but a direct threat to the core value proposition described in Section II.A.c: 'Semantic Grouping and Label-Based Clustering.' The paper states that when users omit or inconsistently apply labels such as `app`, `tier`, or `component`, diagrams may flatten logical groupings or misrepresent service boundaries. Because the tool's main advantage over a raw manifest listing is precisely this semantic grouping, the paper should either provide evidence on how commonly these labels are used in real clusters or explicitly characterize the semantic grouping as best-effort rather than a guaranteed feature. As written, the limitation is mentioned only in passing and does not qualify the central claims made elsewhere.
minor comments (7)
- [II.A.a] The command `kube-diagrams -o diagram.png -` uses a trailing `-` to denote stdin; the paper does not explain this convention, which may be unclear to readers new to command-line tools.
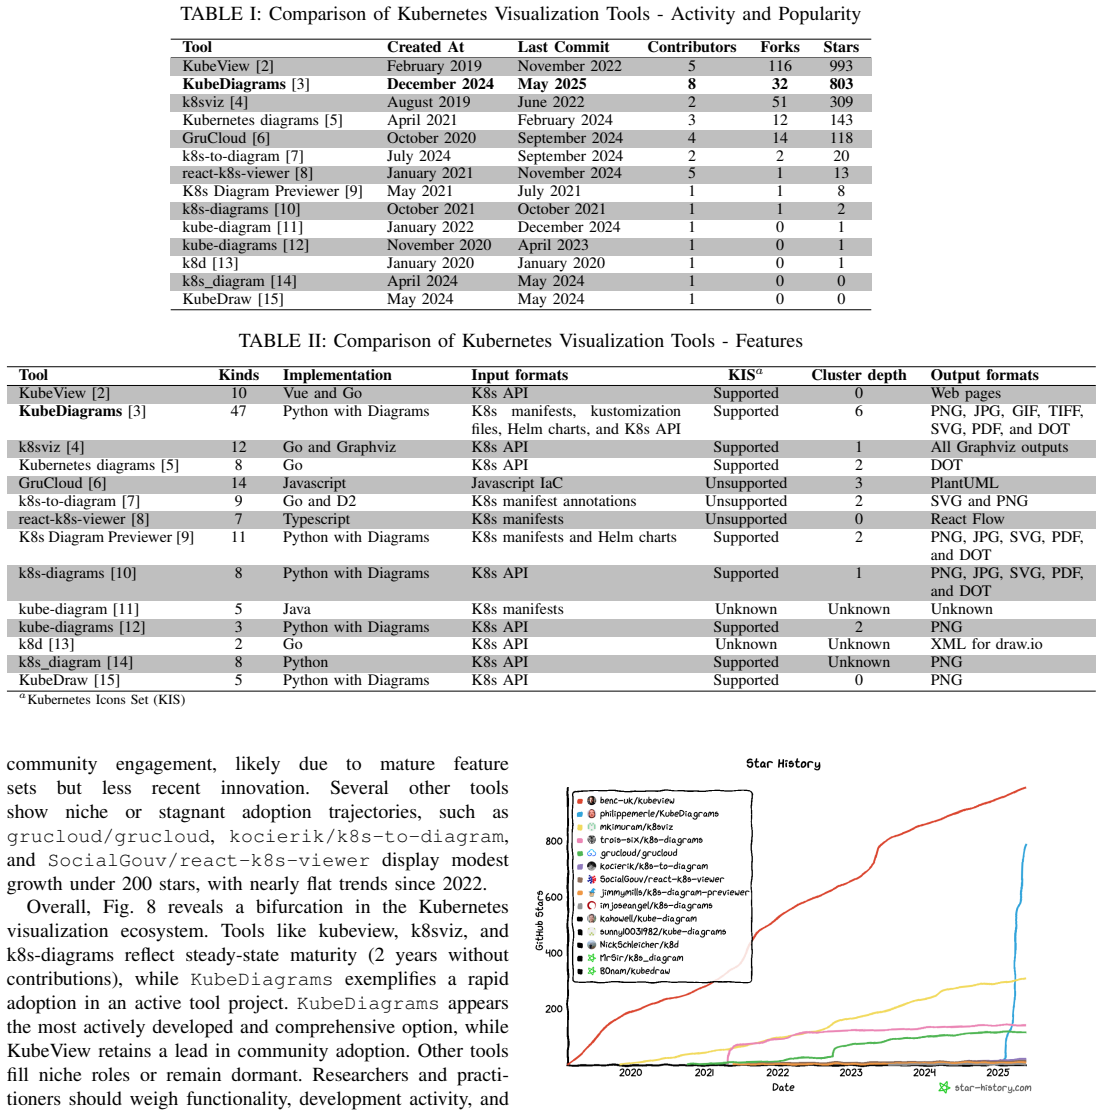
- [IV] The text says 'fifteen representative projects' but Table I lists fourteen rows (KubeView, KubeDiagrams, k8sviz, Kubernetes diagrams, GruCloud, k8s-to-diagram, react-k8s-viewer, K8s Diagram Previewer, k8s-diagrams, kube-diagram, kube-diagrams, k8d, k8s diagram, KubeDraw); either add the missing project or change 'fifteen' to 'fourteen'.
- [V] The phrase 'unprompted user feedback' is inaccurate because at least one source ([20]) is a release announcement, and the list of sources is hosted on the project's own README, which invites selection bias; the description should be adjusted.
- [VI] The sentence 'KubeDiagrams currently produces static diagrams work well for documentation' contains a grammatical error; it should read 'produces static diagrams that work well'.
- [II.B.2] The list of supported resource types includes PodSecurityPolicy, which is deprecated and removed in recent Kubernetes versions; the paper should note the version compatibility or remove the entry.
- [III.B] Listing 2 contains duplicate `nodes:` keys; although the intent is clear, a parseable YAML example should be provided in the appendix or linked in the repository.
- [References] The URL for reference [14] contains an unencoded space ('https://github.com/MrSir/k8s diagram'); this should be fixed.
Circularity Check
No circular derivation: KubeDiagrams is a tool paper whose outputs are direct transformations of its inputs; the practitioner-feedback evidence is post-hoc but independent of the tool's construction.
full rationale
This paper contains no equations, fitted parameters, or predictive claims that could secretly reduce to their own inputs. KubeDiagrams' diagrams are produced by a deterministic pipeline (kubectl/helm/kustomize -> YAML -> PyYAML -> Graphviz DOT), so the central 'generation' claim is a direct transformation rather than a derivation from a theory. The practitioner feedback in Section V is external, post-release commentary about the released tool; it is used as evidence of reception and value, not as a design input that defines the tool's output. The paper itself acknowledges in Section VI that 'the project has not undergone a formal usability study,' so the abstract's phrase 'user-centered study' is an overstatement of evidence quality, but this is a limitation/consistency issue, not circularity. The only self-references are to the tool's own GitHub repository and project URLs, which are appropriate sources for implementation details; no uniqueness theorem or mathematical result is imported from the authors' prior work. The documented `kubectl get all -o yaml` example omits ConfigMaps, Secrets, Ingresses, and other resource kinds, which is a workflow-completeness concern for the live-cluster path, but it does not make any derivation circular. Accordingly, there is no load-bearing step that reduces to its own inputs.
Assumptions & free parameters
assumptions (4)
- domain assumption GitHub star counts are a meaningful proxy for community interest and adoption.
- domain assumption Six self-selected grey-literature sources are representative practitioner feedback.
- domain assumption Consistent application of labels such as app, tier, and component is common enough to make semantic grouping reliable.
- domain assumption Graphviz's automatic layout produces readable diagrams at production scale.
Cite this review
Pith. "Pith review of Visualizing Cloud-native Applications with KubeDiagrams." pith.science (2026). https://pith.science/paper/KCINS3YE
@misc{pith2026250522879,
  author       = {Pith},
  title        = {Pith review of: Visualizing Cloud-native Applications with KubeDiagrams},
  year         = {2026},
  howpublished = {\url{https://pith.science/paper/KCINS3YE}},
  note         = {Machine review of arXiv:2505.22879}
}
read the original abstract
Modern distributed applications increasingly rely on cloud-native platforms to abstract the complexity of deployment and scalability. As the de facto orchestration standard, Kubernetes enables this abstraction, but its declarative configuration model makes the architectural understanding difficult. Developers, operators, and architects struggle to form accurate mental models from raw manifests, Helm charts, or cluster state descriptions. We introduce KubeDiagrams, an open-source tool that transforms Kubernetes manifests into architecture diagrams. By grounding our design in a user-centered study of real-world visualization practices, we identify the specific challenges Kubernetes users face and map these to concrete design requirements. KubeDiagrams integrates seamlessly with standard Kubernetes artifacts, preserves semantic fidelity to core concepts, and supports extensibility and automation. We detail the tool's architecture, visual encoding strategies, and extensibility mechanisms. Three case studies illustrate how KubeDiagrams enhances system comprehension and supports architectural reasoning in distributed cloud-native systems. KubeDiagrams addresses concrete pain points in Kubernetes-based DevOps practices and is valued for its automation, clarity, and low-friction integration into real-world tooling environments.
Figures


Figures from the paper (5 more)



Reference graph
Works this paper leans on
-
[20]
Reddit users, “KubeDiagrams 0.2.0 is out!” Mar. 2025, accessed: 2025-05-21. [Online]. Available: https://www.reddit.com/r/kubernetes/ comments/1jjjw6j/kubediagrams 020 is out/
work page 2025
-
[1]
Graphviz— open source graph drawing tools,
J. Ellson, E. Gansner, L. Koutsofios, S. C. North, and G. Woodhull, “Graphviz— open source graph drawing tools,” inGraph Drawing, P. Mutzel, M. J¨unger, and S. Leipert, Eds. Berlin, Heidelberg: Springer Berlin Heidelberg, 2002, pp. 483–484
work page 2002
-
[2]
Kubeview: Kubernetes cluster visualiser and graphical explorer,
B. Coleman, “Kubeview: Kubernetes cluster visualiser and graphical explorer,” https://github.com/benc-uk/kubeview, 2019, accessed: 2025- 05-22
work page 2019
-
[3]
KubeDiagrams: A Kubernetes architecture visualization tool,
P. Merle, “KubeDiagrams: A Kubernetes architecture visualization tool,” https://github.com/philippemerle/KubeDiagrams, 2024, accessed: 2025- 05-22
work page 2024
-
[4]
k8sviz: Kubernetes visualization tool,
M. Kimura, “k8sviz: Kubernetes visualization tool,” https://github.com/ mkimuram/k8sviz, 2019, accessed: 2025-05-22
work page 2019
-
[5]
k8s-diagrams: Generate diagrams from kubernetes yaml man- ifests,
trois six, “k8s-diagrams: Generate diagrams from kubernetes yaml man- ifests,” https://github.com/trois-six/k8s-diagrams, 2021, accessed: 2025- 05-22
work page 2021
-
[6]
Grucloud: Iac diagram and deployment tool,
GruCloud, “Grucloud: Iac diagram and deployment tool,” https: //github.com/grucloud/grucloud, 2020, accessed: 2025-05-22. [Online]. Available: https://github.com/grucloud/grucloud
work page 2020
-
[7]
k8s-to-diagram: Kubernetes architecture diagram genera- tor,
M. Kocierik, “k8s-to-diagram: Kubernetes architecture diagram genera- tor,” https://github.com/kocierik/k8s-to-diagram, 2024, accessed: 2025- 05-22
work page 2024
Show all 23 references
-
[8]
react-k8s-viewer: Kubernetes UI components in React,
SocialGouv, “react-k8s-viewer: Kubernetes UI components in React,” https://github.com/SocialGouv/react-k8s-viewer, 2021, accessed: 2025- 05-22
2021
-
[9]
K8s diagram previewer,
J. Mills, “K8s diagram previewer,” https://github.com/jimmymills/ k8s-diagram-previewer, 2021, accessed: 2025-05-22
2021
-
[10]
k8s-diagrams: Generate diagrams from kubernetes manifests,
J. ´Angel, “k8s-diagrams: Generate diagrams from kubernetes manifests,” https://github.com/imjoseangel/k8s-diagrams, 2021, accessed: 2025-05- 22
2021
-
[11]
kube-diagram: Generate diagrams from kubernetes yaml manifests,
K. A. Howell, “kube-diagram: Generate diagrams from kubernetes yaml manifests,” https://github.com/kahowell/kube-diagram, 2022, accessed: 2025-05-22
2022
-
[12]
kube-diagrams: Generate architecture diagrams for kubernetes resources,
Sunny, “kube-diagrams: Generate architecture diagrams for kubernetes resources,” https://github.com/sunny10031982/kube-diagrams, 2020, accessed: 2025-05-22. [Online]. Available: https://github.com/ sunny10031982/kube-diagrams
2020
-
[13]
k8d: Kubernetes diagrams from yaml files,
N. Schleicher, “k8d: Kubernetes diagrams from yaml files,” https: //github.com/NickSchleicher/k8d, 2020, accessed: 2025-05-22
2020
-
[14]
k8s diagram: A kubernetes architecture diagram generator,
MrSir, “k8s diagram: A kubernetes architecture diagram generator,” https://github.com/MrSir/k8s diagram, 2024, accessed: 2025-05-22
2024
-
[15]
Kubedraw: A kubernetes architecture visualization tool,
B. Nam, “Kubedraw: A kubernetes architecture visualization tool,” https: //github.com/B0nam/kubedraw, 2024, accessed: 2025-05-22
2024
-
[16]
Generate kubernetes architecture maps di- rectly from your cluster,
A. Saharan, “Generate kubernetes architecture maps di- rectly from your cluster,” Mar. 2025, accessed: 2025-05-
2025
-
[17]
Kubediagrams 0.2.0 makes it way easier to visualize your kubernetes setup,
Mr.PlanB, “Kubediagrams 0.2.0 makes it way easier to visualize your kubernetes setup,” Mar. 2025, accessed: 2025-05-21. [Online]. Available: https://medium.com/weeklycloud/kubediagrams
2025
-
[18]
Visualising sql server in kubernetes,
dbafromthecold, “Visualising sql server in kubernetes,” Feb. 2025, accessed: 2025-05-21. [Online]. Available: https://dbafromthecold.com/ 2025/02/06/visualising-sql-server-in-kubernetes/
2025
-
[19]
Kubediagrams: Generate live kubernetes architecture maps effortlessly,
DailyOpenSourceTools, “Kubediagrams: Generate live kubernetes architecture maps effortlessly,” mar 2025, accessed: 2025-05-21. [Online]. Available: https://app.daily.dev/posts/kubediagrams-e35zcloui
2025
-
[21]
Available: https://blog.abhimanyu-saharan.com/posts/ generate-kubernetes-architecture-maps-directly-from-your-cluster
[Online]. Available: https://blog.abhimanyu-saharan.com/posts/ generate-kubernetes-architecture-maps-directly-from-your-cluster
-
[22]
Kubediagrams,
u/Anonymous, “Kubediagrams,” Mar. 2025, accessed: 2025-05-
2025
-
[23]
Available: https://www.reddit.com/r/kubernetes/comments/ 1ihjujy/kubediagrams/
[Online]. Available: https://www.reddit.com/r/kubernetes/comments/ 1ihjujy/kubediagrams/
Reviewed August 7, 2026 · model on record in the stance chip above.
Discussion (0). Sign in to comment.