REVIEW 4 major objections 4 minor 21 references
Deriving a Quantitative Relationship Between Resolution and Human Classification Error
T0 review · 4 major / 4 minor · reviewed 2026-08-14 · deepseek-v4-flash
Pith's one-line read Human classification error on square images is a logistic function of image width in pixels, fitted from 10,000 labels on down-sampled MNIST digits.
desk verdict A useful but overreaching empirical curve fit: the central logistic equation lacks supporting data, error bars, and any independent validation. read the letter →
The pith
A machine-rendered reading of the paper's core claim, the machinery that carries it, and where it could break.
The reading
What carries the argument
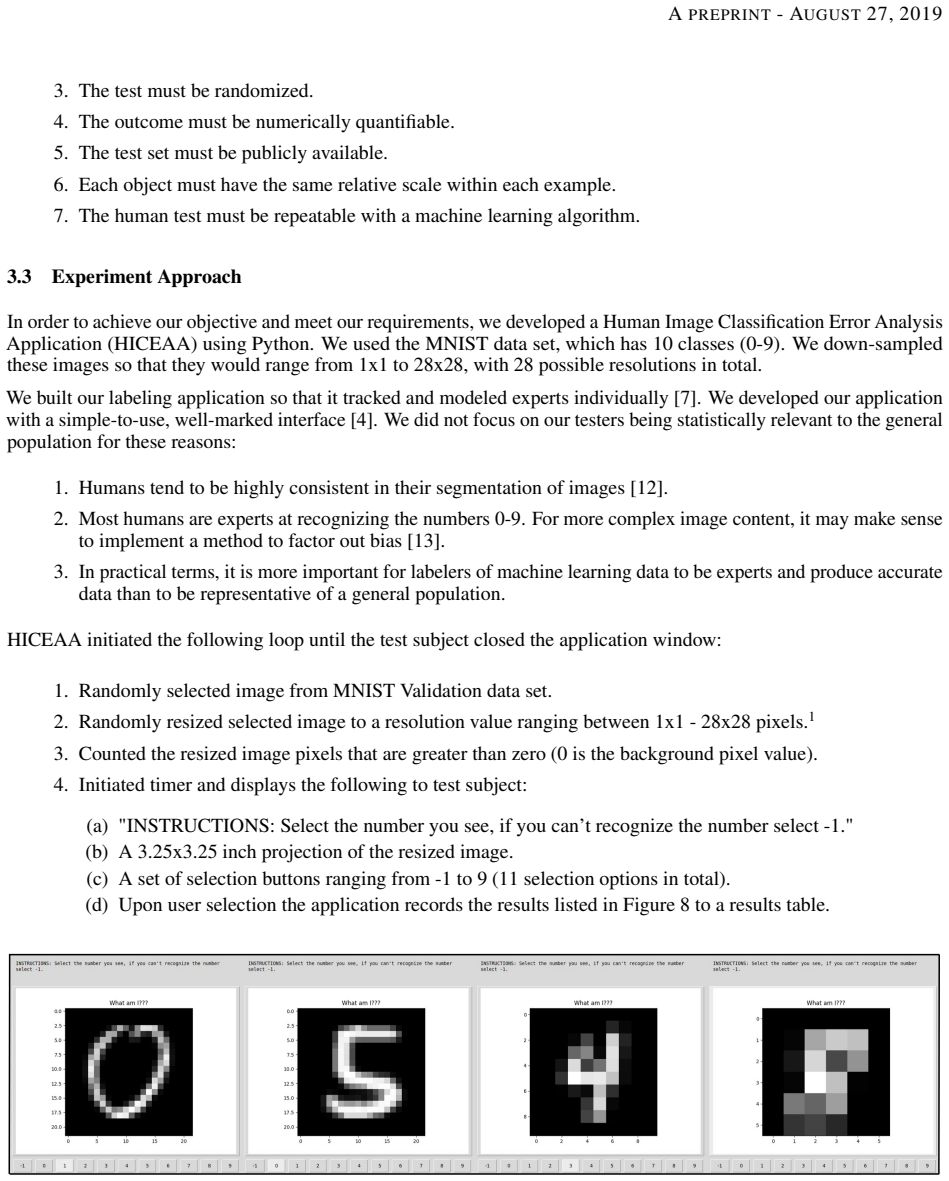
The load-bearing object is the fitted inverse-sigmoid logistic curve, $y = 1/(1 + \exp(-(\alpha x + c)))$ with $\alpha = -0.95$ and $c = 6.5$, parameterized by image width $x$ in pixels. It was obtained by repeatedly resizing MNIST digits from $1 \times 1$ to $28 \times 28$ with area-based decimation, fixing the displayed image at $3.25 \times 3.25$ inches, collecting 10,000 human selections, and aggregating error by resolution. The curve converts resolution into an error estimate, which is what lets the authors invert the relationship and solve for the resolution required to hit a specific human-level performance target.
What would settle it
Present the same down-sampled MNIST images at the same pixel widths but at a materially different physical display size, such as 1.5 by 1.5 inches, and measure human error; if error rates deviate from the fitted logistic curve at matched pixel widths, the claim that pixel width alone determines error is falsified. Re-running the experiment with a different resampling method, such as nearest-neighbor instead of area averaging, and finding that $\alpha$ and $c$ shift would also settle the question.
Extended reading notes
Core claim
The paper's central claim is that human classification error rate $y$ on square images is described by $y = f(x) = 1/(1 + \exp(-(\alpha x + c)))$ with $\alpha = -0.95$ and $c = 6.5$, where $x$ is image width in pixels. Because $\alpha$ is negative, error is near certain at very coarse resolutions and falls to near zero by $28 \times 28$, matching the intuition that tiny thumbnails become unreadable. The authors report this as an empirically derived heuristic, not a theoretical law, and propose that it can stand in for the missing pixel-count variable in standard machine-vision resolution formulas, letting a practitioner solve for the resolution needed to reach a target error rate.
Load-bearing premise
The load-bearing premise is that human classification error is fully determined by image width in pixels, independent of display size, viewing distance, resampling method, and dataset content, so the fitted logistic constants generalize beyond the test setup.
Editorial extensions
If this is right
- The inverse of the logistic curve gives the minimum image width needed to keep expected labeling error at or below any chosen level.
- Before training, a team can estimate the ceiling on model accuracy from human error at the resolution of already-available data, turning feasibility analysis into a quick calculation.
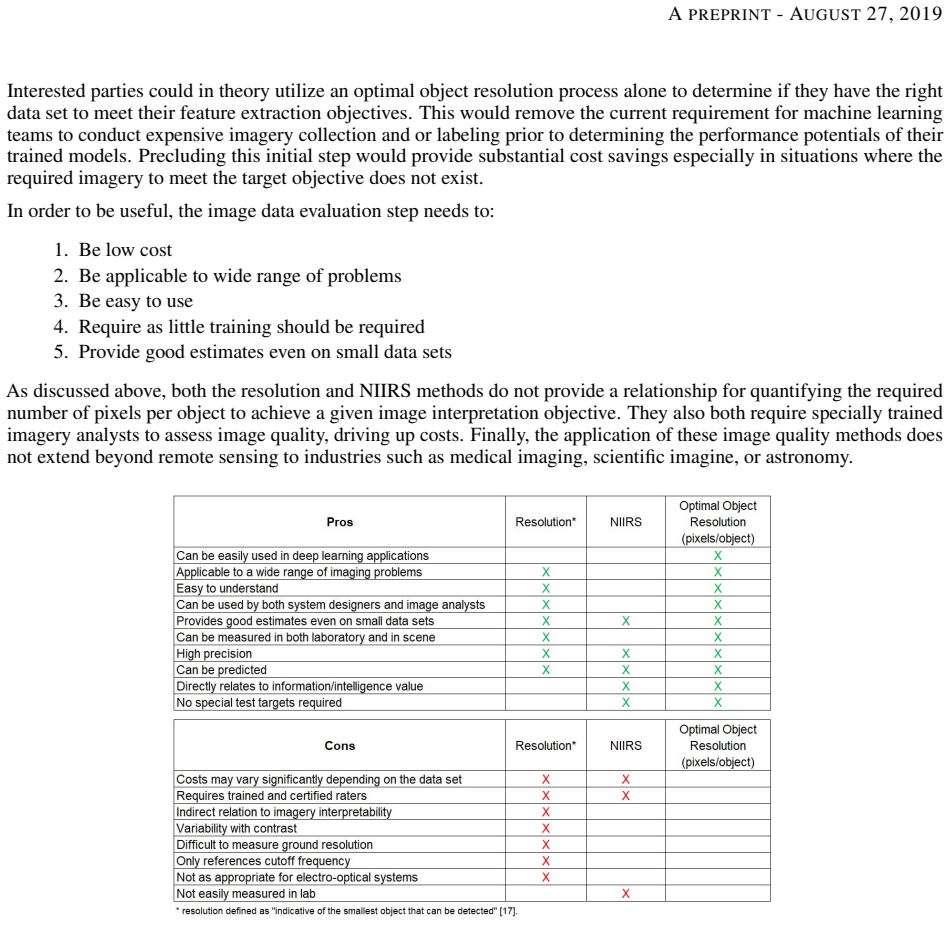
- The fitted pixels-per-object value supplies the missing $N_f$ term in the standard camera-resolution formula, so the heuristic connects directly to sensor and data-collection choices.
- The curve is steepest around roughly 7 pixels of image width, so reducing resolution below that point is where labeling error rises fastest and should be avoided unless unavoidable.
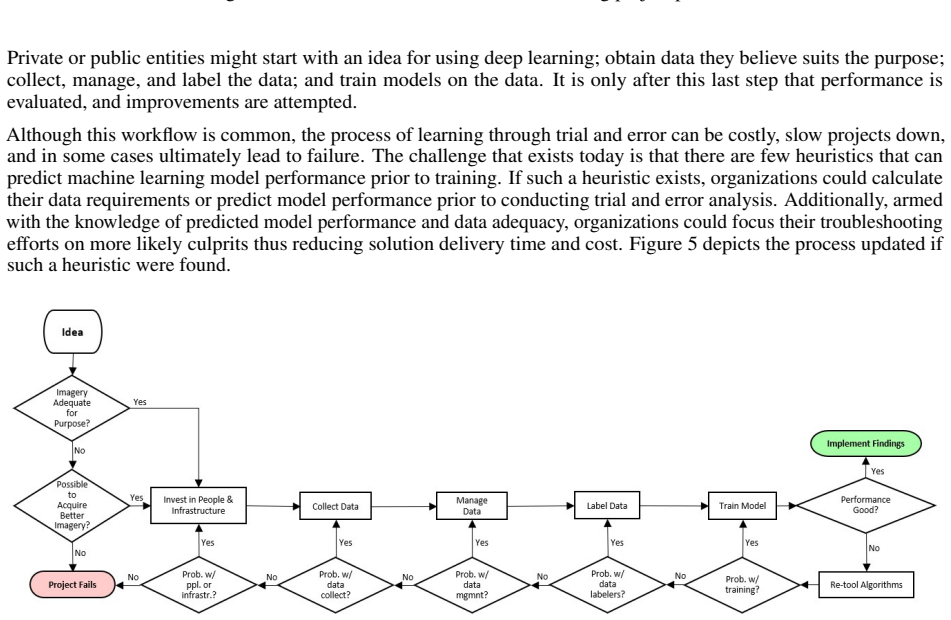
- Using this heuristic before data acquisition lets organizations compare predicted performance against collection and labeling costs, potentially avoiding wasted expenditure on data that cannot meet the target.
Reading between the lines
- The fitted constants are entangled with the fixed $3.25 \times 3.25$-inch display used in the experiment; changing physical display size or viewing distance should shift them, so practical use outside the test setup requires an explicit display-scale term or a re-fit at the deployment display size.
- If the logistic shape is generic, the same protocol could measure how much resolution a new domain needs by collecting a few hundred labels at two or three widths and checking whether they fall on the family of curves; the fitted center would then be a task-difficulty index.
- Because the paper treats human error as a proxy for Bayes error, the monotone curve implies a model trained at high resolution and evaluated on down-sampled inputs should be bounded by the human error at that lower resolution, offering a cheap sanity check before deploying at reduced resolution.
Signed reviews
Editorial analysis
A structured set of objections, weighed in public.
Referee Report
Summary. The manuscript reports an empirical study in which human participants classified down-sampled MNIST digits at 28 resolutions from 1x1 to 28x28 pixels. Based on 10,000 collected labels, the authors plot human classification error versus image width and claim that the relationship is an inverse sigmoid, yielding Eq. (2): y = f(x) = 1 / (1 + exp(-(alpha*x + c))) with alpha = -0.95 and c = 6.5. The paper argues that this quantitative heuristic can be used to estimate required data resolution, predict model performance, and substitute for the variable N_f in standard machine vision resolution formulas, with potential applications in remote sensing, medical imaging, and astronomy.
Significance. If Eq. (2) were a validated general relationship, it would provide a practically useful heuristic for planning image resolution in data labeling and machine learning projects. The experimental idea is reasonable, and the use of a public dataset (MNIST) makes the protocol easy to describe and potentially repeatable. However, the central quantitative claim is not yet supported: the paper provides no per-resolution error data, no fit diagnostics, no uncertainty quantification, and no independent validation. The extension to other modalities is pure extrapolation from a single digit-recognition task. The authors themselves state that they plan further testing on additional datasets, which underscores the preliminary character of the result.
major comments (4)
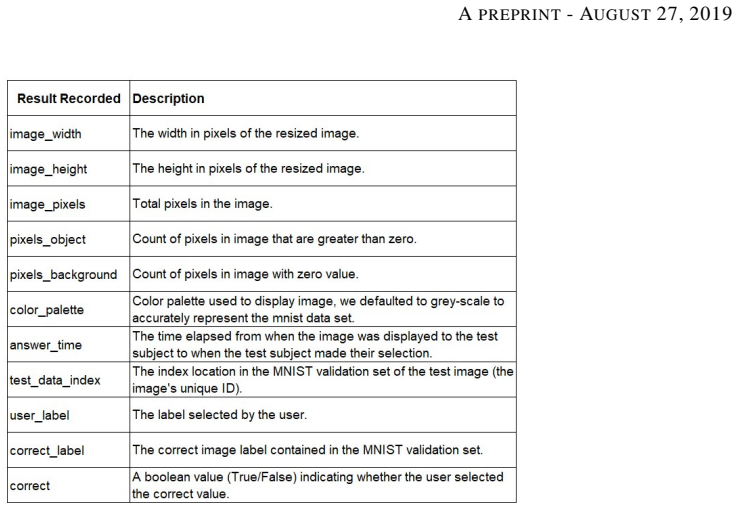
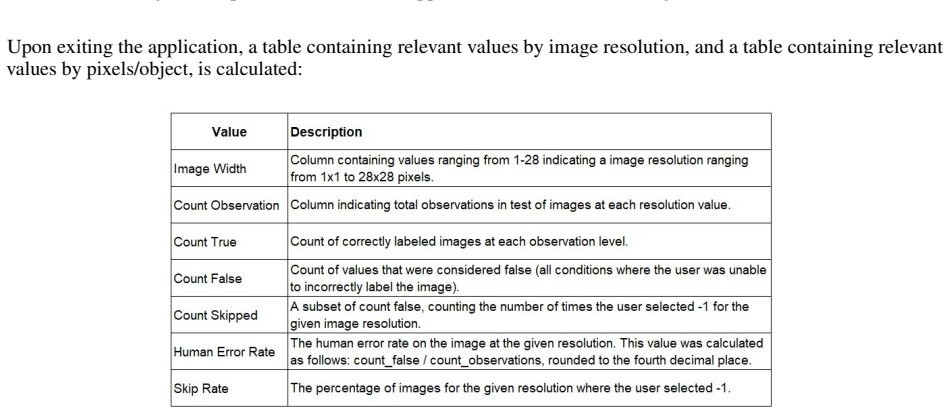
- [§4, Eq. (2)] The central result is presented with only the fitted constants alpha = -0.95 and c = 6.5. The manuscript does not report the per-resolution error rates, the number of participants, the number of trials per resolution, standard errors, confidence intervals, or any regression diagnostics. Figures 9 and 10, which are captioned as containing the aggregate error tables, are not actually included in the manuscript. Without these data, the fit cannot be assessed, reproduced, or compared with any alternative functional form, so the quantitative claim in Eq. (2) is not verifiable from the paper.
- [§4 and §3.3] The inverse sigmoid functional form was chosen after inspecting the plotted data, and the two constants were fitted to the same data set that Eq. (2) then claims to describe. No cross-validation, holdout set, or independent dataset is used. As a result, Eq. (2) is a description of the training points, not a derived or predicted relationship; it has not been shown to generalize to new labelers, new digit samples, or other image content.
- [§3.3 and §4] The protocol fixes the display size at 3.25 x 3.25 inches and uses a single resampling method (cv2 INTER_AREA), but Eq. (2) contains only the pixel width x. The fitted constants therefore absorb the particular display geometry, viewing conditions, and resampling algorithm. The equation implicitly claims that human classification error is determined by pixel width alone, a premise that the experiment never varied. Without explicitly stating these boundary conditions, the constants cannot be transferred to other display sizes or resampling methods.
- [§5 and §6] The discussion and conclusion extend the result to remote sensing, medical imaging, scientific imaging, and astronomy, but the experiment is confined to MNIST with ten digit classes and a fixed native image scale. The paper provides no argument or evidence that the sigmoid shape or the specific constants alpha and c carry over to other content types, class counts, image statistics, or imaging modalities. This extrapolation is load-bearing for the practical claims about data-acquisition requirements and model-performance prediction.
minor comments (4)
- [§2.4] The phrase "scientific imagine" should be "scientific imaging".
- [§3.3] The text states that 10,000 labels were collected but does not state how many participants took part or how labels were distributed across resolutions; adding this basic methodological detail would improve clarity.
- [§2.2 and §3.3] The term "resolution" is used in different senses: in §2.2 it refers to the smallest detectable object or ground sampling distance, while in the experiment it refers to image width in pixels. The manuscript should clarify this distinction and define "pixels/object" explicitly.
- [Figure 4] The caption "Current state of the art machine learning project process" should be hyphenated as "state-of-the-art".
Circularity Check
Equation (2) is the fitted logistic regression itself, not an independently derived or validated prediction.
-
fitted input called prediction
[Section 3.3 (Methodology) and Section 4, Eq. (2)]
"10,000 labels from test subjects were collected using the HICEAA. The results were plotted and a regression analysis was conducted to analyze the quantitative relationship between image/object resolution and human classification error. ... We observed that an inverse sigmoid function described the relationship. We arrived at the following relationship between resolution and human classification error, assuming that the image is equilateral (or square): ... y = f (x) = 1 / (1 + e^{-(αx+c)})"
The constants α=-0.95 and c=6.5 in Eq. (2) are the parameters of a logistic curve fit to the collected human error data; the paper's own text states that the data were plotted and a regression analysis was conducted before 'arriving at' the relationship. The equation therefore reduces to the fit by construction: y is the fitted function of x, and any error-rate value it produces for a resolution in the experimental range is the regression's own output, not an independent prediction. Because no held-out resolutions, cross-validation, error bars, confidence intervals, or external dataset are reported, the equation cannot be said to predict human error; it merely restates the fitted curve.
full rationale
The only load-bearing quantitative result is Eq. (2), and the paper's methodology establishes that it is a logistic regression fit to the same 10,000 labels used to claim the 'quantitative relationship.' This is pattern 2 (fitted input called prediction): the regression parameters are renamed as a 'relationship' and then proposed as a heuristic for 'predicting' error rates and data requirements. There is no self-citation chain or imported uniqueness theorem; the circularity, such as it is, is that the derived equation is definitionally the fitted curve, with no independent validation to give it predictive content. Additional non-circular concerns (fixed display size at 3.25 x 3.25 inches, a single MNIST dataset, one resampling method, and no error bars) further weaken generalization but do not themselves constitute circularity. Score 6 reflects that the central claim reduces to a fit, while the paper does not fabricate a derivation from theory beyond the regression itself.
Assumptions & free parameters
free parameters (2)
- c (sigmoid x-axis center) =
6.5
- alpha (sigmoid accelerator) =
-0.95
assumptions (4)
- ad hoc to paper A logistic (inverse sigmoid) curve is the correct functional form relating resolution to human error.
- domain assumption Human labelers need not be statistically representative because human segmentation is highly consistent and most humans are expert digit recognizers.
- domain assumption cv2.resize with INTER_AREA produces downsampled images that faithfully represent resolution loss.
- domain assumption MNIST digits are an appropriate proxy for general visual perception tasks in remote sensing, medicine, and astronomy.
Cite this review
Pith. "Pith review of Deriving a Quantitative Relationship Between Resolution and Human Classification Error." pith.science (2026). https://pith.science/paper/KUAWMTKO
@misc{pith2026190809183,
  author       = {Pith},
  title        = {Pith review of: Deriving a Quantitative Relationship Between Resolution and Human Classification Error},
  year         = {2026},
  howpublished = {\url{https://pith.science/paper/KUAWMTKO}},
  note         = {Machine review of arXiv:1908.09183}
}
read the original abstract
For machine learning perception problems, human-level classification performance is used as an estimate of top algorithm performance. Thus, it is important to understand as precisely as possible the factors that impact human-level performance. Knowing this 1) provides a benchmark for model performance, 2) tells a project manager what type of data to obtain for human labelers in order to get accurate labels, and 3) enables ground-truth analysis--largely conducted by humans--to be carried out smoothly. In this empirical study, we explored the relationship between resolution and human classification performance using the MNIST data set down-sampled to various resolutions. The quantitative heuristic we derived could prove useful for predicting machine model performance, predicting data storage requirements, and saving valuable resources in the deployment of machine learning projects. It also has the potential to be used in a wide variety of fields such as remote sensing, medical imaging, scientific imaging, and astronomy.
Figures

Figures from the paper (7 more)

Reference graph
Works this paper leans on
-
[1]
V-NIIRS fusion modeling for EO/IR systems
Erik Blasch and Bart Kahler. “V-NIIRS fusion modeling for EO/IR systems”. In:2015 National Aerospace and Electronics Conference (NAECON). NAECON 2015 - IEEE National Aerospace and Electronics Conference. Dayton, OH, USA: IEEE, June 2015, pp. 19–26. ISBN : 978-1-4673-7565-8. DOI: 10.1109/NAECON.2015. 7443033. URL: http://ieeexplore.ieee.org/document/7443033/
-
[2]
How Many Pixels Do We Need to See Things?
Yang Cai. “How Many Pixels Do We Need to See Things?” In:Computational Science — ICCS 2003 . Ed. by Peter M. A. Sloot et al. Lecture Notes in Computer Science. Springer Berlin Heidelberg, 2003, pp. 1064–1073. ISBN : 978-3-540-44863-1
work page 2003
-
[3]
Imagery Resolution Assessments and Reporting Standards (IRARS) Committee
Civil NIIRS Reference Guide. Imagery Resolution Assessments and Reporting Standards (IRARS) Committee. URL: https://fas.org/irp/imint/niirs_c/guide.htm
-
[4]
Antonello de Galizia et al. “Advanced investigation of HRA methods for probabilistic assessment of human barriers efficiency in complex systems for a given organisational and environmental context”. In: International Topical Meeting on Probabilistic Safety Assessment and Analysis. PSA 2015, Idaho National Laboratory/Idaho American Nuclear Society, Apr 2015...
work page 2015
-
[5]
Application of the ITIQUE Image Quality Modeling Metric to SSA Domain Imagery
David R Gerwe, Carlos E Luna, and Brandoch Calef. “Application of the ITIQUE Image Quality Modeling Metric to SSA Domain Imagery”. In: Advanced Maui Optical and Space Surveillance Technologies Conference . Sept. 2012, p. 7. URL: https://ui.adsabs.harvard.edu/abs/2012amos.confE...7G
work page 2012
-
[6]
Bradley Gram-Hansen et al. “Mapping Informal Settlements in Developing Countries using Machine Learning and Low Resolution Multi-spectral Data”. In: CoRR abs/1901.00861 (2019). arXiv: 1901.00861. URL: http: //arxiv.org/abs/1901.00861
work page Pith review arXiv 2019
-
[7]
Who Said What: Modeling Individual Labelers Improves Classification
Melody Y . Guan et al. “Who Said What: Modeling Individual Labelers Improves Classification”. In: Thirty- Second AAAI Conference on Artificial Intelligence. Apr. 29, 2018
work page 2018
-
[8]
Handbook of Machine and Computer Vision: The Guide for Developers and Users
Alexander Hornberg, ed. Handbook of Machine and Computer Vision: The Guide for Developers and Users . 2nd. Wiley, Mar. 2017. ISBN : 9783527413393
work page 2017
Show all 21 references
-
[9]
National imagery interpretability rating scales (NIIRS): overview and methodology
John M. Irvine. “National imagery interpretability rating scales (NIIRS): overview and methodology”. In: Optical Science, Engineering and Instrumentation ’97. San Diego, CA, Nov. 21, 1997, pp. 93–103. DOI: 10.1117/12.279081. URL: https://doi.org/10.1117/12.279081
1997 doi
-
[10]
Quantifying interpretability for motion imagery: Applications to image chain analysis
John M. Irvine et al. “Quantifying interpretability for motion imagery: Applications to image chain analysis”. In: 2007 10th International Conference on Information Fusion . 2007 10th International Conference on Information Fusion. Quebec City, QC, Canada: IEEE, July 2007, pp....
2007
-
[11]
Tailoring image compression to mission needs: Predicting NIIRS loss due to image compression
John M. Irvine et al. “Tailoring image compression to mission needs: Predicting NIIRS loss due to image compression”. In: Geospatial Informatics, Motion Imagery, and Network Analytics VIII . Geospatial Informatics, and Motion Imagery Analytics VIII. Orlando, United States: Pro...
2018 doi
-
[12]
A database of human segmented natural images and its application to evaluating segmentation algorithms and measuring ecological statistics
D. Martin et al. “A database of human segmented natural images and its application to evaluating segmentation algorithms and measuring ecological statistics”. In: Proceedings Eighth IEEE International Conference on Computer Vision. ICCV 2001 . V ol. 2. July 2001, 416–423 vol.2...
2001
-
[13]
Seeing Through the Human Reporting Bias: Visual Classifiers From Noisy Human-Centric Labels
Ishan Misra et al. “Seeing Through the Human Reporting Bias: Visual Classifiers From Noisy Human-Centric Labels”. In: Proceedings of the IEEE Conference on Computer Vision and Pattern Recognition . 2016, pp. 2930–
2016
-
[14]
Learning to Label Aerial Images from Noisy Data
V olodymyr Mnih and Geoffrey Hinton. “Learning to Label Aerial Images from Noisy Data”. In:Proceedings of the 29th International Coference on International Conference on Machine Learning . ICML’12. Edinburgh, Scotland: Omnipress, 2012, pp. 203–210. ISBN : 978-1-4503-1285-1. UR...
2012
-
[15]
AI Transformation Playbook: How to lead your company into the AI era
Andrew Ng. AI Transformation Playbook: How to lead your company into the AI era . Landing AI. Dec. 13, 2018. URL: https://landing.ai/ai-transformation-playbook/
2018
-
[16]
Deep Learning: Structuring Machine Learning Projects
Andrew Ng. Deep Learning: Structuring Machine Learning Projects . Coursera. URL: https://www.coursera. org/specializations/deep-learning
-
[17]
Comparison of two common aerial reconnaissance image quality measures
Kenneth Riehl Jr. and Lawrence A. Maver. “Comparison of two common aerial reconnaissance image quality measures”. In: SPIE’s 1996 International Symposium on Optical Science, Engineering, and Instrumentation. Proc. SPIE 2829, Airborne Reconnaissance XX. Denver, CO, Nov. 21, 199...
1996 doi
-
[18]
Evaluation of the interpretability of satellite imagery obtained from open sources of information
Piotr Walczykowski et al. “Evaluation of the interpretability of satellite imagery obtained from open sources of information”. In: XII Conference on Reconnaissance and Electronic Warfare Systems . Oltarzew, Poland: Proc. SPIE 11055, Mar. 27, 2019, p. 44. ISBN : 978-1-5106-2785...
2019 doi
-
[19]
Deep Learning for Image Super-resolution: A Survey
Zhihao Wang, Jian Chen, and Steven C. H. Hoi. “Deep Learning for Image Super-resolution: A Survey”. In: CoRR abs/1902.06068 (2019). arXiv: 1902.06068. URL: http://arxiv.org/abs/1902.06068
2019 arXiv
-
[20]
Pick-and-Learn: Automatic Quality Evaluation for Noisy-Labeled Image Segmentation
Haidong Zhu, Jialin Shi, and Ji Wu. “Pick-and-Learn: Automatic Quality Evaluation for Noisy-Labeled Image Segmentation”. In: CoRR abs/1907.11835 (2019). arXiv: 1907.11835. URL: http://arxiv.org/abs/1907. 11835. 10
2019 arXiv
-
[2939]
cv - foundation
URL: https : / / www . cv - foundation . org / openaccess / content _ cvpr _ 2016 / html / Misra _ Seeing_Through_the_CVPR_2016_paper.html
2016
Reviewed August 14, 2026 · model on record in the stance chip above.
Discussion (0). Continue with ORCID to comment.