TIME Commissioning Observations: II. On-sky Characterization and the 2D Map Data Processing Pipeline
Pith reviewed 2026-07-02 05:01 UTC · model grok-4.3
The pith
TIME instrument's data pipeline produces maps calibrated to within 3 percent of an existing galactic survey.
A machine-rendered reading of the paper's core claim, the machinery that carries it, and where it could break.
Core claim
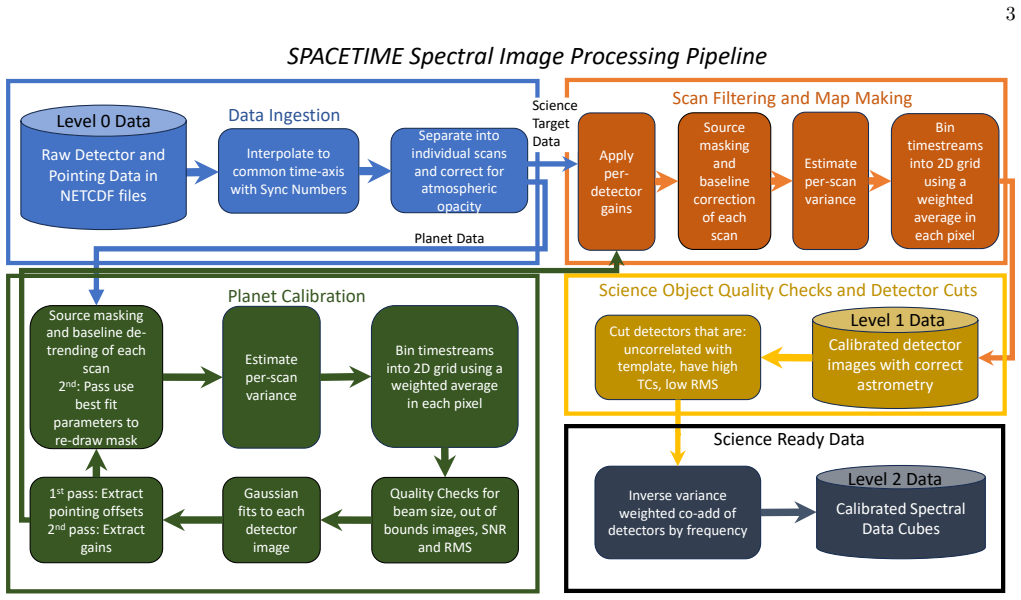
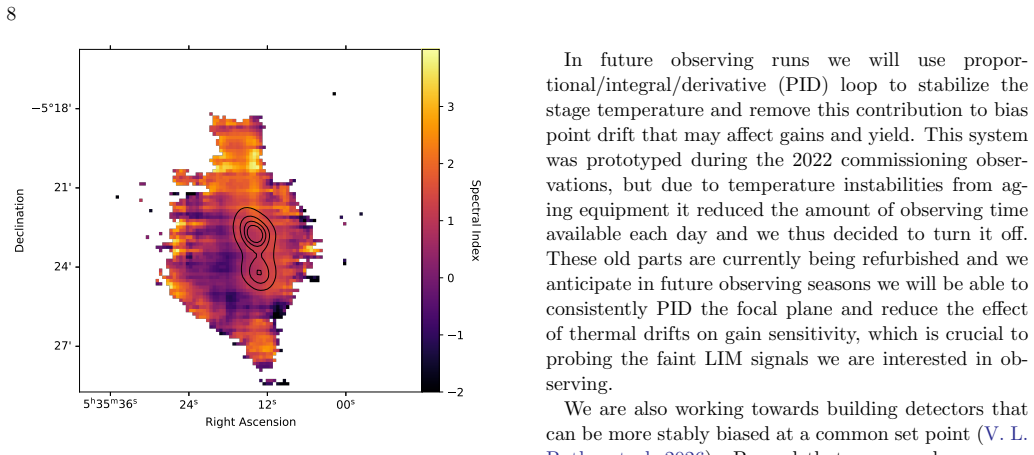
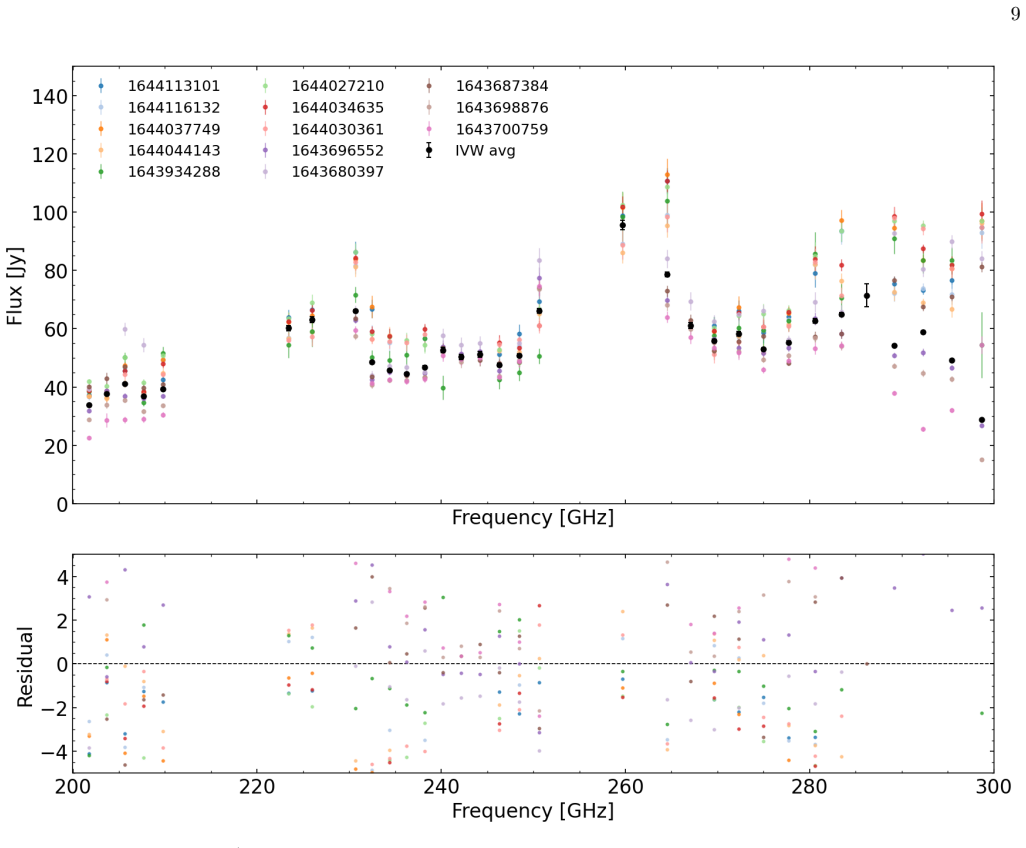
The authors describe a spectral image processing pipeline for TIME that incorporates planet observations for gain calibration and produces calibrated maps of raster scans. Application of this pipeline to observations of G49.5 yields maps whose calibration differs by less than 3 percent from the Bolocam Galactic Plane Survey, while daily OMC observations confirm instrument stability. These results establish preliminary on-sky performance and identify remaining improvements required for a line intensity mapping measurement.
What carries the argument
The spectral image processing pipeline that converts raster scan data into calibrated spectral maps using planet observations for gain calibration.
If this is right
- Daily OMC observations establish a baseline for tracking instrument stability over time.
- The pipeline enables production of calibrated maps from future TIME observations of galactic sources.
- Identified sources of improvement can be addressed before attempting the Epoch of Reionization power spectrum measurement.
Where Pith is reading between the lines
- The same pipeline approach could be tested on other intensity mapping instruments to check transferability of the calibration method.
- If the 3 percent level holds when observing fainter high-redshift fields, it would support the feasibility of detecting the [CII] power spectrum with TIME.
- Extending the comparison to additional sources or frequencies would test whether the calibration accuracy generalizes beyond G49.5.
Load-bearing premise
Planet observations supply accurate and stable gain calibration for the raster scans, and the Bolocam comparison has no large unaccounted differences in beam, frequency coverage, or processing.
What would settle it
A new G49.5 observation processed with the same pipeline that yields a calibration difference exceeding 3 percent after known differences are removed would falsify the accuracy result.
Figures
read the original abstract
The Tomographic Ionized-carbon Mapping Experiment (TIME) is a line intensity mapping (LIM) instrument that is designed to observe the power spectrum of the [CII] $158$~$\mu$m emission line during the Epoch of Reionization. TIME completed a commissioning run in 2022 at the Arizona Radio Observatory onboard the 12-M Radio Telescope at Kitt Peak, where it observed galactic sources for the first time. In this paper we report on an analysis of observations of the Orion Molecular Cloud (OMC) and G49.5 (a local HII region). The OMC observations were taken at least once a day to assess the stability of the instrument and demonstrate its on-sky performance. We describe a spectral image processing pipeline to make calibrated maps of raster scans of these sources, incorporating planet observations for gain calibration. We show with G49.5 that, when compared to the Bolocam Galactic Plane Survey, we are able to achieve a $< 3\%$ calibration difference. Based on the outcomes from this commissioning phase of TIME, we have demonstrated preliminary performance, and identified sources of improvement necessary for pursuing a LIM measurement.
Editorial analysis
A structured set of objections, weighed in public.
Referee Report
Summary. The manuscript reports on-sky commissioning observations of the TIME line intensity mapping instrument at the Arizona Radio Observatory 12m telescope. It describes observations of the Orion Molecular Cloud (OMC) for stability assessment and G49.5 for calibration validation, presents a spectral image processing pipeline for raster-scan maps that incorporates planet-based gain calibration, and claims a calibration difference of less than 3% when comparing the G49.5 maps to the Bolocam Galactic Plane Survey.
Significance. If the <3% calibration accuracy is robust after accounting for instrumental and processing differences, the result provides a concrete validation of the instrument's on-sky performance and pipeline, which is relevant for assessing readiness of TIME for future [CII] intensity mapping measurements during the Epoch of Reionization.
major comments (1)
- [G49.5 comparison / results section] The section presenting the G49.5–Bolocam comparison (referenced in the abstract and likely in the results or discussion): the <3% difference claim is load-bearing for the central performance assertion, yet the text provides no quantitative assessment or correction for differences in beam convolution, spectral bandpass overlap, or map-making filters between the TIME raster maps and the Bolocam survey; without such checks the reported accuracy cannot be verified against the skeptic's concern.
minor comments (1)
- [Abstract] The abstract and introduction would benefit from a brief statement of the telescope beam size and TIME spectral resolution to allow immediate context for the calibration claim.
Simulated Author's Rebuttal
We thank the referee for their thoughtful review and for highlighting the need for additional quantitative checks in the G49.5–Bolocam comparison. We address the major comment below and will incorporate revisions to strengthen the calibration validation.
read point-by-point responses
-
Referee: [G49.5 comparison / results section] The section presenting the G49.5–Bolocam comparison (referenced in the abstract and likely in the results or discussion): the <3% difference claim is load-bearing for the central performance assertion, yet the text provides no quantitative assessment or correction for differences in beam convolution, spectral bandpass overlap, or map-making filters between the TIME raster maps and the Bolocam survey; without such checks the reported accuracy cannot be verified against the skeptic's concern.
Authors: We agree that the manuscript as submitted lacks explicit quantitative assessments of beam convolution, spectral bandpass overlap, and map-making filter differences, which are needed to fully support the <3% calibration claim. In the revised version we will add a dedicated subsection (or expanded paragraph) in the results that (1) convolves the Bolocam map with the measured TIME beam, (2) quantifies the fractional bandpass overlap and any resulting scaling, and (3) evaluates the effect of the raster-map filters on recovered flux. These steps will be performed on the same G49.5 field and the revised difference will be reported with the associated uncertainties. We expect this addition to make the validation robust and directly responsive to the referee’s concern. revision: yes
Circularity Check
No circularity; empirical validation against external Bolocam survey
full rationale
The paper describes an observational data-processing pipeline that uses planet observations for gain calibration of raster scans and then reports an empirical <3% difference when the resulting G49.5 maps are compared to the independent Bolocam Galactic Plane Survey. No equations, fitted parameters, or derivations are present that reduce the reported calibration accuracy to the inputs by construction. The central claim rests on an external dataset rather than self-definition, self-citation chains, or renaming of known results. This is the normal non-circular outcome for a commissioning characterization paper.
Axiom & Free-Parameter Ledger
axioms (1)
- domain assumption Planet observations can be used for accurate gain calibration of spectral maps
Reference graph
Works this paper leans on
-
[1]
Aguirre, J. E., Ginsburg, A. G., Dunham, M. K., et al. 2011, ApJS, 192, 4, doi: 10.1088/0067-0049/192/1/4
-
[2]
Bally, J. 2008, in Handbook of Star Forming Regions, Volume I, ed. B. Reipurth, Vol. 4, 459, doi: 10.48550/arXiv.0812.0046
work page internal anchor Pith review Pith/arXiv arXiv doi:10.48550/arxiv.0812.0046 2008
-
[3]
S., Amiri, M., Burger, B., et al
Battistelli, E. S., Amiri, M., Burger, B., et al. 2008, Journal of Low Temperature Physics, 151, 908, doi: 10.1007/s10909-008-9772-z
-
[4]
L., Crites, A
Butler, V. L., Crites, A. T., Berek, S., et al. 2024, in
2024
-
[5]
Millimeter, Submillimeter, and Far-Infrared Detectors and Instrumentation for Astronomy XII, ed. J. Zmuidzinas & J.-R. Gao, Vol. 13102, International Society for Optics and Photonics (SPIE), 131022G, doi: 10.1117/12.3021442
-
[6]
Butler, V. L., Bock, J. J., Chung, D. T., et al. 2026, IEEE Transactions on Applied Superconductivity, 36, 2103507, doi: 10.1109/TASC.2026.3694584
-
[7]
Carpenter, J. M., & Sanders, D. B. 1998, AJ, 116, 1856, doi: 10.1086/300534 CASA Team, Bean, B., Bhatnagar, S., et al. 2022, PASP, 134, 114501, doi: 10.1088/1538-3873/ac9642
-
[8]
Chung, D. T., Viero, M. P., Church, S. E., & Wechsler, R. H. 2020, ApJ, 892, 51, doi: 10.3847/1538-4357/ab798f
-
[9]
Crites, A. T., Bock, J. J., Bradford, C. M., et al. 2014, in Society of Photo-Optical Instrumentation Engineers (SPIE) Conference Series, Vol. 9153, Millimeter, Submillimeter, and Far-Infrared Detectors and Instrumentation for Astronomy VII, ed. W. S. Holland & J. Zmuidzinas, 91531W, doi: 10.1117/12.2057207 D´ esert, F.-X., Mac´ ıas-P´ erez, J. F., Beelen...
-
[10]
2021, PASJ, 73, S172, doi: 10.1093/pasj/psz028
Fujita, S., Torii, K., Kuno, N., et al. 2021, PASJ, 73, S172, doi: 10.1093/pasj/psz028
-
[11]
2020, PhD thesis, California Institute of
Hunacek, J. 2020, PhD thesis, California Institute of
2020
-
[12]
Hunacek, J., Bock, J., Bradford, C. M., et al. 2018, Journal of Low Temperature Physics, 193, 893, doi: 10.1007/s10909-018-1906-3
-
[13]
Astrophysics and Cosmology with Line-Intensity Mapping
Kovetz, E., Breysse, P. C., Lidz, A., et al. 2019, BAAS, 51, 101, doi: 10.48550/arXiv.1903.04496
work page internal anchor Pith review Pith/arXiv arXiv doi:10.48550/arxiv.1903.04496 2019
-
[14]
M., Crites, A., et al
Li, C.-T., Bradford, C. M., Crites, A., et al. 2018, in
2018
-
[15]
Millimeter, Submillimeter, and Far-Infrared Detectors and Instrumentation for Astronomy IX, ed. J. Zmuidzinas & J.-R. Gao, Vol. 10708, International Society for Optics and Photonics (SPIE), 107083F, doi: 10.1117/12.2311415
-
[16]
Lim, W., & De Buizer, J. M. 2019, ApJ, 873, 51, doi: 10.3847/1538-4357/ab0288 11
-
[17]
Mayer, E. C., Lowe, I. N., Marrone, D. P., et al. 2025, arXiv e-prints, arXiv:2511.09446, doi: 10.48550/arXiv.2511.09446
work page internal anchor Pith review Pith/arXiv arXiv doi:10.48550/arxiv.2511.09446 2025
-
[18]
2022, am: Microwave through submillimeter-wave propagation tool for the terrestrial atmosphere,, Astrophysics Source Code Library, record ascl:2205.002 http://ascl.net/2205.002
Paine, S. 2022, am: Microwave through submillimeter-wave propagation tool for the terrestrial atmosphere,, Astrophysics Source Code Library, record ascl:2205.002 http://ascl.net/2205.002
2022
-
[19]
Park, R. S., Folkner, W. M., Williams, J. G., & Boggs, D. H. 2021, AJ, 161, 105, doi: 10.3847/1538-3881/abd414
-
[20]
Sayers, J., Golwala, S. R., Ade, P. A. R., et al. 2010, ApJ, 708, 1674, doi: 10.1088/0004-637X/708/2/1674
-
[21]
2024, MNRAS, 528, 4582, doi: 10.1093/mnras/stae270
Sugiyama, J., Nishino, H., & Kusaka, A. 2024, MNRAS, 528, 4582, doi: 10.1093/mnras/stae270
-
[22]
Sun, G., Chang, T.-C., Uzgil, B. D., et al. 2021, ApJ, 915, 33, doi: 10.3847/1538-4357/abfe62
-
[23]
2005, A&A, 430, 523, doi: 10.1051/0004-6361:20035943
Thaddeus, P. 2005, A&A, 430, 523, doi: 10.1051/0004-6361:20035943
-
[24]
Wood-Vasey, W. M., Perrefort, D., & Baker, A. D. 2022, AJ, 163, 283, doi: 10.3847/1538-3881/ac63bb
-
[25]
Yang, S. F., McAtee, S. M., Vaughan, B. J., et al. 2026, ApJ, 1003, 23, doi: 10.3847/1538-4357/ae606c
discussion (0)
Sign in with ORCID, Apple, or X to comment. Anyone can read and Pith papers without signing in.