REVIEW 3 major objections 6 minor 44 references
A Variational Information Theoretic Approach to Out-of-Distribution Detection
T0 review · 3 major / 6 minor · reviewed 2026-08-07 · deepseek-v4-flash
Pith's one-line read A variational information-theoretic loss defines OOD detection features as optimal random features, and predicts a piecewise-linear shaping function that outperforms element-wise baselines.
desk verdict A serious theory paper whose empirical confirmation is weaker than claimed, but the framework is worth engaging with. read the letter →
The pith
A machine-rendered reading of the paper's core claim, the machinery that carries it, and where it could break.
The reading
What carries the argument
The load-bearing object is the loss functional defined on the conditional feature distribution $p(\tilde z|z)$, with the Markov chain $Y \to X \to Z \to \tilde Z$ supplying the structure for both terms. The KL term forces the distributions of the shaped feature under ID ($Y=0$) and OOD ($Y=1$) apart; the Information Bottleneck term $I(Z;\tilde Z)-\beta I(\tilde Z;Y)$ prevents the separation from discarding OOD-relevant information, and without it the KL-only objective is ill-posed. The technical machinery is variational: Theorem 3.1 gives the gradient of both terms with respect to $p(\tilde z|z)$, Theorem 3.2 converts that into gradients for the mean $\mu(z)$ and conditional standard deviation $\sigma_c(z)$ of a Gaussian random feature, and the elementwise factorization reduces the infinite-dimensional problem to independent 1D optimizations. The output that reaches practice is the mean curve $\mu(z)$, which the paper fits into a piecewise-linear family and tunes on validation OOD data before applying the same scalar function to every feature coordinate.
What would settle it
On a real pretrained network, fit the true per-channel (or joint) distributions of penultimate-layer features for ID and OOD validation data, run Algorithm 1 separately per channel, and compare the resulting mean shaping curves with the single shared piecewise-linear function. If the shared scalar curve stays near-optimal despite strong channel-to-channel differences and correlation, the factorization is not load-bearing; if per-channel optima differ widely and the shared curve degrades on the OOD benchmarks, the elementwise-independence premise is doing the work that the theory attributes to the variational loss.
Extended reading notes
Core claim
The central claim is that the right target for OOD feature design is the variational problem $$L(p(\tilde z|z)) = -D_{\mathrm{KL}}(p(\tilde z|z)) + \$\alpha$\,\mathrm{IB}(p(\tilde z|z)),$$ where the first term is the symmetrized KL divergence between the feature densities under ID and OOD data and the second is the Information Bottleneck $I(Z;\tilde Z) - \beta I(\tilde Z;Y)$. Because optimizing over distributions is infinite-dimensional, the paper derives gradient formulas by the calculus of variations and then restricts $p(\tilde z|z)$ to Gaussian random features $\mathcal{N}(\mu(z), \sigma_c(z))$, so the deterministic shaping functions used in the literature become the mean of a random feature. Under the elementwise-independence assumptions of Section 3.1, each component obeys the same 1D optimization, and the optimized mean follows a piecewise-linear family whose shape depends on the OOD distribution: Gaussian OOD gives a positive slope for small $|z|$ with clipping or negative slope at large $|z|$, while heavier-tailed Laplacian and inverse-Gaussian OOD give suppression of small values plus clipping of large values. The paper concludes that ReAct, VRA, and ASH correspond to different implicit distributional assumptions and regularization levels, and that a tuned member of the piecewise-linear family achieves the best FPR95 and AUROC among elementwise feature-shaping methods on the ImageNet-1k and CIFAR-10/100 benchmarks tested.
Load-bearing premise
The derivation assumes the feature components are conditionally independent and identically distributed given the in/out label and are processed by one shared scalar function; real penultimate-layer features are correlated and heterogeneous, and the paper's own Appendix H shows empirical feature distributions with heavy mass at zero and skew that depart from the assumed Gaussian and Laplacian forms.
Editorial extensions
If this is right
- Existing shaping rules are explained rather than assumed: ReAct-style clipping corresponds to high Information Bottleneck regularization under Gaussian-like OOD data, while VRA- and ASH-style suppression of small values corresponds to heavier-tailed OOD distributions.
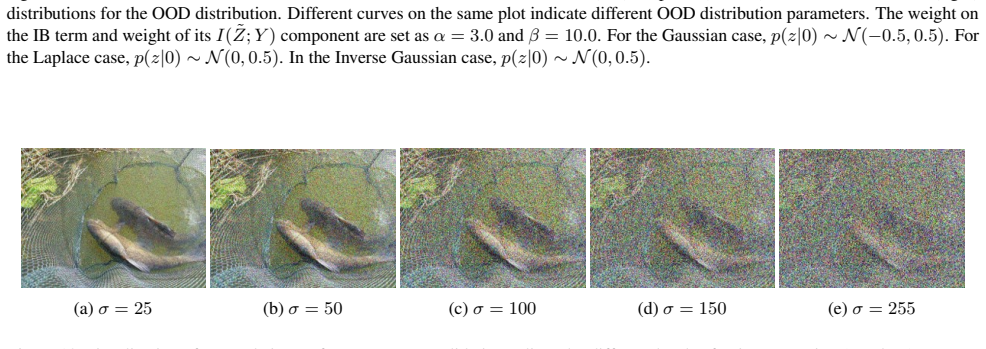
- Noisier OOD data should be met with stronger IB regularization, which flattens the shaping function; the paper's additive-Gaussian-noise experiment shows that optimal shaping functions at higher noise levels have lower IB.
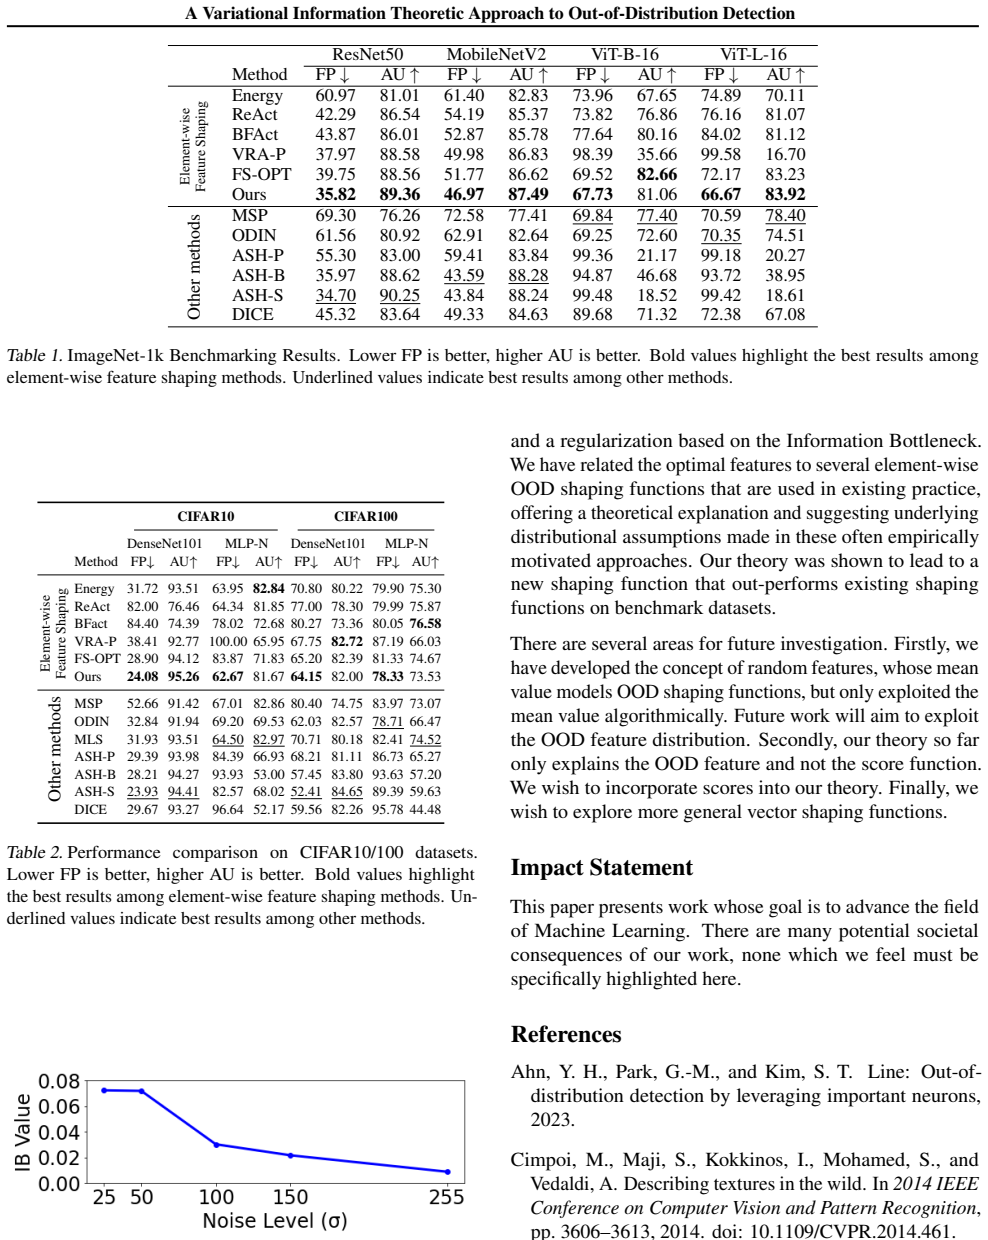
- The piecewise-linear family, tuned by minimizing FPR95 on validation OOD data, reaches the best results among elementwise feature-shaping methods on the ImageNet-1k and CIFAR-10/100 benchmarks across ResNet-50, MobileNet-V2, ViT-B-16, and ViT-L-16.
- The framework generates new features by choosing an assumed OOD distribution: different distributional assumptions yield different shaping curves, so new detection rules can be designed by assumption rather than by hand.
- The optimized conditional standard deviation is nonzero in every simulation reported, which implies random (not purely deterministic) feature shaping is preferable under the loss, leaving information on the table in current deterministic methods.
Reading between the lines
- The paper exploits only the mean of the random feature; since the optimized $\sigma_c(z)$ is reported nonzero in all simulations, a natural extension the authors leave implicit is to build OOD scores from the variance or from samples of the predicted feature distribution.
- Because Laplacian and inverse-Gaussian OOD assumptions produce suppression of small values, a practical selection rule follows: estimate the tail-heaviness of expected OOD activations and choose a clipping-style or pruning-style member of the piecewise-linear family accordingly.
- The inverse-Gaussian model is constructed to place mass where the Gaussian ID distribution has little mass, which suits noise-like OOD inputs but is less clearly suited to semantic shift in which new classes activate overlapping feature directions; testing the same variational loss on a semantic-shift OOD model would delimit the family's reach.
- Appendix H shows several benchmarks whose empirical feature distributions depart from the paper's assumed forms, yet the method still performs well, suggesting the piecewise-linear shape is more robust than its derivation; a deliberate stress test with increasingly correlated or multimodal features would show where that robustness ends.
Editorial analysis
A structured set of objections, weighed in public.
Referee Report
Summary. The paper proposes a variational information-theoretic framework for designing OOD detection features. The loss combines a symmetrized KL divergence between ID and OOD feature distributions with an Information Bottleneck regularizer. Using calculus of variations, the authors derive gradients and, under element-wise independence assumptions, reduce the problem to 1D per-component optimization. Based on simulations with Gaussian, Laplacian, and Inverse-Gaussian OOD assumptions, they observe that optimal mean shaping functions fall into a piecewise-linear family, and they propose a new shaping function from this family whose hyperparameters are tuned on OOD validation data. Experiments on ImageNet and CIFAR benchmarks show that the new function achieves state-of-the-art results among element-wise feature shaping methods.
Significance. If the predictive claim is sustained, the framework would be a valuable step toward principled, explainable OOD feature design, unifying several existing rule-based methods (ReAct, VRA, ASH) as special cases under different distributional assumptions. The paper contains substantial technical contributions: detailed calculus-of-variations derivations (Appendix C), a closed-form 1D Gaussian analysis (Appendix A) showing the loss is well-posed, and high-quality benchmarks across multiple architectures. The explicit acknowledgment of distribution-mismatch cases (Appendix H) is a strength. However, the link between the theory and the evaluated method is currently qualitative: the tested function is a seven-parameter spline tuned on the OOD validation set, so the experiments do not yet demonstrate that the theory-predicted shape—rather than the flexibility of the family—drives the performance gains.
major comments (3)
- [Section 5, Table 3, Figure 4] The central claim that the theory predicts a new shaping function is not fully supported. The deployed method is a seven-parameter piecewise linear function whose parameters (y0, y1a, z1, y1b, m1, z2, m2) are tuned by Bayesian optimization on the OOD validation split to minimize FPR95 (Section 5, Table 3). The theory constrains only the coarse qualitative form in Figure 4; no parameter value is predicted. To substantiate the prediction claim, the paper should include an ablation that tunes a generic flexible family (e.g., a cubic spline or a piecewise linear function with the same number of knots but no theory-derived shape) on the same validation data and compare performance. If the generic spline performs equally well, the gains cannot be attributed to the theory; if the theory-predicted shape is better, the claim is strengthened.
- [Section 3.1, Appendix B, Appendix H] The element-wise independence assumption (p(˜z|z) = ∏ p(˜z_i|z_i) and p(z|y) = ∏ p(z_i|y)) is load-bearing because it justifies applying the same scalar shaping function to all feature components. The paper acknowledges this as a simplification, but Appendix H shows that real penultimate-layer features depart from the assumed forms (e.g., heavy zero mass, skew, different distribution families across datasets). As the derivation in Appendix B relies on factorization, the formal optimality result does not apply to correlated, non-identically distributed features. Please add a discussion or experiment addressing this gap, e.g., by comparing the single scalar function against per-dimension tuned functions, or by applying the method after whitening/decorrelating features and showing the impact on performance.
- [Section 5, Section 6] The theory's direct prescriptive case—where ID/OOD distributions are known and Algorithm 1 is run to compute the optimal mean function—is never evaluated. The experiments only use the unknown-distribution case with the fitted piecewise family (Section 5). Reporting results for the known-distribution case (using estimated or ground-truth distributions from the simulations in Section 4) would provide a direct test of whether the variational optimization yields a competitive shaping function, and would help separate the theory's predictive power from the fitted family's flexibility.
minor comments (6)
- [Abstract and Section 6] The claim that the method 'out-performs existing ones' is overbroad when ASH variants are included; for example, in Table 1 (ResNet-50) ASH-S achieves FP=34.70 vs Ours=35.82, and in Table 2 (CIFAR100/DenseNet) ASH-S achieves FP=52.41 vs Ours=64.15. The body properly qualifies the comparison to element-wise feature shaping methods; the abstract should do the same.
- [Appendix A, Figure 6 caption] The caption states 'L = DKL + αIB where α = 0.5', which contradicts the main-text definition L = -D_KL + α·IB (Eq. 5) and the appendix's own derivation (which uses α=1). Please correct the sign and the value.
- [Algorithm 1] In the expression for ∇p(˜z|z)L(˜z_i^j, z_i), the term 'l(zi)-1' should be typeset as l(zi)^{-1} to match Theorem 3.1; the current formatting is ambiguous.
- [Table 2] The method name 'BFact' is inconsistent with 'BFAct' used in Table 1 and the text.
- [Section 1.1] The parenthetical '(Zhang et al.)' is ambiguous because the bibliography contains two distinct Zhang entries; please cite the specific paper (e.g., Zhang, Lu, Peng, Fang, and Cheung, 2024).
- [Section 6, 'Regularization as a Function of OOD Data'] This subsection reports only qualitative plots; please include quantitative results (e.g., FPR95 vs noise level) to support the claim that higher noise requires stronger IB regularization.
Circularity Check
The 'predicted' shaping function is a seven-parameter spline tuned on OOD validation data, so the benchmark gains reflect fitted flexibility rather than a parameter-free theoretical forecast.
-
fitted input called prediction
[Section 4 (Piecewise Linear Shaping); Section 5 (Implementation of New OOD Detection); Abstract]
"The above mean shaping functions (from Gaussian, Laplace and Inverse Gaussian OOD distributions) all approximately fit in a particular piecewise linear function family as shown in Figure 4, where z1, z2, y0, y1a, y1b, m1, m2 are hyperparameters. ... The hyper-parameters for the piecewise family are tuned by e.g., minimizing the false positive rate at true positive rate of 95% (FPR95) metric on the validation set - this gives the optimal shaping function µ*."
The abstract's load-bearing claim is that 'our theory can predict a new shaping function that out-performs existing ones on OOD benchmarks.' But the function whose performance is reported is not a specific theoretical prediction: it is a seven-parameter piecewise-linear family admitted post hoc because simulated optimizers 'approximately fit' it, and none of its parameter values are fixed by the variational derivation. The concrete µ* used in Tables 1 and 2 is obtained by Bayesian optimization of the FPR95 metric on an OOD validation set (Gaussian-noise images for ImageNet, an iSUN subset for CIFAR), so the same criterion that defines the method is fitted before being reported on test OOD sets.
full rationale
The variational derivation itself is not circular: the loss functional (5), the gradient theorems in Section 3.2, and the Gaussian random-feature model are stated independently of the benchmark results, and the simulations in Section 4 genuinely illustrate qualitative properties such as clipping, suppression of small values, and negative slopes. The paper also honestly acknowledges in Appendix H that some empirical feature distributions do not match its Gaussian/Laplacian/IG assumptions. The central circularity risk is confined to the benchmark claim. The Figure 4 family is introduced as an approximation that 'approximately encompasses' simulated optimizers, and Section 5 states that its seven hyperparameters are tuned by minimizing FPR95 on validation OOD data before the same metric is reported on test OOD data. Consequently, Tables 1 and 2 cannot separate 'the theory predicted the correct shape' from 'a flexible seven-parameter spline tuned on validation OOD performs well.' That is the fitted-input-called-prediction pattern, and it is the only substantial circularity found. The element-wise independence factorization of Section 3.1 is an explicit assumption whose realism is questionable, but an unrealistic assumption is a correctness risk, not a circular step. There are no load-bearing self-citations or author-imported uniqueness theorems, so the score is 6 rather than higher.
Assumptions & free parameters
free parameters (4)
- α (IB weight in loss L = -D_KL + α·IB) =
1.0 or 3.0 in Section 4 simulations; not tuned in final method
- β (weight on -I(˜Z;Y) within IB) =
10 in most simulations, varied in Appendix E.1
- Piecewise-linear shaping hyperparameters (y0, y1a, z1, y1b, m1, z2, m2) =
Per-model values in Table 3, e.g., ResNet-50 ImageNet: 0.0, 0.0, 0.52, 0.73, 0.61, 1.2, -0.3
- Section 4 simulation distribution parameters (µ0, µ1, σ; Laplace b; IG µ1, λ) =
e.g., µ0=-0.5, µ1=0.5, σ=0.5; Lap(0,1); IG(d(z);3.3,15)
assumptions (5)
- domain assumption Markov chain Y → X → Z → ˜Z holds
- domain assumption Element-wise independence and identical conditional distributions: p(˜z|z)=∏ p(˜zi|zi) and p(z|y)=∏ p(zi|y)
- domain assumption OOD feature conditional distribution is Gaussian: p(˜z|z) ~ N(µ(z), σc(z))
- domain assumption ID features are Gaussian and OOD features are Gaussian, Laplacian, or Inverse Gaussian in the theoretical study
- domain assumption Validation OOD sets (Gaussian noise for ImageNet; iSUN subset for CIFAR) are representative of test OOD data
Cite this review
Pith. "Pith review of A Variational Information Theoretic Approach to Out-of-Distribution Detection." pith.science (2026). https://pith.science/paper/KYH36PTQ
@misc{pith2026250614194,
  author       = {Pith},
  title        = {Pith review of: A Variational Information Theoretic Approach to Out-of-Distribution Detection},
  year         = {2026},
  howpublished = {\url{https://pith.science/paper/KYH36PTQ}},
  note         = {Machine review of arXiv:2506.14194}
}
read the original abstract
We present a theory for the construction of out-of-distribution (OOD) detection features for neural networks. We introduce random features for OOD through a novel information-theoretic loss functional consisting of two terms, the first based on the KL divergence separates resulting in-distribution (ID) and OOD feature distributions and the second term is the Information Bottleneck, which favors compressed features that retain the OOD information. We formulate a variational procedure to optimize the loss and obtain OOD features. Based on assumptions on OOD distributions, one can recover properties of existing OOD features, i.e., shaping functions. Furthermore, we show that our theory can predict a new shaping function that out-performs existing ones on OOD benchmarks. Our theory provides a general framework for constructing a variety of new features with clear explainability.
Figures


Figures from the paper (12 more)





Reference graph
Works this paper leans on
-
[1]
write newline
" write newline "" before.all 'output.state := FUNCTION n.dashify 't := "" t empty not t #1 #1 substring "-" = t #1 #2 substring "--" = not "--" * t #2 global.max substring 't := t #1 #1 substring "-" = "-" * t #2 global.max substring 't := while if t #1 #1 substring * t #2 global.max substring 't := if while FUNCTION format.date year duplicate empty "emp...
-
[2]
Ahn, Y. H., Park, G.-M., and Kim, S. T. Line: Out-of-distribution detection by leveraging important neurons, 2023
work page 2023
-
[3]
Describing textures in the wild
Cimpoi, M., Maji, S., Kokkinos, I., Mohamed, S., and Vedaldi, A. Describing textures in the wild. In 2014 IEEE Conference on Computer Vision and Pattern Recognition, pp.\ 3606--3613, 2014. doi:10.1109/CVPR.2014.461
-
[4]
Cover, T. M. Elements of information theory. John Wiley & Sons, 1999
work page 1999
-
[5]
The mnist database of handwritten digit images for machine learning research [best of the web]
Deng, L. The mnist database of handwritten digit images for machine learning research [best of the web]. IEEE Signal Processing Magazine, 29 0 (6): 0 141--142, 2012. doi:10.1109/MSP.2012.2211477
arXiv 2012
-
[6]
DeVries, T. and Taylor, G. W. Learning confidence for out-of-distribution detection in neural networks, 2018
work page 2018
-
[7]
Extremely simple activation shaping for out-of-distribution detection
Djurisic, A., Bozanic, N., Ashok, A., and Liu, R. Extremely simple activation shaping for out-of-distribution detection. 2022. URL https://arxiv.org/abs/2209.09858
arXiv 2022
-
[8]
An image is worth 16x16 words: Transformers for image recognition at scale, 2021
Dosovitskiy, A., Beyer, L., Kolesnikov, A., Weissenborn, D., Zhai, X., Unterthiner, T., Dehghani, M., Minderer, M., Heigold, G., Gelly, S., Uszkoreit, J., and Houlsby, N. An image is worth 16x16 words: Transformers for image recognition at scale, 2021. URL https://arxiv.org/abs/2010.11929
arXiv 2021
Show all 44 references
-
[9]
u gner, D., and G \
Elflein, S., Charpentier, B., Z \"u gner, D., and G \"u nnemann, S. On out-of-distribution detection with energy-based models. arXiv preprint arXiv:2107.08785, 2021
2021 arXiv
-
[10]
Exploring the limits of out-of-distribution detection
Fort, S., Ren, J., and Lakshminarayanan, B. Exploring the limits of out-of-distribution detection. In Ranzato, M., Beygelzimer, A., Dauphin, Y., Liang, P., and Vaughan, J. W. (eds.), Advances in Neural Information Processing Systems, volume 34, pp.\ 7068--7081. Curran Associat...
2021
-
[11]
Exploring the limits of out-of-distribution detection
Fort, S., Ren, J., and Lakshminarayanan, B. Exploring the limits of out-of-distribution detection. Advances in neural information processing systems, 34: 0 7068--7081, 2021 b
2021
-
[12]
Frazier, P. I. A tutorial on bayesian optimization, 2018. URL https://arxiv.org/abs/1807.02811
2018 arXiv
-
[13]
Identity mappings in deep residual networks
He, K., Zhang, X., Ren, S., and Sun, J. Identity mappings in deep residual networks. In Leibe, B., Matas, J., Sebe, N., and Welling, M. (eds.), Computer Vision -- ECCV 2016, pp.\ 630--645, Cham, 2016. Springer International Publishing
2016
-
[15]
and Gimpel, K
Hendrycks, D. and Gimpel, K. A baseline for detecting misclassified and out-of-distribution examples in neural networks, 2018 b . URL https://arxiv.org/abs/1610.02136
2018 arXiv
-
[16]
Natural adversarial examples
Hendrycks, D., Zhao, K., Basart, S., Steinhardt, J., and Song, D. Natural adversarial examples. In Proceedings of the IEEE/CVF Conference on Computer Vision and Pattern Recognition (CVPR), pp.\ 15262--15271, June 2021
2021
-
[17]
Scaling out-of-distribution detection for real-world settings, 2022
Hendrycks, D., Basart, S., Mazeika, M., Zou, A., Kwon, J., Mostajabi, M., Steinhardt, J., and Song, D. Scaling out-of-distribution detection for real-world settings, 2022. URL https://arxiv.org/abs/1911.11132
2022 arXiv
-
[18]
V., Aodha, O
Horn, G. V., Aodha, O. M., Song, Y., Cui, Y., Sun, C., Shepard, A., Adam, H., Perona, P., and Belongie, S. The inaturalist species classification and detection dataset, 2018. URL https://arxiv.org/abs/1707.06642
2018 arXiv
-
[19]
Kirichenko, P., Izmailov, P., and Wilson, A. G. Why normalizing flows fail to detect out-of-distribution data. Advances in neural information processing systems, 33: 0 20578--20589, 2020
2020
-
[20]
and Li, H
Kong, H. and Li, H. Bfact: Out-of-distribution detection with butterworth filter rectified activations. In Sun, F., Cangelosi, A., Zhang, J., Yu, Y., Liu, H., and Fang, B. (eds.), Cognitive Systems and Information Processing, pp.\ 115--129, Singapore, 2023. Springer Nature Singapore
2023
-
[21]
A simple unified framework for detecting out-of-distribution samples and adversarial attacks
Lee, K., Lee, K., Lee, H., and Shin, J. A simple unified framework for detecting out-of-distribution samples and adversarial attacks. Advances in neural information processing systems, 31, 2018
2018
-
[22]
Enhancing the reliability of out-of-distribution image detection in neural networks, 2020
Liang, S., Li, Y., and Srikant, R. Enhancing the reliability of out-of-distribution image detection in neural networks, 2020. URL https://arxiv.org/abs/1706.02690
2020 arXiv
-
[23]
D., and Li, Y
Liu, W., Wang, X., Owens, J. D., and Li, Y. Energy-based out-of-distribution detection, 2021. URL https://arxiv.org/abs/2010.03759
2021 arXiv
-
[24]
Netzer, Y., Wang, T., Coates, A., Bissacco, A., Wu, B., and Ng, A. Y. Reading digits in natural images with unsupervised feature learning. In NIPS Workshop on Deep Learning and Unsupervised Feature Learning 2011, 2011. URL http://ufldl.stanford.edu/housenumbers/nips2011_housen...
2011
-
[25]
J., Fertig, E., Snoek, J., Poplin, R., Depristo, M., Dillon, J., and Lakshminarayanan, B
Ren, J., Liu, P. J., Fertig, E., Snoek, J., Poplin, R., Depristo, M., Dillon, J., and Lakshminarayanan, B. Likelihood ratios for out-of-distribution detection. Advances in neural information processing systems, 32, 2019
2019
-
[26]
C., and Fei-Fei, L
Russakovsky, O., Deng, J., Su, H., Krause, J., Satheesh, S., Ma, S., Huang, Z., Karpathy, A., Khosla, A., Bernstein, M., Berg, A. C., and Fei-Fei, L. Imagenet large scale visual recognition challenge, 2015. URL https://arxiv.org/abs/1409.0575
2015 arXiv
-
[27]
Mobilenetv2: Inverted residuals and linear bottlenecks
Sandler, M., Howard, A., Zhu, M., Zhmoginov, A., and Chen, L.-C. Mobilenetv2: Inverted residuals and linear bottlenecks. In 2018 IEEE/CVF Conference on Computer Vision and Pattern Recognition, pp.\ 4510--4520, 2018. doi:10.1109/CVPR.2018.00474
2018
-
[28]
and Li, Y
Sun, Y. and Li, Y. Dice: Leveraging sparsification for out-of-distribution detection. In European Conference on Computer Vision, 2022
2022
-
[29]
React: Out-of-distribution detection with rectified activations
Sun, Y., Guo, C., and Li, Y. React: Out-of-distribution detection with rectified activations. Advances in Neural Information Processing Systems, 34: 0 144--157, 2021
2021
-
[30]
Out-of-distribution detection with deep nearest neighbors
Sun, Y., Ming, Y., Zhu, X., and Li, Y. Out-of-distribution detection with deep nearest neighbors. In International Conference on Machine Learning, pp.\ 20827--20840. PMLR, 2022
2022
-
[31]
C., and Bialek, W
Tishby, N., Pereira, F. C., and Bialek, W. The information bottleneck method. arXiv preprint physics/0004057, 2000
2000 arXiv
-
[32]
Torralba, A., Fergus, R., and Freeman, W. T. 80 million tiny images: A large data set for nonparametric object and scene recognition. IEEE Transactions on Pattern Analysis and Machine Intelligence, 30 0 (11): 0 1958--1970, 2008. doi:10.1109/TPAMI.2008.128
1958 doi
-
[33]
Troutman, J. L. Variational calculus and optimal control: optimization with elementary convexity. Springer Science & Business Media, 2012
2012
-
[34]
Vim: Out-of-distribution with virtual-logit matching, 2022
Wang, H., Li, Z., Feng, L., and Zhang, W. Vim: Out-of-distribution with virtual-logit matching, 2022. URL https://arxiv.org/abs/2203.10807
2022 arXiv
-
[35]
Energy-based out-of-distribution detection for graph neural networks
Wu, Q., Chen, Y., Yang, C., and Yan, J. Energy-based out-of-distribution detection for graph neural networks. arXiv preprint arXiv:2302.02914, 2023
2023 arXiv
-
[36]
A., Oliva, A., and Torralba, A
Xiao, J., Hays, J., Ehinger, K. A., Oliva, A., and Torralba, A. Sun database: Large-scale scene recognition from abbey to zoo. In 2010 IEEE Computer Society Conference on Computer Vision and Pattern Recognition, pp.\ 3485--3492, 2010. doi:10.1109/CVPR.2010.5539970
2010
-
[37]
Vra: Variational rectified activation for out-of-distribution detection, 2023
Xu, M., Lian, Z., Liu, B., and Tao, J. Vra: Variational rectified activation for out-of-distribution detection, 2023. URL https://arxiv.org/abs/2302.11716
2023 arXiv
-
[38]
A., Zhang, Y., Finkelstein, A., Kulkarni, S
Xu, P., Ehinger, K. A., Zhang, Y., Finkelstein, A., Kulkarni, S. R., and Xiao, J. Turkergaze: Crowdsourcing saliency with webcam based eye tracking, 2015. URL https://arxiv.org/abs/1504.06755
2015 arXiv
-
[39]
Generalized out-of-distribution detection: A survey, 2022
Yang, J., Zhou, K., Li, Y., and Liu, Z. Generalized out-of-distribution detection: A survey, 2022
2022
-
[40]
Lsun: Construction of a large-scale image dataset using deep learning with humans in the loop, 2016
Yu, F., Seff, A., Zhang, Y., Song, S., Funkhouser, T., and Xiao, J. Lsun: Construction of a large-scale image dataset using deep learning with humans in the loop, 2016. URL https://arxiv.org/abs/1506.03365
2016 arXiv
-
[41]
Learning to shape in-distribution feature space for out-of-distribution detection
Zhang, Y., Lu, J., Peng, B., Fang, Z., and Cheung, Y.-m. Learning to shape in-distribution feature space for out-of-distribution detection. In The Thirty-eighth Annual Conference on Neural Information Processing Systems
-
[42]
Learning to shape in-distribution feature space for out-of-distribution detection
Zhang, Y., Lu, J., Peng, B., Fang, Z., and ming Cheung, Y. Learning to shape in-distribution feature space for out-of-distribution detection. In The Thirty-eighth Annual Conference on Neural Information Processing Systems, 2024. URL https://openreview.net/forum?id=1Du3mMP5YN
2024
-
[43]
and Xiang, X
Zhang, Z. and Xiang, X. Decoupling maxlogit for out-of-distribution detection. In 2023 IEEE/CVF Conference on Computer Vision and Pattern Recognition (CVPR), pp.\ 3388--3397, 2023. doi:10.1109/CVPR52729.2023.00330
2023
-
[44]
Towards optimal feature-shaping methods for out-of-distribution detection
Zhao, Q., Xu, M., Gupta, K., Asthana, A., Zheng, L., and Gould, S. Towards optimal feature-shaping methods for out-of-distribution detection. arXiv preprint arXiv:2402.00865, 2024
2024 arXiv
-
[45]
Places: A 10 million image database for scene recognition
Zhou, B., Lapedriza, A., Khosla, A., Oliva, A., and Torralba, A. Places: A 10 million image database for scene recognition. IEEE Transactions on Pattern Analysis and Machine Intelligence, 40 0 (6): 0 1452--1464, 2018. doi:10.1109/TPAMI.2017.2723009
2018
Reviewed August 7, 2026 · model on record in the stance chip above.
Discussion (0). Sign in to comment.