REVIEW 3 major objections 6 minor 51 references
Adaptive Segmentation of Knee Radiographs for Selecting the Optimal ROI in Texture Analysis
T0 review · 3 major / 6 minor · reviewed 2026-08-14 · deepseek-v4-flash
Pith's one-line read An automatically segmented medial-tibia region improves knee OA detection from radiograph texture over a fixed rectangular ROI.
desk verdict The external OAI-to-MOST validation is genuine and the central finding survives — but the deployed ROI is a fixed group-average mask, not an adaptive per-subject segmentation, and the OAI headline gains are selection-fitted; worth engaging, worth revising. read the letter →
The pith
A machine-rendered reading of the paper's core claim, the machinery that carries it, and where it could break.
The reading
What carries the argument
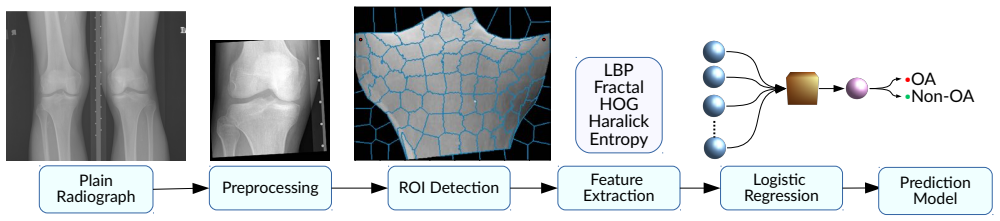
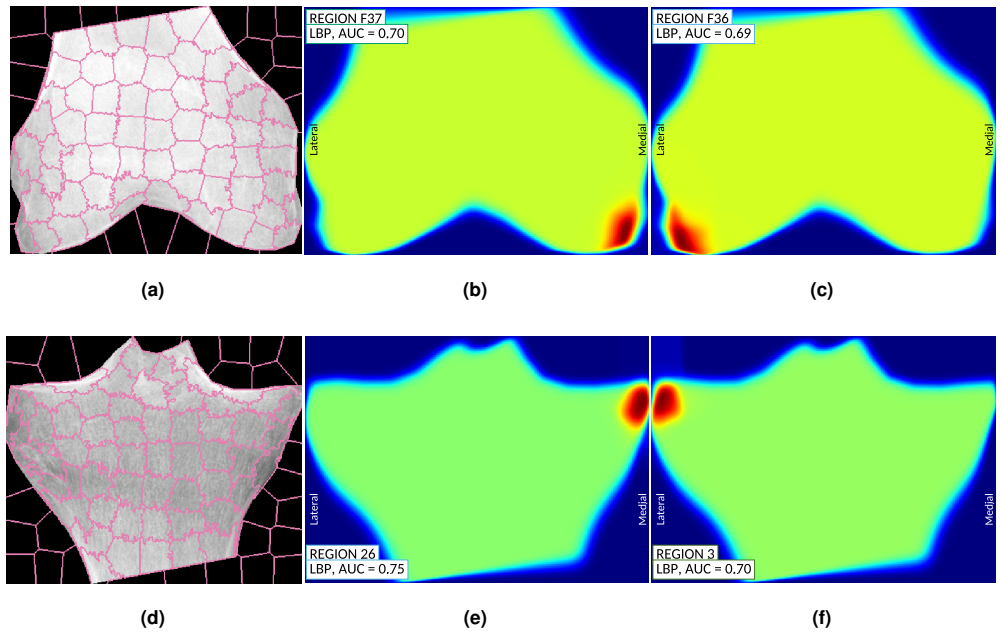
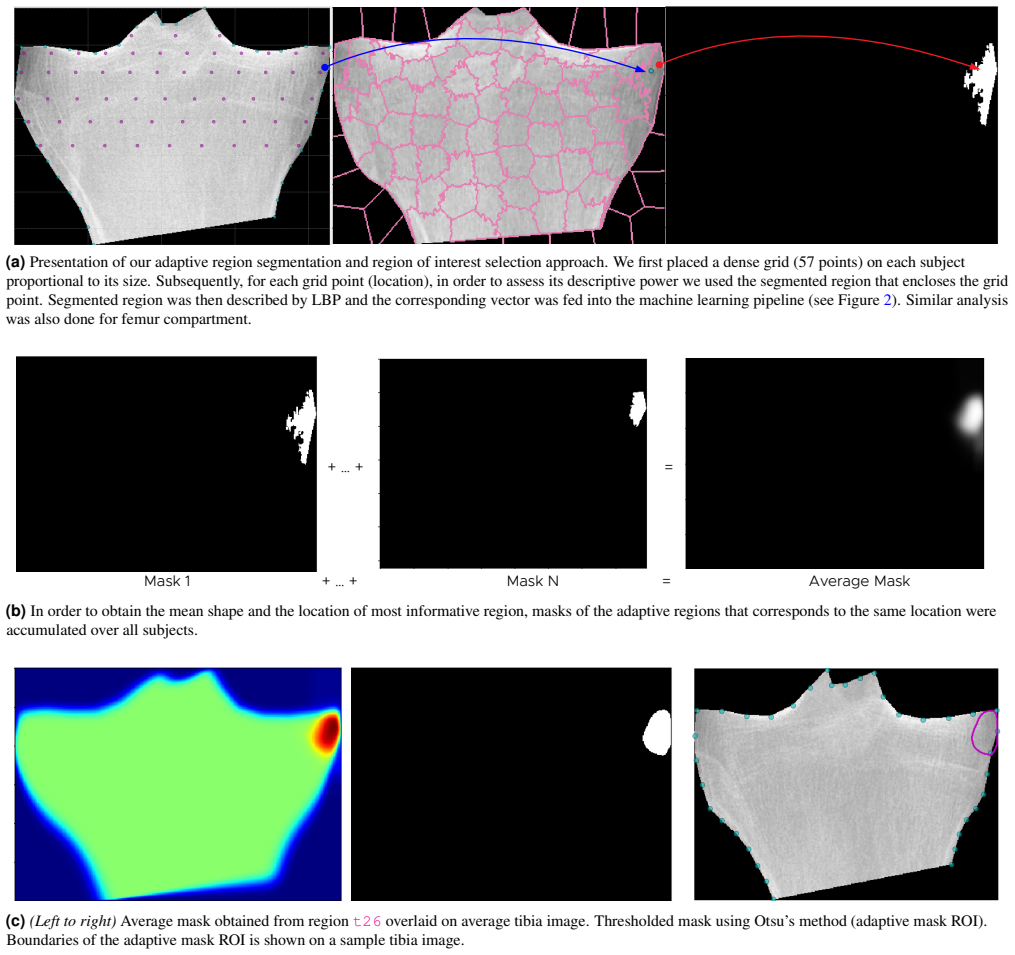
The load-bearing mechanism is SLIC superpixel oversegmentation, which partitions the tibia and femur into compact regions that follow local intensity boundaries, combined with an LBP-based search over a dense grid to find the region where a logistic-regression classifier best separates OA from non-OA. Averaging the masks of the winning region (t26) over all subjects and thresholding with Otsu's method produces one fixed 'adaptive mask' that is then used in all subsequent experiments instead of per-subject segmentation. The standard ROI against which it is compared is a square patch immediately beneath the tibial plateau, sized proportionally to knee width.
What would settle it
Recompute the experiments using each subject's own segmented region instead of the fixed average mask; if per-subject masks fail to beat or match the fixed t26 mask, or if a different region such as the lateral margin (t3) outperforms t26 on an independent cohort, then the claim that t26 is the optimal ROI for all settings is falsified.
Extended reading notes
Core claim
The paper's central claim is that the most informative subchondral bone region for detecting radiographic knee OA is the outer medial tibia margin, the site where osteophytes typically form, and that a single adaptive mask derived from that region outperforms the standard rectangular ROI. This holds for LBP, HOG, and Haralick texture features under cross-validation on two large public cohorts and under train-on-one-test-on-the-other external validation; it does not hold for fractal dimension and Shannon entropy, whose results are mixed or worse. The authors further show that combining the same descriptor from the medial (t26) and lateral (t3) tibia margins adds complementary information, with LBP medial-plus-lateral reaching AUC 0.840 [0.825, 0.852] on the independent test set.
Load-bearing premise
The load-bearing assumption is that one fixed analysis region, produced by averaging and thresholding the most informative superpixel mask across training subjects, remains optimal for every subject, every texture descriptor, and every acquisition protocol.
Editorial extensions
If this is right
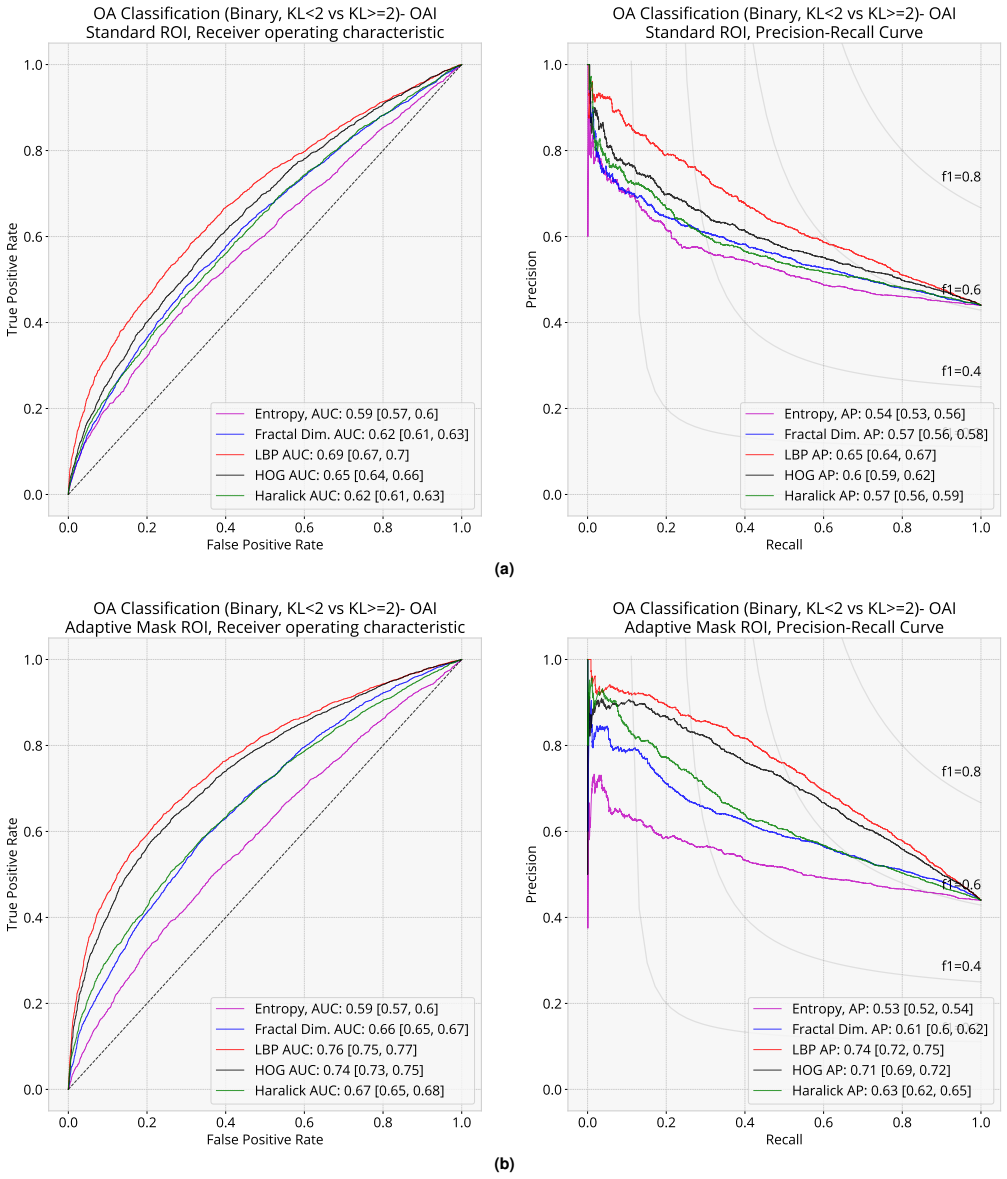
- Switching from the standard rectangular ROI to the adaptive t26 mask raises 5-fold cross-validated AUC for LBP on the first cohort from 0.685 to 0.761 and for HOG from 0.651 to 0.742.
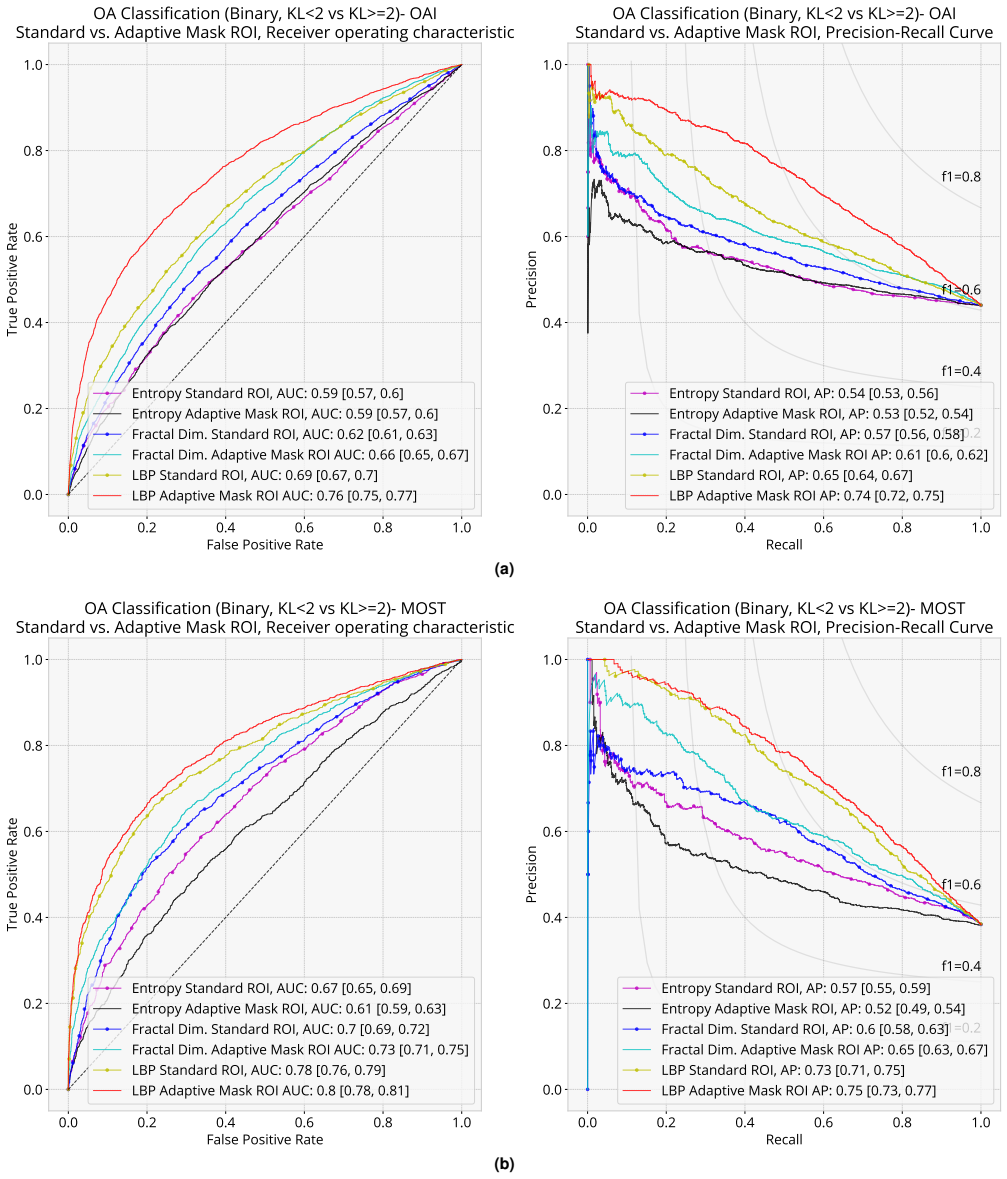
- On the external test set, the adaptive mask improves AUC for LBP (0.818), HOG (0.800), and Haralick (0.762) relative to the standard ROI, showing that the gain is not limited to the training cohort.
- Combining LBP features from the medial (t26) and lateral (t3) tibia margins yields the best overall result, with an external AUC of 0.840 [0.825, 0.852], indicating that the two sides carry complementary OA-related texture information.
- Fractal dimension and Shannon entropy do not consistently benefit from the adaptive ROI and sometimes perform worse, so the ROI advantage is descriptor-dependent rather than universal.
Reading between the lines
- If the most informative region varies from patient to patient, a per-subject adaptive mask could perform even better than the fixed t26 average mask; the paper itself notes that replacing per-subject segmentation with the average mask may lower performance, so a direct comparison would quantify that loss.
- Because only LBP was used to select the informative region, the same search could be repeated with HOG or a learned deep feature; a different descriptor might nominate a different region and outperform t26 for that descriptor.
- The finding that tibial margins carry the discriminative signal suggests that OA texture biomarkers should intentionally include marginal and subchondral regions where osteophytes form, which may also apply to other joints or to predicting OA progression rather than prevalence.
- A third-cohort test with different acquisition settings, such as beam angle, resolution, or post-processing, would show whether the mask's advantage is tied to the specific preprocessing used here or is a general property of marginal bone texture.
Signed reviews
Editorial analysis
A structured set of objections, weighed in public.
Referee Report
Summary. This manuscript proposes a fully automatic method for selecting a region of interest (ROI) for texture analysis of subchondral bone in knee radiographs, with the aim of improving OA-versus-non-OA classification. The method uses SLIC superpixel oversegmentation, places a dense grid over the tibia and femur, evaluates each superpixel region using LBP features, and then identifies the most informative region. In the experiments, however, the per-subject adaptive masks are replaced by a single mask obtained by Otsu-thresholding the OAI-average of the t26 masks, and this fixed mask is used for all subsequent evaluations. The authors compare five texture descriptors (LBP, fractal dimension, Haralick features, Shannon entropy, HOG) within this adaptive-mask ROI versus a standard rectangular ROI, using logistic regression in five-fold cross-validation on OAI and MOST, plus an independent OAI-to-MOST transfer experiment. They report that the adaptive ROI improves classification for LBP, HOG, and Haralick features, with the best result on the external validation being LBP features combined from medial and lateral tibia regions at AUC 0.840 [0.825, 0.852] (Table S3).
Significance. If the claims are substantiated, the paper would provide a useful addition to the literature on ROI placement in bone texture analysis, and the large-scale independent OAI-to-MOST validation is a genuine strength. The finding that LBP and HOG outperform fractal dimension and entropy in this setting is consistent with a broader trend and is supported by the external experiment. The paper also ships a clear, reproducible-looking pipeline description. However, the central 'adaptive segmentation' claim is weakened by the fact that all reported results use a fixed average mask rather than per-subject adaptive masks, and the OAI cross-validation results are potentially optimistic because the same OAI labels were used both to select the mask and to report the improvements. The external validation supports the fixed-mask comparison specifically, but it does not by itself validate the adaptive procedure.
major comments (3)
- [Section 2.3, Figure 4] The central claim of the paper is that adaptive segmentation improves ROI selection, but the experiments do not actually evaluate per-subject adaptive masks. In Section 2.3, after selecting the t26 region, the authors state: 'Instead of segmenting the tibia of each individual subject, we employed the mask which was obtained by thresholding the average mask using Otsu's method.' This fixed mask is then used 'in the rest of the experiments,' meaning Tables 2, 3, 4, S2, and S3 all compare a fixed, non-adaptive mask against the standard ROI. The paper asserts that 'there is a large portion of overlap between the segmentation masks' but provides no overlap statistics and no comparison of per-subject adaptive masks versus the fixed average mask. The Discussion acknowledges that using the average mask 'could lower the performance,' but this admitted limitation is not quantified. To support the adaptive-segmentation claim, the authors should report results for the per-subject adaptive masks and compare them with the fixed average mask and the standard ROI, or alternatively reframe the contribution as a fixed, data-driven ROI and temper the title and abstract accordingly.
- [Section 2.3, Table 2] The OAI cross-validation results in Table 2 are optimistic because the t26 mask was selected by maximizing LBP classification performance on the OAI data, and the same OAI data are then used to report the cross-validated improvements. This is a form of selection on the evaluation set: the mask parameters are effectively fit to the OAI labels, so the reported gains of up to 9% in AUC over the standard ROI on OAI are not an unbiased estimate of the method's performance on new data. The external OAI-to-MOST experiment (Table 4) provides more trustworthy evidence for the fixed mask, and it is a genuine strength of the paper, but the internal OAI numbers should be presented as a model-selection result rather than as an independent evaluation, or the authors should use nested cross-validation so that mask selection occurs inside each training fold.
- [Section 3, Table 3] The claim of consistent improvement on MOST cross-validation is not fully supported by the reported confidence intervals. For LBP, the standard-ROI AUC is 0.778 [0.760, 0.792] and the adaptive-mask ROI AUC is 0.797 [0.781, 0.812]; these intervals overlap, so the observed difference is not statistically significant at the usual 95% level. A similar concern applies to several other comparisons where intervals are close. The authors state that 'scores for adaptive ROI are better except Entropy descriptor' without reporting any paired significance test or effect-size measure. Given the large sample sizes, the lack of significance testing is a notable omission. I recommend adding a paired statistical comparison (e.g., DeLong test for AUC or a bootstrap paired test) and discussing which improvements are statistically reliable.
minor comments (6)
- [Table 2] The Fractal AUC confidence interval is missing a closing bracket: '0.664 [0.652, 0.675' should be '0.664 [0.652, 0.675]'.
- [Section 2.1] In the sentence about OAI and MOST details, 'Future details' should be 'Further details'.
- [Section 4] In the paragraph discussing validation results, 'different distribution and amount of of training samples' contains a duplicated 'of'.
- [Section 2.6] The text says 'ROC AUC which is also calledc− index'; this should be 'c-index' with proper spacing and formatting.
- [Supplementary, Table S1] The HOG 'Cells per block' row lists best value as '4,4' and 'Pixels per cell' as '10,10'; these should be written as tuples (4,4) and (10,10) for consistency with the search-space notation.
- [Figure 4] The figure caption contains garbled text fragments such as '/uni00000021/...' and 'lef'; these appear to be encoding artifacts and should be replaced with the intended caption text.
Circularity Check
The OAI adaptive-mask results are partly fitted: t26 was chosen by LBP performance on OAI labels, and the same OAI folds then report LBP's adaptive-ROI improvement; the independent MOST transfer supports only the fixed mask, not the per-subject adaptive claim.
-
fitted input called prediction
[Section 2.3, 'Detection of the Most Informative Region'; Table 2 (OAI - Exp 1)]
"In this step, we employed Local Binary Patterns (LBP) descriptor to detect the most informative (optimal) region. Here, we defined the most informative region as the subregion where the texture classifier (based on LBP features) performs best to distinguish OA samples from non-OA."
The adaptive ROI t26 was selected by maximizing LBP classification performance on the OAI labels, and Table 2 then reports OAI 5-fold cross-validated LBP performance on that same ROI as evidence that the adaptive ROI improves OA classification. The OAI evaluation is not an independent test of the ROI: the test-fold labels were used to choose t26 among the searched grid regions, so the reported LBP adaptive-mask AUC on OAI is effectively a selected maximum over those regions rather than a held-out estimate. This is a fitted selection presented as a predicted result.
-
self definitional
[Section 2.3 and Discussion, descriptor-comparison paragraph]
"We observed that LBP yielded the best performance in all experimental settings with AUC of 0.761 [0.751, 0.771] and AP of 0.737 [0.724, 0.749] on OAI, AUC of 0.797 [0.781, 0.812] and AP of 0.754 [0.735, 0.772] on MOST, and AUC of 0.818 [0.802, 0.832] and AP of 0.779 [0.760, 0.795] on validation setting when evaluated on adaptive mask ROI (t26)."
The claim that LBP is the best descriptor is evaluated on the adaptive mask t26, but t26 was itself defined as the region where the LBP-based classifier performs best on OAI. The descriptor comparison on the adaptive ROI is therefore not neutral: the ROI was chosen by optimizing the LBP criterion, so LBP's top ranking on that ROI is partly baked into the ROI definition. The MOST numbers use independent labels, but the mask was still selected on OAI using LBP, so the cross-descriptor ranking remains biased toward LBP.
full rationale
The paper's central adaptive-vs-standard comparison is not by construction identical to its inputs: the t26 mask is derived from LBP superpixel analysis, the logistic-regression classifier is trained inside folds, and the OAI-to-MOST transfer (Table 4, Exp 3) tests the resulting fixed mask on independent labels. That external experiment provides genuine, non-circular evidence that the Otsu-thresholded average mask improves classification for LBP, HOG, and Haralick over the standard ROI. However, the OAI-only results (Table 2) are partially fitted: t26 was selected by maximizing LBP classification performance on OAI labels, and Table 2 then reports OAI 5-fold CV of LBP on that same ROI as a prediction; because the ROI choice used the test-fold labels, the OAI adaptive-mask AUC is a selected maximum rather than a held-out estimate. The descriptor ranking is also biased for the same reason: LBP was used to choose the ROI, and LBP is then reported as the best descriptor on that ROI. No load-bearing self-citation chain is present; references to prior work by the same group support preprocessing or context, not the ROI-uniqueness claim. A separate, non-circular validity gap should be noted: after averaging, the method replaces per-subject segmentation with a single fixed Otsu-thresholded mask, so the experiments do not actually validate the adaptive per-subject segmentation described in the method. On balance, the partial circularity from selecting the ROI on the evaluation data and ranking the descriptor on the same criterion warrants a score of 5; the independent MOST transfer prevents a higher score.
Assumptions & free parameters
free parameters (6)
- SLIC compactness parameter m =
0.08
- Number of SLIC superpixels =
100
- FD structuring element maximum size =
3.2 mm
- LBP radius and points =
radius 6, points 8
- HOG orientations, cells per block, pixels per cell =
4, (4,4), (10,10)
- Grid point count for ROI candidates =
57
assumptions (4)
- domain assumption Kellgren-Lawrence grade is a valid reference standard for radiographic OA, with KL>=2 defining OA.
- domain assumption BoneFinder landmark detection is sufficiently accurate for ROI placement.
- domain assumption SLIC superpixels respect true anatomical texture boundaries.
- domain assumption OAI and MOST baseline PA radiographs are comparable after the described preprocessing.
Cite this review
Pith. "Pith review of Adaptive Segmentation of Knee Radiographs for Selecting the Optimal ROI in Texture Analysis." pith.science (2026). https://pith.science/paper/KZU4FSGA
@misc{pith2026190807736,
  author       = {Pith},
  title        = {Pith review of: Adaptive Segmentation of Knee Radiographs for Selecting the Optimal ROI in Texture Analysis},
  year         = {2026},
  howpublished = {\url{https://pith.science/paper/KZU4FSGA}},
  note         = {Machine review of arXiv:1908.07736}
}
read the original abstract
The purposes of this study were to investigate: 1) the effect of placement of region-of-interest (ROI) for texture analysis of subchondral bone in knee radiographs, and 2) the ability of several texture descriptors to distinguish between the knees with and without radiographic osteoarthritis (OA). Bilateral posterior-anterior knee radiographs were analyzed from the baseline of OAI and MOST datasets. A fully automatic method to locate the most informative region from subchondral bone using adaptive segmentation was developed. We used an oversegmentation strategy for partitioning knee images into the compact regions that follow natural texture boundaries. LBP, Fractal Dimension (FD), Haralick features, Shannon entropy, and HOG methods were computed within the standard ROI and within the proposed adaptive ROIs. Subsequently, we built logistic regression models to identify and compare the performances of each texture descriptor and each ROI placement method using 5-fold cross validation setting. Importantly, we also investigated the generalizability of our approach by training the models on OAI and testing them on MOST dataset.We used area under the receiver operating characteristic (ROC) curve (AUC) and average precision (AP) obtained from the precision-recall (PR) curve to compare the results. We found that the adaptive ROI improves the classification performance (OA vs. non-OA) over the commonly used standard ROI (up to 9% percent increase in AUC). We also observed that, from all texture parameters, LBP yielded the best performance in all settings with the best AUC of 0.840 [0.825, 0.852] and associated AP of 0.804 [0.786, 0.820]. Compared to the current state-of-the-art approaches, our results suggest that the proposed adaptive ROI approach in texture analysis of subchondral bone can increase the diagnostic performance for detecting the presence of radiographic OA.
Figures

Figures from the paper (4 more)

Reference graph
Works this paper leans on
-
[1]
Subchondral bone changes in hand and knee osteoarthritis detected by radiography
Buckland-Wright, C. Subchondral bone changes in hand and knee osteoarthritis detected by radiography. Osteoarthritis and cartilage 12, 10–19 (2004) (on pp. 1, 2, 4, 12)
work page 2004
- [2]
-
[3]
Lynch, J., Hawkes, D. & Buckland-Wright, J. Analysis of texture in macroradiographs of osteoarthritic knees, using the fractal signature. Physics in Medicine & Biology 36, 709 (1991) (on pp. 1, 2, 4, 12)
work page 1991
-
[4]
Janvier, T., Jennane, R., Toumi, H. & Lespessailles, E. Subchondral tibial bone texture predicts the incidence of radiographic knee osteoarthritis: data from the Osteoarthritis Initiative. Osteoarthritis and cartilage 25, 2047–2054 (2017) (on pp. 1, 2, 4, 12)
work page 2017
-
[5]
Hirvasniemi, J. et al. Differences in tibial subchondral bone structure evaluated using plain radiographs between knees with and without cartilage damage or bone marrow lesions-the Oulu Knee Osteoarthritis study. European radiology 27, 4874–4882 (2017) (on pp. 1, 2, 4, 12)
work page 2017
-
[6]
Ljuhar, R. et al. Combining fractal-and entropy-based bone texture analysis for the prediction of Osteoarthritis: data from the Multicenter Osteoarthritis study (MOST) in R¨oFo-Fortschritte auf dem Gebiet der R¨ontgenstrahlen und der bildgebenden Verfahren190 (2018), WISS–106 (on pp. 1, 2, 4, 12)
work page 2018
-
[7]
Jennane, R., Touvier, J., Bergounioux, M. & Lespessailles, E. A variational model for trabecular bone radiograph characterization in Biomedical Imaging (ISBI), 2014 IEEE 11th International Symposium on (2014), 1283–1286 (on pp. 1, 2, 4, 12)
work page 2014
-
[8]
Kraus, V . B.et al. Predictive validity of radiographic trabecular bone texture in knee osteoarthritis: the Osteoarthritis Research Society International/Foundation for the National Institutes of Health Osteoarthritis Biomarkers Consortium. Arthritis & Rheumatology 70, 80–87 (2018) (on pp. 1, 2, 4, 12)
work page 2018
Show all 51 references
-
[9]
Hirvasniemi, J. et al. Quantification of differences in bone texture from plain radiographs in knees with and without osteoarthritis. Osteoarthritis and cartilage 22, 1724–1731 (2014) (on pp. 1, 2, 4, 12)
2014
-
[10]
& Englund, M
Wolski, M., Podsiadlo, P., Stachowiak, G., Lohmander, L. & Englund, M. Differences in trabecular bone texture between knees with and without radiographic osteoarthritis detected by directional fractal signature method. Osteoarthritis and cartilage 18, 684–690 (2010) (on pp. 1,...
2010
-
[11]
Thomson, J., O’Neill, T., Felson, D. & Cootes, T.Automated shape and texture analysis for detection of osteoarthritis from radiographs of the knee in International Conference on Medical Image Computing and Computer-Assisted Intervention (2015), 127–134 (on pp. 1, 2, 4, 12)
2015
-
[12]
Podsiadlo, P. et al. Baseline trabecular bone and its relation to incident radiographic knee osteoarthritis and increase in joint space narrowing score: directional fractal signature analysis in the MOST study. Osteoarthritis and cartilage 24, 1736–1744 (2016) (on pp. 1, 2, 4,...
2016
-
[13]
A., Ward, R
Messent, E. A., Ward, R. J., Tonkin, C. J. & Buckland-Wright, C. Tibial cancellous bone changes in patients with knee osteoarthritis. A short-term longitudinal study using Fractal Signature Analysis. Osteoarthritis and cartilage 13, 463–470 (2005) (on pp. 1, 2, 4, 12)
2005
-
[14]
Kraus, V . B.et al. Trabecular morphometry by fractal signature analysis is a novel marker of osteoarthritis progression. Arthritis & Rheumatism: Official Journal of the American College of Rheumatology 60, 3711–3722 (2009) (on pp. 1, 2, 4, 12)
2009
-
[15]
Lowitz, T. et al. Characterization of knee osteoarthritis-related changes in trabecular bone using texture parameters at various levels of spatial resolution—a simulation study. BoneKEy reports 3 (2014) (on p. 1)
2014
-
[16]
& Saarakkala, S
Tiulpin, A., Thevenot, J., Rahtu, E., Lehenkari, P. & Saarakkala, S. Automatic knee osteoarthritis diagnosis from plain radiographs: a deep learning-based approach. Scientific reports 8, 1727 (2018) (on pp. 1, 12)
2018
-
[17]
Clinical significance of bone changes in osteoarthritis in Arthritis Research & Therapy 14 (2012), A3 (on p
Neogi, T. Clinical significance of bone changes in osteoarthritis in Arthritis Research & Therapy 14 (2012), A3 (on p. 1)
2012
-
[18]
Tiulpin, A. et al. Multimodal Machine Learning-based Knee Osteoarthritis Progression Prediction from Plain Radiographs and Clinical Data. arXiv preprint arXiv:1904.06236 (2019) (on p. 1)
2019 arXiv
-
[19]
Brahim, A. et al. A Decision Support Tool For Early Detection of Knee OsteoArthritis using X-ray Imaging and Machine Learning: Data from the OsteoArthritis Initiative. Computerized Medical Imaging and Graphics (2019) (on p. 1)
2019
-
[20]
& Cootes, T
Minciullo, L. & Cootes, T. Fully automated shape analysis for detection of osteoarthritis from lateral knee radiographsin Pattern Recognition (ICPR), 2016 23rd International Conference on(2016), 3787–3791 (on p. 1)
2016
-
[21]
Antony, J., McGuinness, K., O’Connor, N. E. & Moran, K.Quantifying radiographic knee osteoarthritis severity using deep convolutional neural networks in Pattern Recognition (ICPR), 2016 23rd International Conference on (2016), 1195–1200 (on p. 1)
2016
-
[22]
& Saarakkala, S
Hirvasniemi, J., Niinim¨aki, J., Thevenot, J. & Saarakkala, S. Bone Density and Texture from Minimally Post-Processed Knee Radiographs in Subjects with Knee Osteoarthritis. Annals of biomedical engineering, 1–10 (2019) (on p. 2)
2019
-
[23]
Riad, R. et al. Texture analysis using complex wavelet decomposition for knee osteoarthritis detection: Data from the osteoarthritis initiative. Computers & Electrical Engineering 68, 181–191 (2018) (on pp. 2, 4)
2018
-
[24]
Prediction of progression of radiographic knee osteoarthritis using tibial trabecular bone texture
Woloszynski, T.et al. Prediction of progression of radiographic knee osteoarthritis using tibial trabecular bone texture. Arthritis & Rheumatism 64, 688–695 (2012) (on p. 2)
2012
-
[25]
M., Wolski, M., Stachowiak, G
Podsiadlo, P., Cicuttini, F. M., Wolski, M., Stachowiak, G. & Wluka, A. Trabecular bone texture detected by plain radiography is associated with an increased risk of knee replacement in patients with osteoarthritis: a 6 year prospective follow up study. Osteoarthritis and cart...
2014
-
[26]
& Stachowiak, G
Wolski, M., Podsiadlo, P. & Stachowiak, G. Directional fractal signature analysis of trabecular bone: evaluation of different methods to detect early osteoarthritis in knee radiographs. Proceedings of the Institution of Mechanical Engineers, Part H: Journal of Engineering in M...
2009
-
[27]
Janvier, T., Toumi, H., Harrar, K., Lespessailles, E. & Jennane, R.ROI impact on the characterization of knee osteoarthritis using fractal analysis in Image Processing Theory, Tools and Applications (IPTA), 2015 International Conference on (2015), 304–308 (on pp. 2, 4, 12)
2015
-
[28]
Shamir, L. et al. Knee X-ray image analysis method for automated detection of Osteoarthritis. IEEE Transactions on Biomedical Engineering 56, 407–415 (2009) (on pp. 2, 4)
2009
-
[29]
Hlad˚uvka, J. et al. Femoral ROIs and Entropy for Texture-based Detection of Osteoarthritis from High-Resolution Knee Radiographs. arXiv preprint arXiv:1703.09296 (2017) (on pp. 2, 4, 12)
2017 arXiv
-
[30]
Anifah, L., Purnama, I. K. E., Hariadi, M. & Purnomo, M. H. Osteoarthritis classification using self organizing map based on gabor kernel and contrast-limited adaptive histogram equalization. The open biomedical engineering journal 7, 18 (2013) (on pp. 2, 4)
2013
-
[31]
& Garg, R.Locally invariant fractal features for statistical texture classificationin 2007 IEEE 11th international conference on computer vision (2007), 1–8 (on p
Varma, M. & Garg, R.Locally invariant fractal features for statistical texture classificationin 2007 IEEE 11th international conference on computer vision (2007), 1–8 (on p. 2)
2007
-
[32]
& Buckland-Wright, J
Lynch, J., Hawkes, D. & Buckland-Wright, J. A robust and accurate method for calculating the fractal signature of texture in macroradiographs of osteoarthritic knees. Medical Informatics 16, 241–251 (1991) (on p. 2)
1991
-
[33]
& Buckland-Wright, C
Messent, E., Ward, R., Tonkin, C. & Buckland-Wright, C. Differences in trabecular structure between knees with and without osteoarthritis quantified by macro and standard radiography, respectively. Osteoarthritis and cartilage 14, 1302– 1305 (2006) (on p. 2). 14/21
2006
-
[34]
& Kurzynski, M
Woloszynski, T., Podsiadlo, P., Stachowiak, G. & Kurzynski, M. A signature dissimilarity measure for trabecular bone texture in knee radiographs. Medical physics 37, 2030–2042 (2010) (on p. 2)
2010
-
[35]
& Stachowiak, G
Podsiadlo, P., Wolski, M. & Stachowiak, G. Automated selection of trabecular bone regions in knee radiographs.Medical physics 35, 1870–1883 (2008) (on p. 2)
2008
-
[36]
& Roemer, F
Hafezi-Nejad, N., Guermazi, A., Demehri, S. & Roemer, F. W. New imaging modalities to predict and evaluate osteoarthri- tis progression. Best Practice & Research Clinical Rheumatology (2018) (on pp. 2, 4)
2018
-
[37]
Lindner, C. et al. Fully automatic segmentation of the proximal femur using random forest regression voting. IEEE transactions on medical imaging 32, 1462–1472 (2013) (on pp. 3, 12)
2013
-
[38]
Achanta, R. et al. SLIC superpixels compared to state-of-the-art superpixel methods. IEEE transactions on pattern analysis and machine intelligence 34, 2274–2282 (2012) (on p. 3)
2012
-
[39]
Wolski, M. et al. Trabecular bone texture detected by plain radiography and variance orientation transform method is different between knees with and without cartilage defects. Journal of Orthopaedic Research 29, 1161–1167 (2011) (on p. 4)
2011
-
[40]
Shamir, L. et al. Early detection of radiographic knee osteoarthritis using computer-aided analysis. Osteoarthritis and Cartilage 17, 1307–1312 (2009) (on p. 4)
2009
-
[41]
& Gelsema, E
Veenland, J., Grashuis, J., van der Meer, F., Beckers, A. & Gelsema, E. Estimation of fractal dimension in radiographs. Medical physics 23, 585–594 (1996) (on pp. 4, 9)
1996
-
[42]
& M¨aenp¨a¨a, T
Ojala, T., Pietik¨ainen, M. & M¨aenp¨a¨a, T. Gray scale and rotation invariant texture classification with local binary patterns in European Conference on Computer Vision(2000), 404–420 (on p. 7)
2000
-
[43]
& Triggs, B
Dalal, N. & Triggs, B. Histograms of oriented gradients for human detection in international Conference on computer vision & Pattern Recognition (CVPR’05)1 (2005), 886–893 (on p. 7)
2005
-
[44]
Hirvasniemi, J. et al. Correlation of subchondral bone density and structure from plain radiographs with micro computed tomography ex vivo. Annals of biomedical engineering 44, 1698–1709 (2016) (on p. 7)
2016
-
[45]
Coelho, L. P. Mahotas: Open source software for scriptable computer vision. arXiv preprint arXiv:1211.4907 (2012) (on p. 7)
2012 arXiv
-
[46]
Pedregosa, F. et al. Scikit-learn: Machine Learning in Python. Journal of Machine Learning Research 12, 2825–2830 (2011) (on pp. 7, 8)
2011
-
[47]
& Valderrabano, V
Egloff, C., H¨ugle, T. & Valderrabano, V . Biomechanics and pathomechanisms of osteoarthritis.Swiss medical weekly 142 (2012) (on pp. 9, 12)
2012
-
[48]
& Brady, M
Kadir, T. & Brady, M. Saliency, scale and image description.International Journal of Computer Vision 45, 83–105 (2001) (on p. 9)
2001
-
[49]
Norman, B., Pedoia, V ., Noworolski, A., Link, T. M. & Majumdar, S. Applying densely connected convolutional neural networks for staging osteoarthritis severity from plain radiographs. Journal of digital imaging 32, 471–477 (2019) (on p. 12)
2019
-
[50]
& Saarakkala, S
Tiulpin, A., Melekhov, I. & Saarakkala, S. KNEEL: Knee Anatomical Landmark Localization Using Hourglass Networks
-
[2019]
arXiv: 1907.12237 [cs.CV] (on p. 12). 15/21 Supplementary Parameter Optimization Table S1. Hyperparameter search space and best parameters found after performing grid search on 5-fold cross-validation setting. Hyperparameter Type Values Best LBP Radius Ordinal {2,3,4,5,6} 6 Po...
1907 arXiv
Reviewed August 14, 2026 · model on record in the stance chip above.
Discussion (0). Continue with ORCID to comment.