From Data to Insights: Exploring Program-of-Thoughts Prompting for Chart Summarization
Pith reviewed 2026-06-29 22:08 UTC · model grok-4.3
The pith
Program-of-Thoughts prompting with a chart-to-dictionary task lets lightweight vision-language models generate Python code to verify chart statistics.
A machine-rendered reading of the paper's core claim, the machinery that carries it, and where it could break.
Core claim
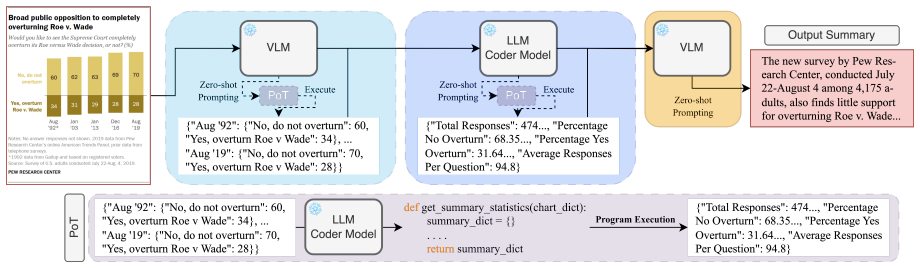
Converting a chart to a dictionary representation and then applying Program-of-Thoughts prompting enables lightweight VLMs to produce Python programs that derive valid summary statistics, achieving performance on par with existing chart summarization methods across semantic and factual metrics in zero-shot settings.
What carries the argument
Chart-to-dictionary auxiliary task integrated with Program-of-Thoughts, which generates Python programs to compute and verify statistical facts from the dictionary.
If this is right
- Lightweight VLMs gain the ability to perform numerical reasoning for charts through generated code rather than direct text output.
- The approach matches prior methods on both semantic quality and factual correctness without fine-tuning.
- Python programs act as explicit intermediaries that can be inspected to confirm statistical claims in the summary.
- Computational cost stays low because no model training or large-scale inference is required beyond the initial prompting.
Where Pith is reading between the lines
- The same dictionary-plus-code pattern could be tested on other visual reasoning tasks that mix perception with arithmetic, such as table extraction or diagram interpretation.
- Because the output is executable code, errors in statistical reasoning become easier to locate and correct than opaque text generations.
- If the dictionary format proves robust, it may support direct transfer to programming languages other than Python for the same verification step.
Load-bearing premise
The dictionary representation of a chart is flexible enough that Program-of-Thoughts can produce correct Python programs for statistical verification without any additional training.
What would settle it
If the Python programs generated from the dictionary produce statistics that differ from ground-truth values on a test set of charts, the claim that the approach reliably verifies facts would not hold.
Figures
read the original abstract
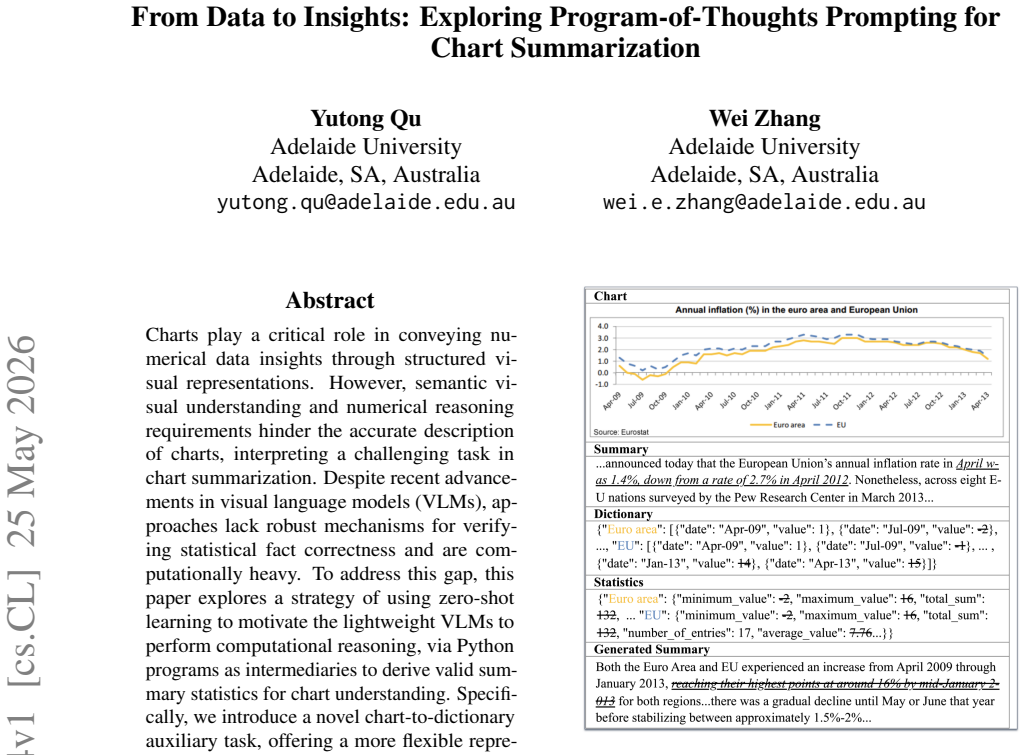
Charts play a critical role in conveying numerical data insights through structured visual representations. However, semantic visual understanding and numerical reasoning requirements hinder the accurate description of charts, interpreting a challenging task in chart summarization. Despite recent advancements in visual language models (VLMs), approaches lack robust mechanisms for verifying statistical fact correctness and are computationally heavy. To address this gap, this paper explores a strategy of using zero-shot learning to motivate the lightweight VLMs to perform computational reasoning, via Python programs as intermediaries to derive valid summary statistics for chart understanding. Specifically, we introduce a novel chart-to-dictionary auxiliary task, offering a more flexible representation compared to traditional chart-to-table methods, making it particularly well-suited for integration with the Program-of-Thought (PoT) strategy. Experimental results demonstrate our strategy performs on par with existing chart summarization methods across semantic and factual metrics. Code is available on https://anonymous.4open.science/r/ZeroShot-PoT-C2T-5A6B.
Editorial analysis
A structured set of objections, weighed in public.
Referee Report
Summary. The manuscript proposes a zero-shot Program-of-Thoughts (PoT) prompting strategy for chart summarization that uses a novel chart-to-dictionary auxiliary task to produce a flexible representation from which lightweight VLMs generate executable Python programs for computing statistical facts. The central empirical claim is that this approach achieves performance parity with existing chart summarization methods on semantic and factual metrics.
Significance. If the parity claim is substantiated with verifiable program correctness and standard experimental controls, the work would demonstrate a lightweight, training-free route to factual verification in multimodal chart understanding. The public code release is a positive factor for reproducibility.
major comments (2)
- [Abstract] Abstract: the claim that the strategy 'performs on par with existing chart summarization methods across semantic and factual metrics' supplies no dataset names, metric definitions, baseline implementations, statistical significance tests, or error bars, rendering the central empirical result unverifiable from the text.
- [Experiments / Results] Experiments / Results: no execution success rate, program error analysis, or manual verification of code fidelity to the input chart is reported. This is load-bearing for the claim that the PoT mechanism (rather than direct VLM generation) drives the reported semantic/factual parity.
minor comments (1)
- [Abstract] The anonymous code link should be replaced with a permanent repository in the camera-ready version.
Simulated Author's Rebuttal
We thank the referee for the constructive feedback on improving the clarity and verifiability of our empirical claims. We agree that the abstract would benefit from greater specificity and that additional program-level analysis would strengthen the case for the PoT mechanism. We will incorporate revisions to address both points.
read point-by-point responses
-
Referee: [Abstract] Abstract: the claim that the strategy 'performs on par with existing chart summarization methods across semantic and factual metrics' supplies no dataset names, metric definitions, baseline implementations, statistical significance tests, or error bars, rendering the central empirical result unverifiable from the text.
Authors: We acknowledge that the abstract presents a high-level claim without naming datasets, metrics, or controls. The body of the manuscript reports results on ChartQA, Chart-to-Text, and related benchmarks using standard semantic metrics (BLEU, ROUGE, BERTScore) and factual accuracy measures, with comparisons to published baselines. To make the central result immediately verifiable from the abstract itself, we will revise it to name the primary datasets, metrics, and note that statistical significance was assessed via paired t-tests across multiple VLM runs with reported standard deviations. revision: yes
-
Referee: [Experiments / Results] Experiments / Results: no execution success rate, program error analysis, or manual verification of code fidelity to the input chart is reported. This is load-bearing for the claim that the PoT mechanism (rather than direct VLM generation) drives the reported semantic/factual parity.
Authors: This is a fair and important observation. The current version emphasizes end-to-end summarization performance but does not quantify how often the generated Python programs execute successfully or verify their fidelity to the chart data. We will add a dedicated subsection reporting (1) execution success rate on the test sets, (2) a categorized error analysis of failed programs, and (3) manual inspection of a random sample of 100 programs confirming that extracted values match the chart content. These additions will directly support the claim that the auxiliary chart-to-dictionary + PoT pipeline, rather than direct generation, underpins the observed parity. revision: yes
Circularity Check
No circularity: empirical prompting study with independent experimental claims
full rationale
The paper is an empirical evaluation of zero-shot Program-of-Thoughts prompting combined with a chart-to-dictionary auxiliary task for chart summarization. Central claims rest on experimental metric comparisons rather than any derivation, fitted parameters, or self-referential definitions. No equations, uniqueness theorems, or self-citations are invoked in a load-bearing way that reduces results to inputs by construction. The work is self-contained against external benchmarks.
Axiom & Free-Parameter Ledger
axioms (1)
- domain assumption Lightweight VLMs can generate correct Python programs for statistical computations when given a chart-to-dictionary representation
Reference graph
Works this paper leans on
-
[1]
Zhe Cui, Sriram Karthik Badam, M Adil Yalçin, and Niklas Elmqvist
End-to-end chart summarization via visual chain-of-thought in vision-language models.arXiv preprint arXiv:2502.17589. Zhe Cui, Sriram Karthik Badam, M Adil Yalçin, and Niklas Elmqvist. 2019. Datasite: Proactive vi- sual data exploration with computation of insight- based recommendations.Information Visualization, 18(2):251–267. Seniz Demir, Sandra Carberr...
-
[2]
Computational Linguistics, 38(3):527–574
Summarizing information graphics textually. Computational Linguistics, 38(3):527–574. Massimo Fasciano and Guy Lapalme. 2000. Intentions in the coordinated generation of graphics and text from tabular data.Knowl. Inf. Syst., 2(3):310–339. Leo Ferres, Gitte Lindgaard, Livia Sumegi, and Bruce Tsuji. 2013. Evaluating a tool for improving acces- sibility to c...
2000
-
[3]
Improving accessibility to statistical graphs: the igraph-lite system. InProceedings of the 9th International ACM SIGACCESS Conference on Com- puters and Accessibility, pages 67–74. Jiayun Fu, Bin B. Zhu, Haidong Zhang, Yayi Zou, Song Ge, Weiwei Cui, Yun Wang, Dongmei Zhang, Xi- aojing Ma, and Hai Jin. 2022. Chartstamp: Robust chart embedding for real-wor...
-
[4]
Multimodal Chain-of-Thought Reasoning: A Comprehensive Survey
VisText: A benchmark for semantically rich chart captioning. InProceedings of the 61st Annual Meeting of the Association for Computational Lin- guistics (V olume 1: Long Papers), pages 7268–7298. Ashish Vaswani, Noam Shazeer, Niki Parmar, Jakob Uszkoreit, Llion Jones, Aidan N Gomez, Łukasz Kaiser, and Illia Polosukhin. 2017. Attention is all you need.Adva...
work page internal anchor Pith review Pith/arXiv arXiv 2017
-
[5]
InProceedings of the 61st Annual Meeting of the Association for Computational Linguistics (V olume 1: Long Papers), pages 11328–11348
AlignScore: Evaluating factual consistency with a unified alignment function. InProceedings of the 61st Annual Meeting of the Association for Computational Linguistics (V olume 1: Long Papers), pages 11328–11348. Liang Zhang, Anwen Hu, Haiyang Xu, Ming Yan, Yichen Xu, Qin Jin, Ji Zhang, and Fei Huang
-
[6]
Tinychart: Efficient chart understanding with program-of-thoughts learning and visual token merg- ing. InProceedings of the 2024 Conference on Em- pirical Methods in Natural Language Processing, pages 1882–1898. Tianyi Zhang, Varsha Kishore, Felix Wu, Kilian Q. Weinberger, and Yoav Artzi. 2020. Bertscore: Eval- uating text generation with bert. InInternat...
discussion (0)
Sign in with ORCID, Apple, or X to comment. Anyone can read and Pith papers without signing in.