The Limits of Photometric Dynamics: Benchmarking Cluster Relaxation Diagnostics
Pith reviewed 2026-07-01 01:35 UTC · model grok-4.3
The pith
Photometric redshift errors cause velocity diagnostics to classify nearly all galaxy clusters as relaxed.
A machine-rendered reading of the paper's core claim, the machinery that carries it, and where it could break.
Core claim
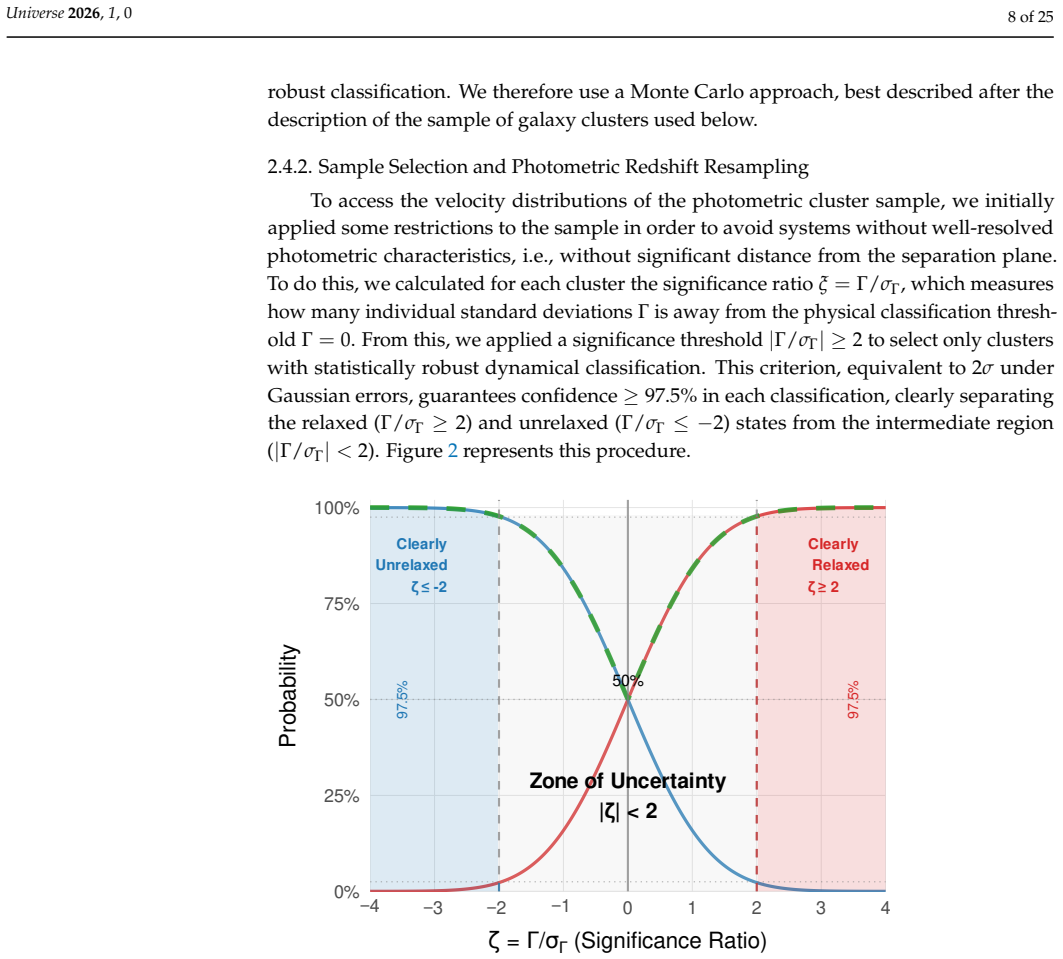
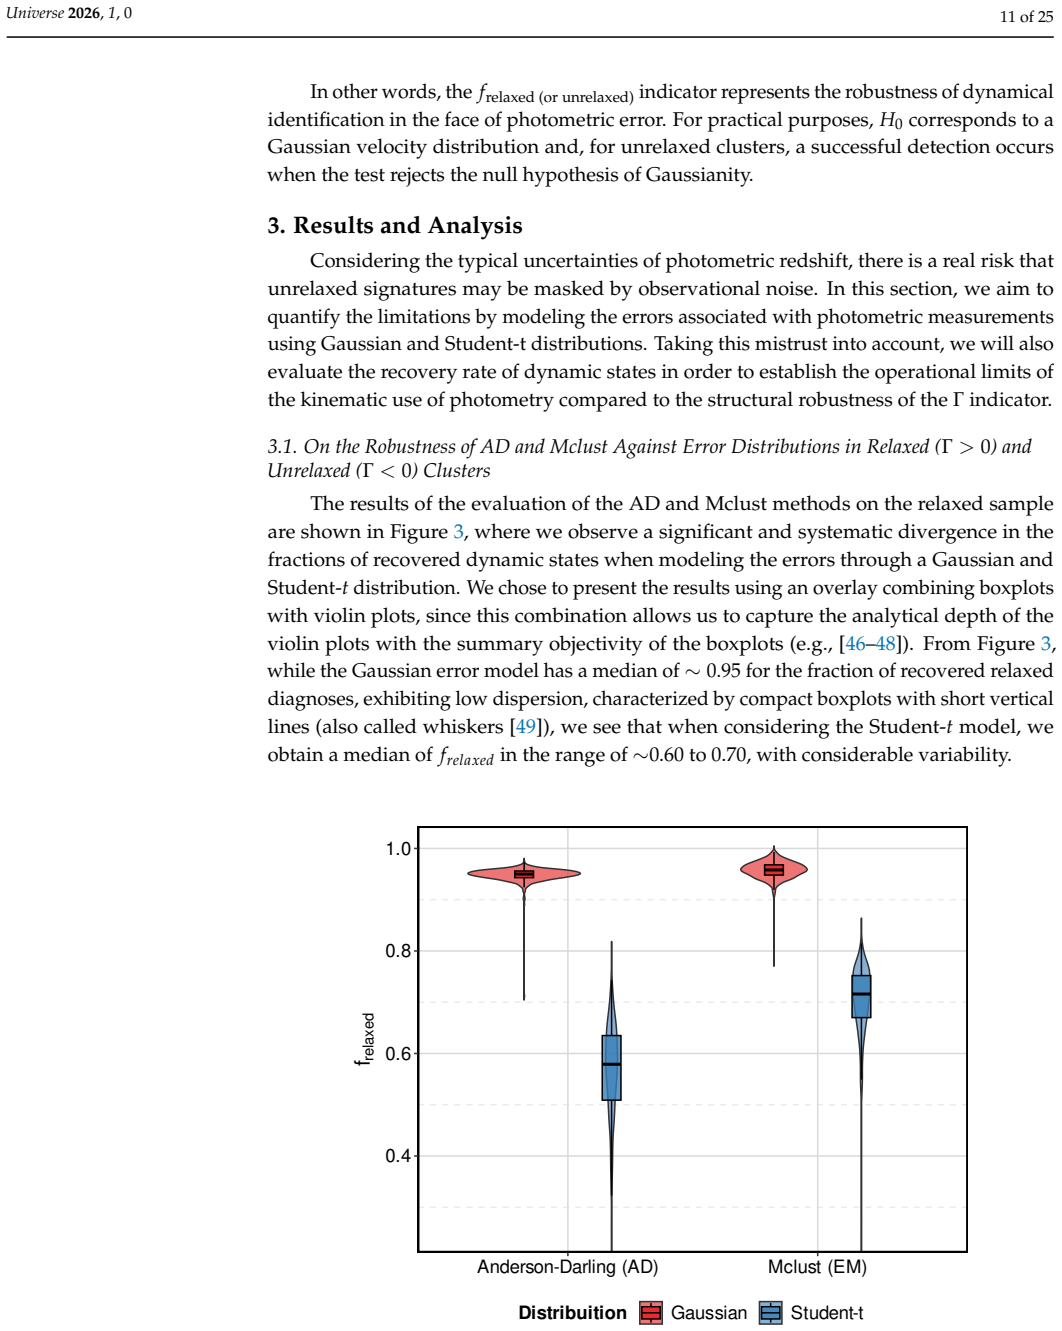
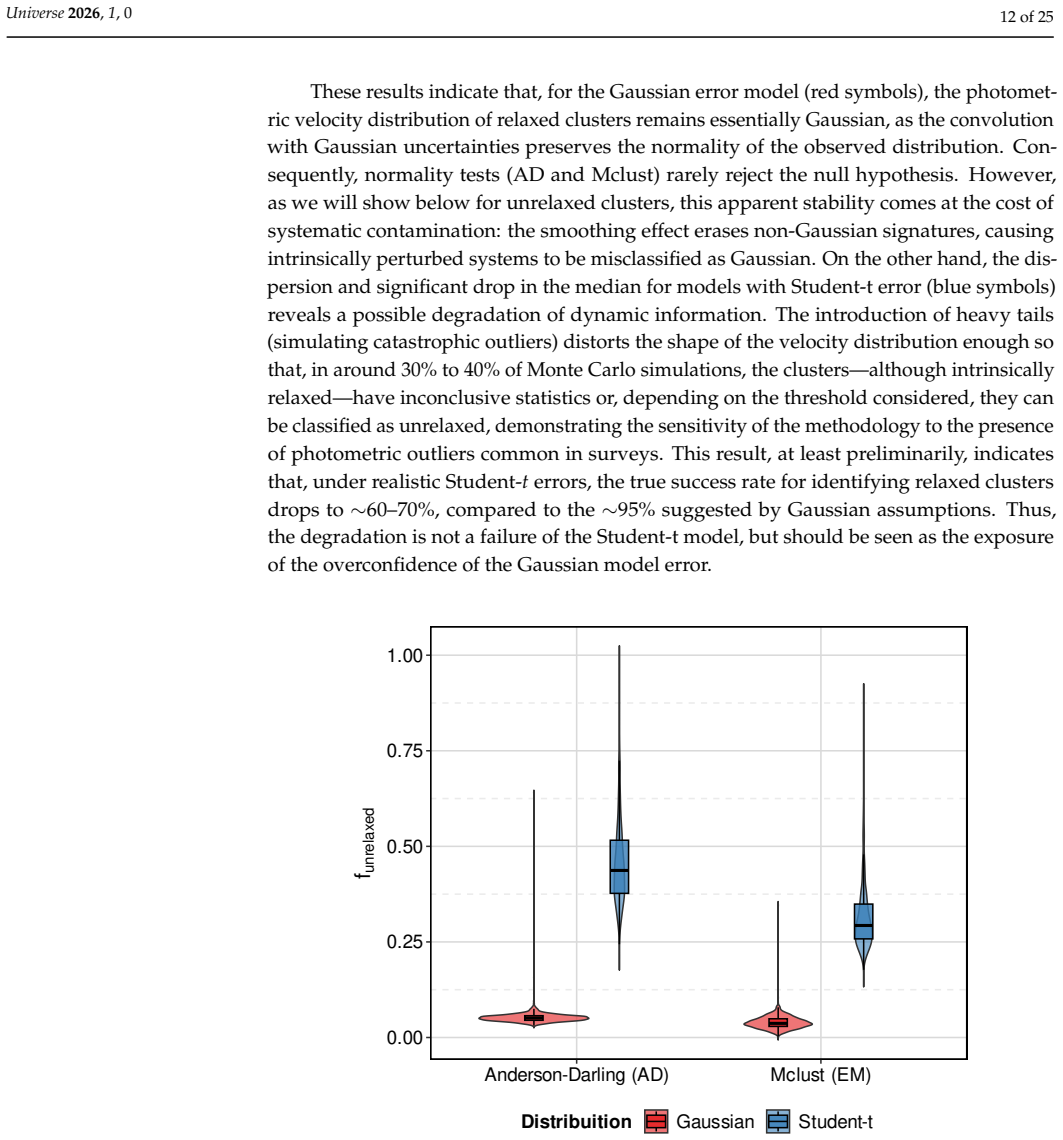
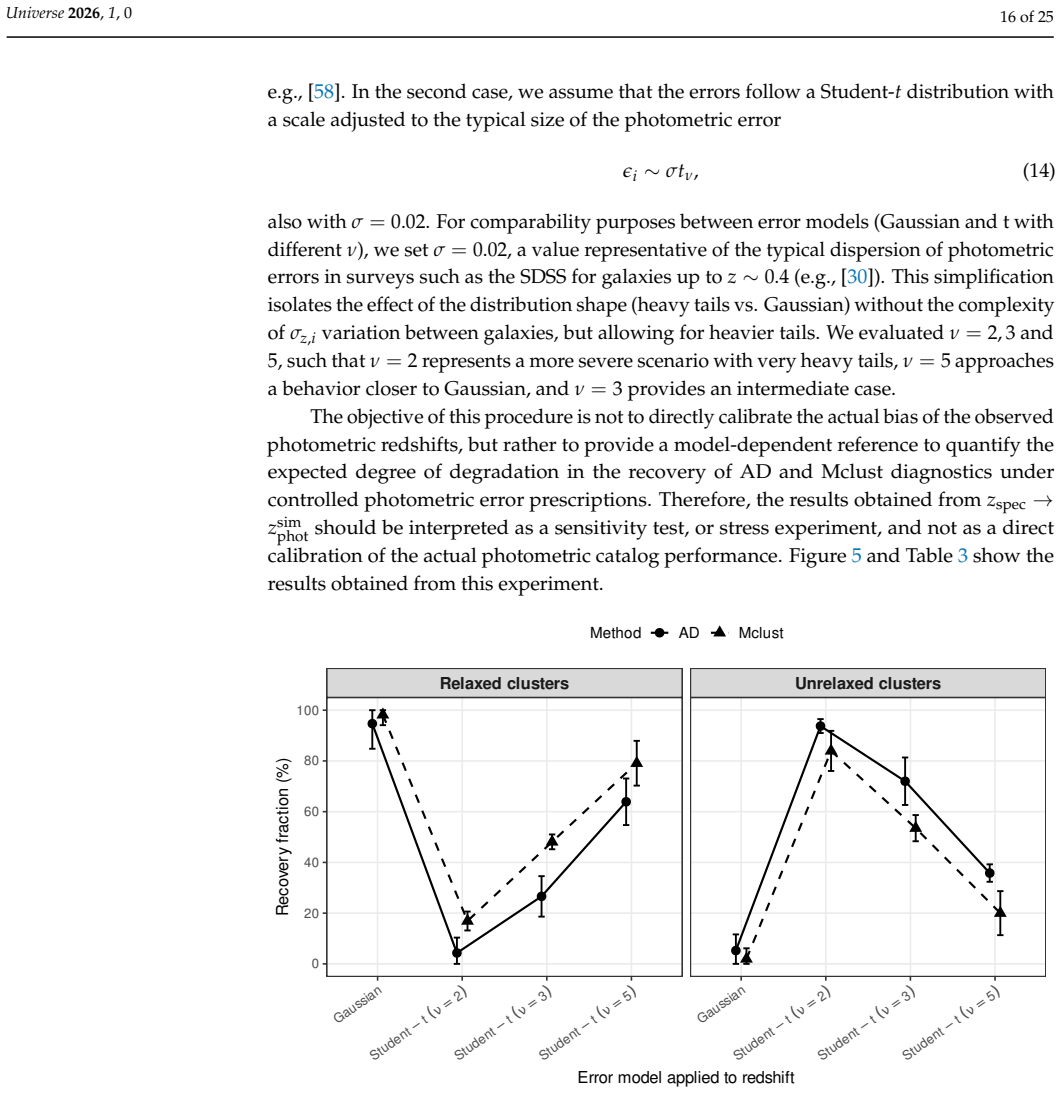
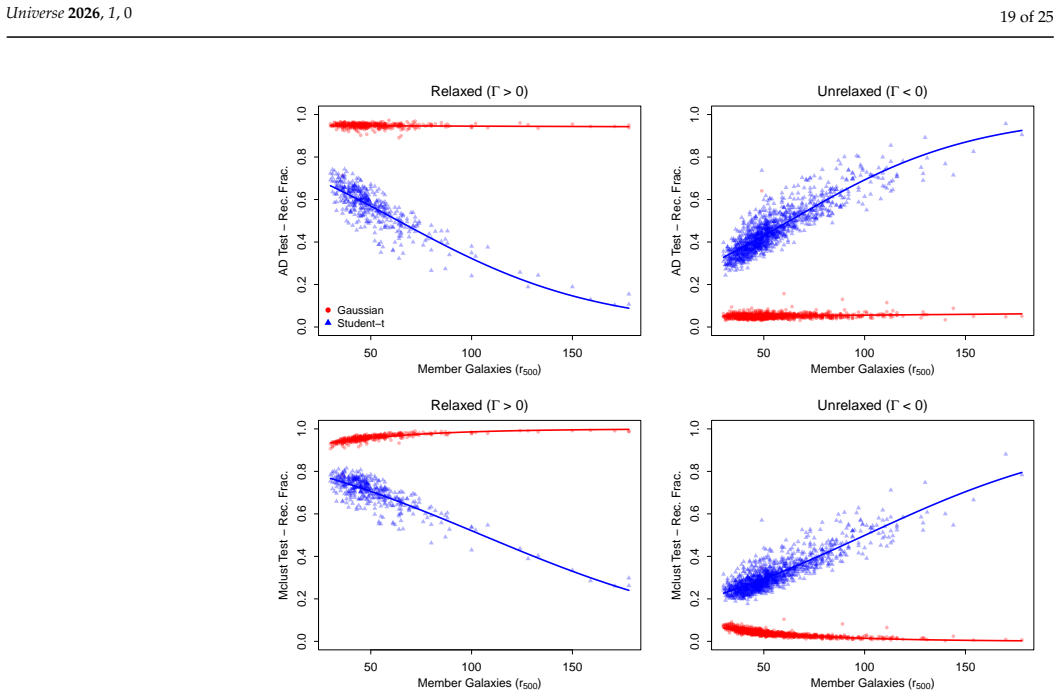
When Gaussian photometric redshift errors are propagated through cluster velocity distributions, the Anderson-Darling and Mclust tests recover relaxed systems in roughly 95 percent of realizations but unrelaxed systems in only about 5 percent, relative to the Gamma morphological proxy; Student-t errors improve unrelaxed recovery to 30-45 percent while reducing relaxed recovery to 60-70 percent, with paired Wilcoxon tests confirming the differences are significant.
What carries the argument
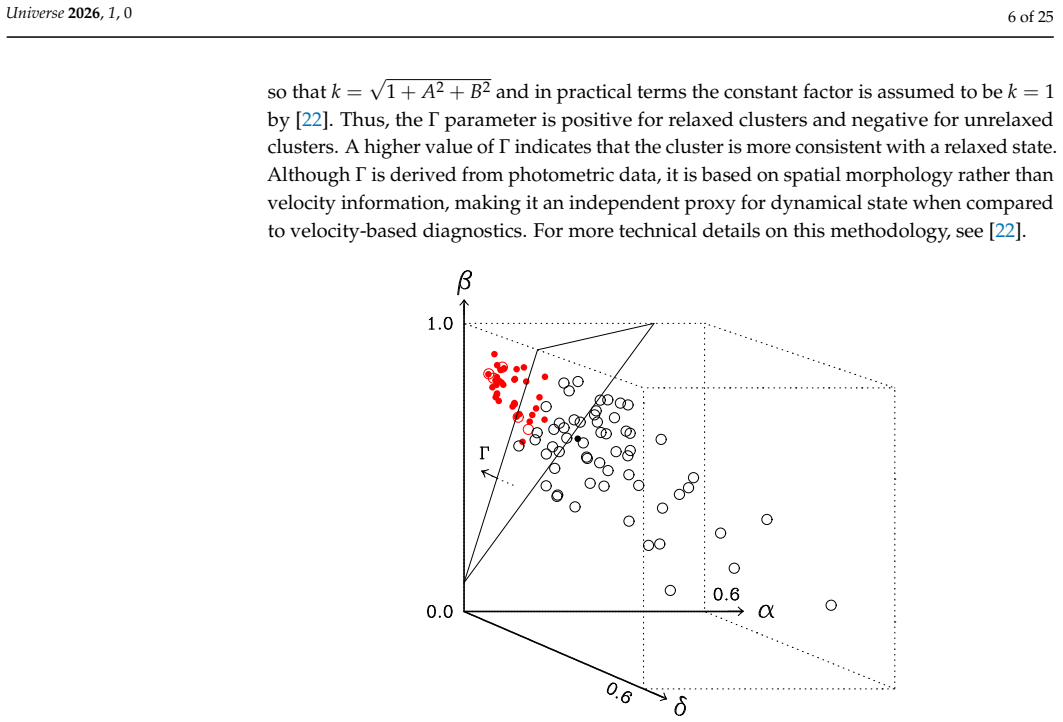
The Gamma morphological proxy acts as the independent ground-truth label for true dynamical state, against which photometric realizations of the Anderson-Darling test and Gaussian mixture modeling are benchmarked via Monte Carlo error propagation.
If this is right
- Dynamical studies based primarily on photometric data will significantly underestimate the fraction of disturbed clusters.
- Large photometric surveys require spectroscopic calibration, outlier mitigation, and realistic mock validation to avoid biased relaxation statistics.
- The choice of error model directly controls how completely unrelaxed clusters are recovered.
Where Pith is reading between the lines
- Hybrid photometric-spectroscopic samples may be needed to measure accurate disturbed-cluster fractions for structure-formation tests.
- The observed bias could systematically affect cosmological constraints derived from cluster abundance or merger rates.
- Additional observables such as X-ray or weak-lensing data could be combined with photometry to reduce misclassification.
Load-bearing premise
The Gamma morphological proxy supplies an accurate and independent record of each cluster's true dynamical state.
What would settle it
An independent dynamical indicator such as X-ray morphology or weak-lensing mass maps that yields substantially different recovery fractions for the same photometric tests.
Figures
read the original abstract
Galaxy clusters are key probes of cosmology and structure formation, yet their dynamical classification traditionally relies on spectroscopic redshifts, which do not scale efficiently with survey size. As large photometric surveys such as LSST become available, photometric redshifts offer an attractive alternative, but their impact on velocity-based diagnostics remains poorly constrained. We quantify the sensitivity of two Gaussianity diagnostics - the Anderson-Darling (AD) test and Gaussian mixture modeling (Mclust) - to different photometric redshift error prescriptions. Propagating Gaussian and Student-t uncertainties through SDSS photometric velocity distributions, we assess how the error model affects recovery of cluster dynamical states established by the independent $\Gamma$ morphological proxy. Using 1672 SDSS clusters with pre-existing $\Gamma$, we perform Monte Carlo resampling under Gaussian and Student-t errors, the latter mimicking heavy-tailed uncertainties and catastrophic outliers, plus a spectroscopic control experiment with mock photometric redshifts from spectroscopic data. Under Gaussian errors, relaxed clusters are recovered in ~95% of realizations, while unrelaxed ones in only ~5%, revealing a strong bias toward relaxed classifications. Student-t errors drop relaxed recovery to ~60-70% and raise unrelaxed to ~30-45%, though still incomplete. Paired Wilcoxon tests confirm these differences are significant. This has direct implications for large photometric surveys: dynamical studies based primarily on photometric data may significantly underestimate disturbed cluster fractions without robust spectroscopic calibration, outlier mitigation, and validation with realistic mock catalogs.
Editorial analysis
A structured set of objections, weighed in public.
Referee Report
Summary. The paper quantifies how photometric redshift error models (Gaussian vs. Student-t) affect recovery of galaxy cluster dynamical states via Anderson-Darling and Mclust Gaussianity tests. Using Monte Carlo resampling on 1672 SDSS clusters whose states are labeled by a pre-existing Γ morphological proxy, it reports ~95% recovery of relaxed clusters and ~5% recovery of unrelaxed ones under Gaussian errors, with reduced bias (~60-70% relaxed, ~30-45% unrelaxed) under Student-t errors; Wilcoxon tests establish significance, and a spectroscopic control is performed. The central conclusion is that photometric-only dynamical studies will underestimate disturbed fractions without spectroscopic calibration.
Significance. If the Γ proxy is a reliable ground truth, the quantified bias and the demonstration that error-model choice materially changes classification rates are directly relevant to LSST-era photometric surveys. The manuscript supplies concrete Monte Carlo realizations, paired statistical tests, and a control experiment, which are strengths for reproducibility and falsifiability.
major comments (2)
- [Abstract, §3] Abstract and §3 (validation procedure): the recovery fractions (~95% vs ~5%) are obtained by treating the pre-existing Γ morphological labels as the reference dynamical state. No section supplies an independent check (e.g., comparison of Γ labels against spectroscopic velocity-dispersion bimodality or X-ray morphological parameters) that quantifies Γ’s own misclassification rate or possible correlation with photometric properties. This is load-bearing because the reported percentages measure fidelity to the Γ labels rather than accuracy in recovering the true dynamical state.
- [Methods] Methods (Monte Carlo section): the exact number of realizations, the precise prescription for drawing photometric redshifts from the reported error distributions, and whether the resampling accounts for cluster membership uncertainty or magnitude-dependent photo-z bias are not stated with sufficient detail to reproduce the Wilcoxon p-values or the 95%/5% figures.
minor comments (2)
- [§2] Notation for the two error models (Gaussian vs. Student-t) is introduced without an explicit equation defining the scale parameter or degrees of freedom used in the Student-t case.
- [§2] The sample of 1672 clusters is described only by reference to prior Γ catalogs; explicit selection cuts (redshift range, richness threshold, photo-z quality flags) should be tabulated for clarity.
Simulated Author's Rebuttal
We thank the referee for their careful reading and constructive comments, which help clarify the scope and limitations of our analysis. We respond to each major comment below and will revise the manuscript accordingly.
read point-by-point responses
-
Referee: [Abstract, §3] Abstract and §3 (validation procedure): the recovery fractions (~95% vs ~5%) are obtained by treating the pre-existing Γ morphological labels as the reference dynamical state. No section supplies an independent check (e.g., comparison of Γ labels against spectroscopic velocity-dispersion bimodality or X-ray morphological parameters) that quantifies Γ’s own misclassification rate or possible correlation with photometric properties. This is load-bearing because the reported percentages measure fidelity to the Γ labels rather than accuracy in recovering the true dynamical state.
Authors: We agree that the reported recovery fractions measure agreement with the Γ morphological proxy rather than absolute accuracy against an independently verified dynamical state. Γ is an established morphological indicator in the literature that is constructed from imaging parameters independent of the photometric redshifts under test. Our central result—that photometric redshift error models systematically bias the AD and Mclust tests toward relaxed classifications—remains valid as a demonstration of differential bias relative to this fixed reference. Nevertheless, we acknowledge the referee’s point and will add explicit discussion in §3 and the conclusions section noting that Γ itself may have non-zero misclassification rates and that our percentages should be interpreted as fidelity to Γ, not to the true dynamical state. We will also reference existing comparisons of Γ to other proxies where available. revision: yes
-
Referee: [Methods] Methods (Monte Carlo section): the exact number of realizations, the precise prescription for drawing photometric redshifts from the reported error distributions, and whether the resampling accounts for cluster membership uncertainty or magnitude-dependent photo-z bias are not stated with sufficient detail to reproduce the Wilcoxon p-values or the 95%/5% figures.
Authors: We thank the referee for highlighting the need for greater methodological transparency. The revised manuscript will specify: (i) 1000 Monte Carlo realizations per cluster, (ii) the exact sampling procedure (Gaussian draws using the reported photo-z uncertainty; Student-t draws with ν=3 to produce heavy tails and outliers), and (iii) that cluster membership is held fixed to the original SDSS catalog while only redshifts are resampled. Magnitude-dependent photo-z bias is not modeled because it is not provided in the SDSS photo-z catalog used; this limitation will be stated explicitly. These additions will enable exact reproduction of the Wilcoxon tests and recovery fractions. revision: yes
Circularity Check
No circularity detected; results benchmark photometric diagnostics against external independent Γ proxy
full rationale
The paper's core procedure propagates photometric redshift errors via Monte Carlo resampling and measures how often AD and Mclust diagnostics reproduce the pre-existing Γ morphological classifications. The abstract and description explicitly frame the output as 'recovery of cluster dynamical states established by the independent Γ morphological proxy' and include a spectroscopic control experiment. No equation or step defines a quantity in terms of itself, renames a fitted parameter as a prediction, or relies on a self-citation chain for the central claim. The comparison is against an external benchmark (pre-existing Γ labels from prior work), satisfying the rule that a self-contained test against external benchmarks receives score 0-2. No load-bearing step reduces to the paper's own inputs by construction.
Axiom & Free-Parameter Ledger
axioms (2)
- domain assumption Gamma morphological proxy accurately reflects true dynamical relaxation state independent of velocity distribution shape
- domain assumption Gaussian and Student-t error models capture the dominant photometric redshift uncertainty behavior
Reference graph
Works this paper leans on
-
[1]
Postman, M.; Franx, M.; Cross, N.J.G.; Holden, B.; Ford, H.C.; Illingworth, G.D.; Goto, T.; Demarco, R.; Rosati, P .; Blakeslee, J.P .; et al. The Morphology-Density Relation in z ∼ 1 Clusters. Astrophys. J. 2005, 623, 721–741. https://doi.org/10.1086/428881
-
[2]
de Carvalho, R.R.; Ribeiro, A.L.B.; Stalder, D.H.; Rosa, R.R.; Costa, A.P .; Moura, T.C. Investigating the Relation between Galaxy Properties and the Gaussianity of the Velocity Distribution of Groups and Clusters . Astrophys. J. 2017, 154, 96. https://doi.org/10.3847/1538-3881/aa7f2b
-
[3]
Costa, A.P .; Ribeiro, A.L.B.; de Carvalho, R.R.; Benavides, J.A. Boosting the evolutionary picture of Cl 0024+17 and MS 0451-03: A case study at intermediate-redshift. Mon. Not. R. Astron. Soc. 2024, 535, 1348–1363. https://doi.org/10.1093/mnras/stae2410
-
[4]
Substructures in galaxy clusters: A comparative X-ray and photometric analysis of the REXCESS sample
Foëx, G. Substructures in galaxy clusters: A comparative X-ray and photometric analysis of the REXCESS sample. arXiv 2019, arXiv:1901.09198
Pith/arXiv arXiv 2019
-
[5]
DS+: A method for the identification of cluster substructures
Benavides, J.A.; Biviano, A.; Abadi, M.G. DS+: A method for the identification of cluster substructures. Astron. Astrophys. 2023, 669, A147. https://doi.org/10.1051/0004-6361/202245422
-
[6]
Astronomical applications of distribution shape estimators
Bird, C.M.; Beers, T.C. Astronomical applications of distribution shape estimators. AJ 1993, 105, 1596–1606. https://doi.org/10.1 086/116540
1993
-
[7]
Ribeiro, A.L.B.; de Carvalho, R.R.; Trevisan, M.; Capelato, H.V .; La Barbera, F.; Lopes, P .A.A.; Schilling, A.C. SPIDER—IX. Classifying galaxy groups according to their velocity distribution . Mon. Not. R. Astron. Soc. 2013, 434, 784–795. https: //doi.org/10.1093/mnras/stt1071
-
[8]
Hou, A.; Parker, L.C.; Wilman, D.J.; McGee, S.L.; Harris, W.E.; Connelly, J.L.; Balogh, M.L.; Mulchaey, J.S.; Bower, R.G. Substructure in the most massive GEEC groups: Field-like populations in dynamically active groups. Mon. Not. R. Astron. Soc. 2012, 421, 3594–3611. https://doi.org/10.1111/j.1365-2966.2012.20586.x
-
[9]
Unusual A2142 supercluster with a collapsing core: Distribution of light and mass
Einasto, M.; Gramann, M.; Saar, E.; Liivamägi, L.J.; Tempel, E.; Nevalainen, J.; Heinämäki, P .; Park, C.; Einasto, J. Unusual A2142 supercluster with a collapsing core: Distribution of light and mass. Astron. Astrophys. 2015, 580, A69. https://doi.org/10.1051/ 0004-6361/201526399
2015
-
[10]
Automatic Redshift Determination by Use of Principal Component Analysis
Glazebrook, K.; Offer, A.R.; Deeley, K. Automatic Redshift Determination by Use of Principal Component Analysis. I. Fundamen- tals. Astrophys. J. 1998, 492, 98–109. https://doi.org/10.1086/305039
-
[11]
Quantifying Photometric Redshift Errors in the Absence of Spectroscopic Redshifts
Quadri, R.F.; Williams, R.J. Quantifying Photometric Redshift Errors in the Absence of Spectroscopic Redshifts. Astrophys. J. 2010, 725, 794–802. https://doi.org/10.1088/0004-637X/725/1/794
-
[12]
HAYATE: Photometric redshift estimation by hybridizing machine learning with template fitting
Tanigawa, S.; Glazebrook, K.; Jacobs, C.; Labbe, I.; Qin, A.K. HAYATE: Photometric redshift estimation by hybridizing machine learning with template fitting. Mon. Not. R. Astron. Soc. 2024, 530, 2012–2038. https://doi.org/10.1093/mnras/stae411
-
[13]
Template-fitting meets deep learning: Redshift estimation using physics-guided neural networks
Ferrao, J.C.; Dias, D.; Naik, P .; D’cruz, G.; Naik, A.; Khandeparkar, S.; Dessai, M.G.F. Template-fitting meets deep learning: Redshift estimation using physics-guided neural networks. J. Astrophys. Astron. 2026, 47, 28. https://doi.org/10.1007/s12036-026-10144-5
-
[14]
Predicting the Computational Cost of Deep Learning Models
Justus, D.; Brennan, J.; Bonner, S.; McGough, A.S. Predicting the Computational Cost of Deep Learning Models. arXiv 2018, arXiv:1811.11880. https://doi.org/10.48550/arXiv.1811.11880
work page internal anchor Pith review Pith/arXiv arXiv doi:10.48550/arxiv.1811.11880 2018
-
[15]
LSST Science Book, Version 2.0
Collaboration, L.S.; Abell, P .A.; Allison, J.; Anderson, S.F.; Andrew, J.R.; Angel, J.R.P .; Armus, L.; Arnett, D.; Asztalos, S.J.; Axelrod, T.S.; et al. LSST Science Book, Version 2.0. arXiv 2009, arXiv:0912.0201v1. https://doi.org/10.3390/universe1010000 Universe 2026, 1, 0 23 of 25
work page internal anchor Pith review Pith/arXiv arXiv doi:10.3390/universe1010000 2009
-
[16]
The Astrophysical Journal , year =
Ivezi´ c, Ž.; Kahn, S.M.; Tyson, J.A.; Abel, B.; Acosta, E.; Allsman, R.; Alonso, D.; AlSayyad, Y.; Anderson, S.F.; Andrew, J.; et al. LSST: From Science Drivers to Reference Design and Anticipated Data Products. Astrophys. J. 2019, 873, 111. https://doi.org/10.3847/1538-4357/ab042c
-
[17]
Lynden-Bell, D. Statistical mechanics of violent relaxation in stellar systems. Mon. Not. R. Astron. Soc. 1967, 136, 101. https://doi.org/10.1093/mnras/136.1.101
-
[18]
A dynamical analysis of twelve clusters of galaxies.Astron
Beers, T.C.; Gebhardt, K.; Forman, W.; Huchra, J.P .; Jones, C. A dynamical analysis of twelve clusters of galaxies.Astron. J. 1991, 102, 1581–1609
1991
-
[19]
A universal velocity distribution of relaxed collisionless structures
Hansen, S.H.; Moore, B.; Zemp, M.; Stadel, J. A universal velocity distribution of relaxed collisionless structures. J. Cosmol. Astropart. Phys. 2006, 2006, 014. https://doi.org/10.1088/1475-7516/2006/01/014
-
[20]
Statistical tools for classifying galaxy group dynamics
Hou, A.; Parker, L.C.; Harris, W.E.; Wilman, D.J. Statistical tools for classifying galaxy group dynamics. Astrophys. J. 2009, 702, 1199
2009
-
[21]
Multimodality in galaxy clusters from SDSS DR8: Substructure and velocity distribution
Einasto, M.; Vennik, J.; Nurmi, P .; Tempel, E.; Ahvensalmi, A.; Tago, E.; Liivamägi, L.J.; Saar, E.; Heinämäki, P .; Einasto, J.; et al. Multimodality in galaxy clusters from SDSS DR8: Substructure and velocity distribution. Astron. Astrophys. 2012, 540, A123. https://doi.org/10.1051/0004-6361/201118697
-
[22]
Substructure and dynamical state of 2092 rich clusters of galaxies derived from photometric data
Wen, Z.L.; Han, J.L. Substructure and dynamical state of 2092 rich clusters of galaxies derived from photometric data. Mon. Not. R. Astron. Soc. 2013, 436, 275–293. https://doi.org/10.1093/mnras/stt1581
-
[23]
2011, ApJS, 193, 29, doi: 10.1088/0067-0049/193/2/29
Aihara, H.; Allende Prieto, C.; An, D.; Anderson, S.F.; Aubourg, É.; Balbinot, E.; Beers, T.C.; Berlind, A.A.; Bickerton, S.J.; Bizyaev, D.; et al. The Eighth Data Release of the Sloan Digital Sky Survey: First Data from SDSS-III. Astrophys. J. Suppl. Ser. 2011, 193, 29. https://doi.org/10.1088/0067-0049/193/2/29
-
[24]
A Catalog of 132,684 Clusters of Galaxies Identified from Sloan Digital Sky Survey III
Wen, Z.L.; Han, J.L.; Liu, F.S. A Catalog of 132,684 Clusters of Galaxies Identified from Sloan Digital Sky Survey III. Astrophys. J. Suppl. Ser. 2012, 199, 34. https://doi.org/10.1088/0067-0049/199/2/34
-
[25]
Galaxy Clusters Identified from the SDSS DR6 and Their Properties
Wen, Z.L.; Han, J.L.; Liu, F.S. Galaxy Clusters Identified from the SDSS DR6 and Their Properties. Astrophys. J. Suppl. Ser. 2009, 183, 197–213. https://doi.org/10.1088/0067-0049/183/2/197
-
[26]
The Galaxy Luminosity Function and Luminosity Density at Redshift z = 0.1
Blanton, M.R.; Hogg, D.W.; Bahcall, N.A.; Brinkmann, J.; Britton, M.; Connolly, A.J.; Csabai, I.; Fukugita, M.; Loveday, J.; Meiksin, A.; et al. The Galaxy Luminosity Function and Luminosity Density at Redshift z = 0.1. Astrophys. J. 2003, 592, 819–838. https://doi.org/10.1086/375776
-
[27]
Ahn, C.P .; Alexandroff, R.; Allende Prieto, C.; Anderson, S.F.; Anderton, T.; Andrews, B.H.; Aubourg, É.; Bailey, S.; Balbinot, E.; Barnes, R.; et al. The Ninth Data Release of the Sloan Digital Sky Survey: First Spectroscopic Data from the SDSS-III Baryon Oscillation Spectroscopic Survey. Astrophys. J. Suppl. Ser. 2012, 203, 21. https://doi.org/10.1088/...
-
[28]
Mass-Temperature Relation of Galaxy Clusters: Implications from the Observed Luminosity-Temperature Relation and X-Ray Temperature Function
Shimizu, M.; Kitayama, T.; Sasaki, S.; Suto, Y. Mass-Temperature Relation of Galaxy Clusters: Implications from the Observed Luminosity-Temperature Relation and X-Ray Temperature Function. Astrophys. J. 2003, 590, 197–206. https://doi.org/10.1086/ 367955
2003
-
[29]
The structure of star clusters
King, I. The structure of star clusters. I. an empirical density law. Astrophys. J. 1962, 67, 471. https://doi.org/10.1086/108756
-
[30]
Ilbert, O.; Arnouts, S.; McCracken, H.J.; Bolzonella, M.; Bertin, E.; Le Fèvre, O.; Mellier, Y.; Zamorani, G.; Pellò, R.; Iovino, A.; et al. Accurate photometric redshifts for the CFHT legacy survey calibrated using the VIMOS VLT deep survey. Astron. Astrophys. 2006, 457, 841–856. https://doi.org/10.1051/0004-6361:20065138
work page internal anchor Pith review doi:10.1051/0004-6361:20065138 2006
-
[31]
Velocity dispersion and dynamical mass for 270 galaxy clusters in the Planck PSZ1 catalogue
Ferragamo, A.; Barrena, R.; Rubino-Mart’in, J.; Aguado-Barahona, A.; Streblyanska, A.; Tramonte, D.; G’enova-Santos, R.; Hempel, A.; Lietzen, H. Velocity dispersion and dynamical mass for 270 galaxy clusters in the Planck PSZ1 catalogue. Astron. Astrophys. 2021, 655, A115. https://doi.org/10.1051/0004-6361/202140382
-
[32]
Velocity dispersions in galaxy clusters
Girardi, M.; Biviano, A.; Giuricin, G.; Mardirossian, F.; Mezzetti, M. Velocity dispersions in galaxy clusters. Astrophys. J. 1993, 404, 38–50. https://doi.org/10.1086/172256
-
[33]
EDF statistics for goodness of fit and some comparisons
Stephens, M.A. EDF statistics for goodness of fit and some comparisons. J. Am. Stat. Assoc. 1974, 69, 730–737
1974
-
[34]
Connecting optical and X-ray tracers of galaxy cluster relaxation
Roberts, I.D.; Parker, L.C.; Hlavacek-Larrondo, J. Connecting optical and X-ray tracers of galaxy cluster relaxation. Mon. Not. R. Astron. Soc. 2018, 475, 4704–4716. https://doi.org/10.1093/mnras/sty131
-
[35]
Pajowska, P .; Godłowski, W.; Zhu, Z.H.; Popiela, J.; Panko, E.; Flin, P . Investigation of the orientation of galaxies in clusters: The importance, methods and results of research. J. Cosmol. Astropart. Phys. 2019, 2019, 005. https://doi.org/10.1088/1475-7516/20 19/02/005
-
[36]
Integrated empirical measures and generalizations of classical goodness-of-fit statistics
Hwang, H.K.; Kuriki, S. Integrated empirical measures and generalizations of classical goodness-of-fit statistics. Electron. J. Stat. 2025, 19, 2276–2319. https://doi.org/10.1214/25-EJS2386
-
[37]
CODEX: Role of velocity substructure in the scaling relations of galaxy clusters
Damsted, S.; Finoguenov, A.; Clerc, N.; Davalgait˙e, I.; Kirkpatrick, C.C.; Mamon, G.A.; Ider Chitham, J.; Kiiveri, K.; Comparat, J.; Collins, C. CODEX: Role of velocity substructure in the scaling relations of galaxy clusters. Astron. Astrophys. 2023, 676, A127. https://doi.org/10.1051/0004-6361/202245308
-
[38]
CHEX-MATE: Exploring the kinematical properties of Planck galaxy clusters
Pizzuti, L.; Barrena, R.; Sereno, M.; Streblyanska, A.; Ferragamo, A.; Maurogordato, S.; Cappi, A.; Ettori, S.; Pratt, G.W.; Castignani, G.; et al. CHEX-MATE: Exploring the kinematical properties of Planck galaxy clusters. Astron. Astrophys. 2025, 699, A88. https://doi.org/10.1051/0004-6361/202555417. https://doi.org/10.3390/universe1010000 Universe 2026,...
-
[39]
Model-based methods of classification: Using the mclust software in chemometrics
Fraley, C.; Raftery, A.E.; et al. Model-based methods of classification: Using the mclust software in chemometrics. J. Stat. Softw. 2007, 18, 1–13
2007
-
[40]
https://doi.org/10.1201/9781003277965
Scrucca, L.; Fraley, C.; Murphy, T.; E., R.A.Model-Based Clustering, Classification, and Density Estimation Using Mclust in R; CRC: New York, NY, USA, 2023. https://doi.org/10.1201/9781003277965
-
[41]
Lopes, P .; Ribeiro, A.L.B.; Brambila, D. The Role of Groups in Galaxy Evolution: Compelling evidence of pre-processing out to the turnaround radius of clusters. Mon. Not. R. Astron. Soc. Lett. 2023, 527, L19–L25. https://doi.org/10.1093/mnrasl/slad134
-
[42]
Brambila, D.; Lopes, P .; Ribeiro, A.; Cortesi, A. Examining transitional galaxies to understand the role of clusters and their dynamical status in galaxy quenching. Mon. Not. R. Astron. Soc. 2023, 523, 785–801. https://doi.org/10.1093/mnras/stad1233
-
[43]
An approach to robust Bayesian regression in astronomy
Martin, W.; Mortlock, D.J. An approach to robust Bayesian regression in astronomy. Ras Tech. Instruments 2024, 4, rzaf035. https://doi.org/10.1093/rasti/rzaf035
-
[44]
Kelly, B.C.; Shetty, R.; Stutz, A.M.; Kauffmann, J.; Goodman, A.A.; Launhardt, R. Dust Spectral Energy Distributions in the Era of Herschel and Planck: A Hierarchical Bayesian-fitting Technique. Astrophys. J. 2012, 752, 55. https://doi.org/10.1088/0004-637X/ 752/1/55
-
[45]
Nortest: Tests for Normality; R package version 1.0-4; CRAN: Kewdale, Australia, 2015
Gross, J.; Ligges, U. Nortest: Tests for Normality; R package version 1.0-4; CRAN: Kewdale, Australia, 2015. https://doi.org/10.326 14/CRAN.package.nortest
2015
-
[46]
Lan, F.; Young, M.; Anderson, L.; Ynnerman, A.; Bock, A.; Borkin, M.; Forbes, A.; Kollmeier, J.; Wang, B. Visualization in Astrophysics: Developing New Methods, Discovering Our Universe, and Educating the Earth. Comput. Graph. Forum 2021, 40, 635–663. https://doi.org/10.1111/cgf.14332
-
[47]
The Integrated Violin-Box-Scatter (VBS) Plot to Visualize the Distribution of a Continuous Variable
Gerbing, D. The Integrated Violin-Box-Scatter (VBS) Plot to Visualize the Distribution of a Continuous Variable. Stats 2024, 7, 955–966. https://doi.org/10.3390/stats7030058
-
[48]
Recurrence plots for the analysis of complex systems
Marwan, N.; Romano, M.; Thiel, M.; Kurths, J. Recurrence plots for the analysis of complex systems. Phys. Rep. 2025, 438, 237–329. https://doi.org/10.1016/j.physrep.2006.11.001
-
[49]
Violin plots as visual tools in the meta-analysis of Single-Case Experimental Designs
Tanious, R.; Manolov, R. Violin plots as visual tools in the meta-analysis of Single-Case Experimental Designs. Methodology 2022,
2022
-
[50]
https://doi.org/10.5964/meth.9209
-
[51]
Is there a large sample size problem? Ophthalmic Physiol
Armstrong, R. Is there a large sample size problem? Ophthalmic Physiol. Opt. 2019, 39, 129 –130. https://doi.org/10.1111/opo.12 618
-
[52]
The noise error component in stochastic frontier analysis
Papadopoulos, A. The noise error component in stochastic frontier analysis. Empir. Econ. 2022, 64, 2795–2829. https: //doi.org/10.1007/s00181-022-02339-w
-
[53]
Nonparametric Statistical Methods; Wiley Series in Probability and Statistics; Wiley: Hoboken, NJ, USA, 2013
Hollander, M.; Wolfe, D.; Chicken, E. Nonparametric Statistical Methods; Wiley Series in Probability and Statistics; Wiley: Hoboken, NJ, USA, 2013
2013
-
[54]
Another Argument in Favour of Wilcoxon's Signed Rank Test
Rosenblatt, J.; Benjamini, Y. Another Argument in Favour of Wilcoxon’s Signed Rank Test. arXiv 2013, arXiv:1311.5354. https://doi.org/10.48550/arXiv.1311.5354
work page internal anchor Pith review Pith/arXiv arXiv doi:10.48550/arxiv.1311.5354 2013
-
[55]
Velocity segregation effects in galaxy clusters at 0.4 ≲ z ≲ 1.5
Barsanti, S.; Girardi, M.; Biviano, A.; Borgani, S.; Annunziatella, M.; Nonino, M. Velocity segregation effects in galaxy clusters at 0.4 ≲ z ≲ 1.5. Astron. Astrophys. 2016, 595, A73. https://doi.org/10.1051/0004-6361/201629012
-
[56]
Optical substructure and BCG offsets of Sunyaev-Zel’dovich and X-ray-selected galaxy clusters
Lopes, P .A.A.; Trevisan, M.; Laganá, T.F.; Durret, F.; Ribeiro, A.L.B.; Rembold, S.B. Optical substructure and BCG offsets of Sunyaev-Zel’dovich and X-ray-selected galaxy clusters. Mon. Not. R. Astron. Soc. 2018, 478, 5473–5490. https://doi.org/10.1093/ mnras/sty1374
2018
-
[57]
Zarattini, S.; Biviano, A.; Aguerri, J.A.L.; Girardi, M.; D’Onghia, E. Fossil group origins. XI. The dependence of galaxy orbits on the magnitude gap. Astron. Astrophys. 2021, 655, A103. https://doi.org/10.1051/0004-6361/202038722
-
[58]
The dynamical state of eROSITA clusters and its impact on the brightest cluster galaxy luminosity
Zenteno, A.; Kluge, M.; Kharkrang, R.; Hernandez-Lang, D.; Damke, G.; Saro, A.; Monteiro-Oliveira, R.; Carrasco, E.R.; Salvato, M.; Comparat, J.; et al. The dynamical state of eROSITA clusters and its impact on the brightest cluster galaxy luminosity. Astron. Astrophys. 2025, 698, A171. https://doi.org/10.1051/0004-6361/202452440
-
[59]
Cosmological Studies from Tomographic Weak Lensing Peak Abundances and Impacts of Photo-z Errors
Yuan, S.; Pan, C.; Liu, X.; Wang, Q.; Fan, Z. Cosmological Studies from Tomographic Weak Lensing Peak Abundances and Impacts of Photo-z Errors. Astrophys. J. 2019, 884, 164. https://doi.org/10.3847/1538-4357/ab40a5
-
[60]
Beta Regression for Modelling Rates and Proportions
Ferrari, S.; Cribari-Neto, F. Beta Regression for Modelling Rates and Proportions. J. Appl. Stat. 2004, 31, 799–815. https: //doi.org/10.1080/0266476042000214501
-
[61]
Regression analysis of variates observed on (0, 1): Percentages, proportions and fractions
Kieschnick, R.; McCullough, B.D. Regression analysis of variates observed on (0, 1): Percentages, proportions and fractions. Stat. Model. 2003, 3, 193–213. https://doi.org/10.1191/1471082X03st053oa
-
[62]
Extended Beta Regression in R: Shaken, Stirred, Mixed, and Partitioned
Grün, B.; Kosmidis, I.; Zeileis, A. Extended Beta Regression in R: Shaken, Stirred, Mixed, and Partitioned. J. Stat. Softw. 2012, 48, 1–25. https://doi.org/10.18637/jss.v048.i11
-
[63]
Unveiling the Dynamics in Galaxy Clusters: The Hidden Role of Low-Luminosity Galaxies in Coma
Costa, A.P .; Ribeiro, A.L.B.; de Morais Neto, F.R.; dos Santos Junior, J. Unveiling the Dynamics in Galaxy Clusters: The Hidden Role of Low-Luminosity Galaxies in Coma. Universe 2025, 11, 82. https://doi.org/10.3390/universe11030082
-
[64]
Capozzi, D.; Collins, C.A.; Stott, J.P .; Hilton, M. The evolution of K* and the halo occupation distribution since z= 1.5: Observations versus simulations. Mon. Not. R. Astron. Soc. 2012, 419, 2821–2835. https://doi.org/10.1111/j.1365-2966.2011.19895.x. https://doi.org/10.3390/universe1010000 Universe 2026, 1, 0 25 of 25
-
[65]
2018, MNRAS, 473, 4077, doi: 10.1093/mnras/stx2656
Pillepich, A.; Springel, V .; Nelson, D.; Genel, S.; Naiman, J.; Pakmor, R.; Hernquist, L.; Torrey, P .; Vogelsberger, M.; Weinberger, R.; et al. Simulating galaxy formation with the IllustrisTNG model. Mon. Not. R. Astron. Soc. 2018, 473, 4077–4106. https://doi.org/10.1093/mnras/stx2656
work page internal anchor Pith review doi:10.1093/mnras/stx2656 2018
-
[66]
Photometric Redshift Error Estimators
Oyaizu, H.; Lima, M.; Cunha, C.E.; Lin, H.; Frieman, J. Photometric Redshift Error Estimators. Astrophys. J. 2008, 689, 709–720. https://doi.org/10.1086/592591
-
[67]
Li, Y.; Fu, L.; Chen, Z.; Luo, Z.; Du, W.; Gong, Y.; Meng, X.; Lu, J.; Tang, Z.; Chen, P .; et al. Improving Photometric Redshift Estimation for CSST Mock Catalog Using SED Templates Calibrated with Perturbation Algorithm. Res. Astron. Astrophys. 2025, 25, 055021. https://doi.org/10.1088/1674-4527/adcc7e
-
[68]
Dennis, M.T.; Hu, E.M.; Cowie, L.L. Identifying Catastrophic Outlier Photometric Redshift Estimates in the COSMOS Field with Machine Learning Methods. Astrophys. J. 2025, 983, 173. https://doi.org/10.3847/1538-4357/adbe62
-
[69]
Improving Photometric Redshift Estimates with Training Sample Augmentation
Moskowitz, I.; Gawiser, E.; Crenshaw, J.F.; Andrews, B.H.; Malz, A.I.; Schmidt, S.; LSST Dark Energy Science Collaboration. Improving Photometric Redshift Estimates with Training Sample Augmentation. Astrophys. J. 2024, 967, L6. https://doi.org/10.3 847/2041-8213/ad4039
2024
-
[70]
Effects of Photometric Redshift Uncertainties on Weak-Lensing Tomography
Ma, Z.; Hu, W.; Huterer, D. Effects of Photometric Redshift Uncertainties on Weak-Lensing Tomography. Astrophys. J. 2006, 636, 21–29. https://doi.org/10.1086/497068
-
[71]
The LSST Dark Energy Science Collaboration (DESC) Science Requirements Document
The LSST Dark Energy Science Collaboration.; Mandelbaum, R.; Eifler, T.; Hložek, R.; Collett, T.; Gawiser, E.; Scolnic, D.; Alonso, D.; Awan, H.; Biswas, R.; et al. The LSST Dark Energy Science Collaboration (DESC) Science Requirements Document. arXiv 2018, arXiv:1809.01669. https://doi.org/10.48550/arXiv.1809.01669
-
[72]
The LSST DESC DC2 Simulated Sky Survey
LSST Dark Energy Science Collaboration (LSST DESC).; Abolfathi, B.; Alonso, D.; Armstrong, R.; Aubourg, É.; Awan, H.; Babuji, Y.N.; Bauer, F.E.; Bean, R.; Beckett, G.; et al. The LSST DESC DC2 Simulated Sky Survey. Astrophys. J. Suppl. Ser. 2021, 253, 31. https://doi.org/10.3847/1538-4365/abd62c. Disclaimer/Publisher’s Note: The statements, opinions and d...
discussion (0)
Sign in with ORCID, Apple, or X to comment. Anyone can read and Pith papers without signing in.