REVIEW 3 major objections 5 minor 30 references
A Deep Generative Model for the Simulation of Discrete Karst Networks
T0 review · 3 major / 5 minor · reviewed 2026-08-07 · deepseek-v4-flash
Pith's one-line read A two-stage graph generative pipeline trained on overlapping subgraphs of a single surveyed karst network reproduces the network's topology and most geometry metrics, with branch tortuosity consistently too high.
desk verdict An honest and reproducible first step toward learning karst network generation from a single survey, but the in-sample evaluation stops well short of the cross-formation claim. read the letter →
The pith
A machine-rendered reading of the paper's core claim, the machinery that carries it, and where it could break.
The reading
What carries the argument
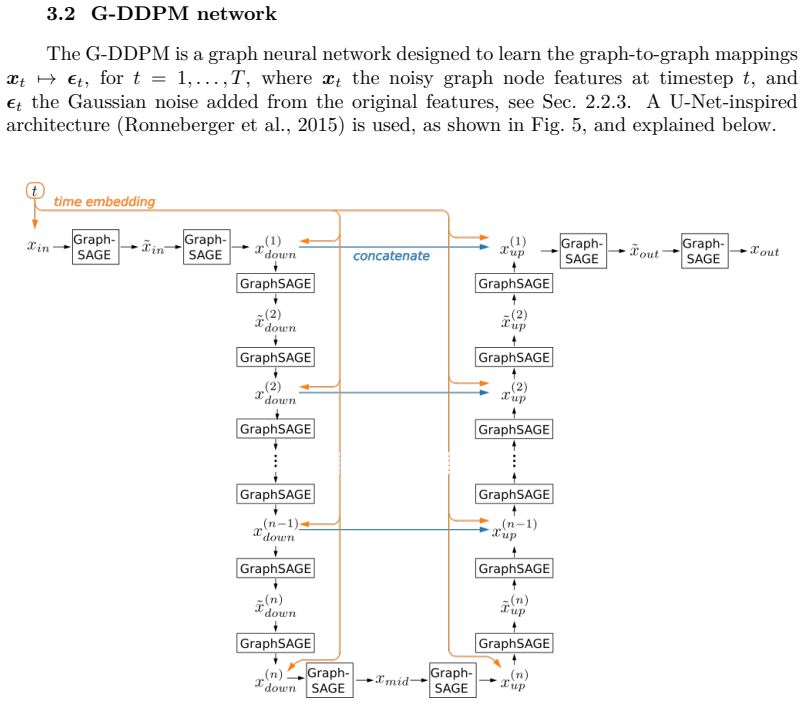
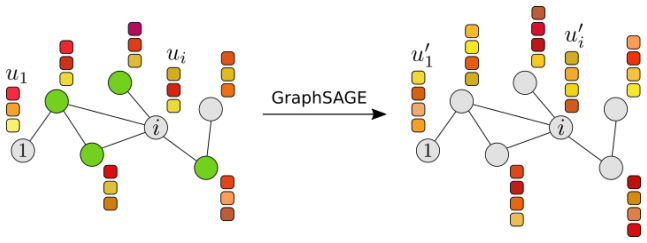
The load-bearing object is the two-step generative pipeline: GraphRNN, an autoregressive recurrent network that emits graph topology one node at a time under a breadth-first-search node ordering, and G-DDPM, a denoising diffusion model whose U-Net-style graph neural network (GraphSAGE layers) learns to remove noise from continuous node features while keeping the topology fixed. The argument is carried by the separation of topology from geometry, plus a data-augmentation step that extracts 500 connected BFS subgraphs of controlled size from a single main graph. The accompanying evaluation machinery is a set of ten statistical metrics—five geometric and five topological—computed on both training and generated graphs.
What would settle it
Train the pipeline on one surveyed karst network, then generate a large ensemble and compare its full-network statistics—branch-length distribution, tortuosity, degree correlations, and the joint distribution of cross-section width and height—against an independent survey of a different formation that was never used in training; the central claim fails if the same systematic tortuosity inflation and near-Gaussian feature distributions appear there, or if the generated ensembles cannot reproduce the statistics of a held-out portion of the same cave.
Extended reading notes
Core claim
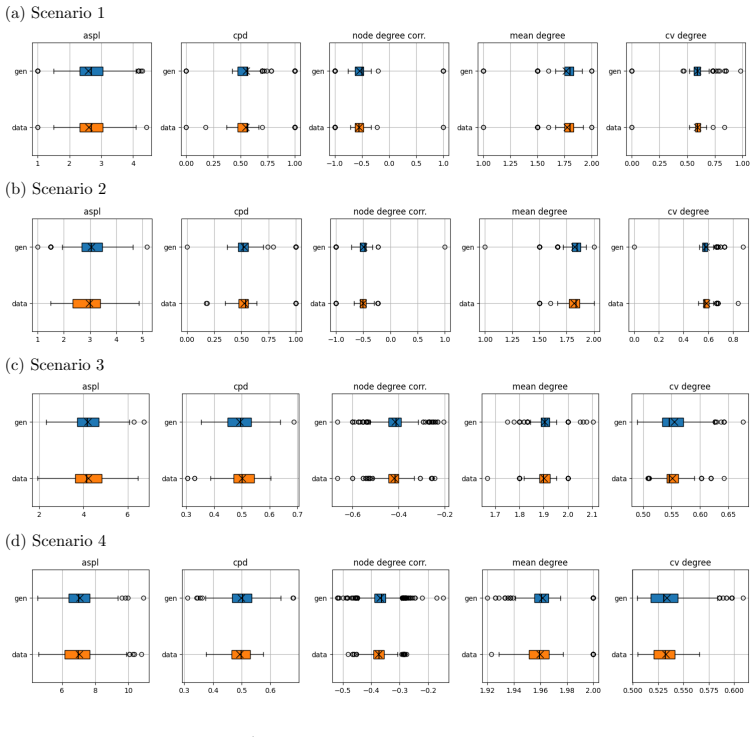
The central claim is that a purely statistical, graph-based deep generative model can capture the distribution of discrete karst networks well enough for stochastic simulation. The paper demonstrates this with a two-step architecture: GraphRNN learns the sequential, BFS-ordered adjacency structure, and G-DDPM learns to denoise continuous node features—spatial coordinates plus, in the 3D case, log cross-section width and height—on the generated topology. On both test systems the topological metrics (average shortest path length, central point dominance, degree correlation, mean and coefficient of variation of degree) are reproduced with little difference, and the geometric metrics are mostly reproduced; the paper's own results show mean tortuosity as the one persistent failure, with generated branches more winding than surveyed ones, and the generated log cross-section features clinging to Gaussian shapes. The authors interpret this as evidence that the method learns the skeleton and connectivity of karst systems while struggling with the fine spatial placement of degree-2 nodes, and they argue the approach can transfer to other karstic environments because it does not depend on formation-specific physical processes.
Load-bearing premise
The whole approach rests on the assumption that 500 overlapping local chunks cut from one surveyed cave network represent the variability of that formation, and of other karst formations, so a model trained on those chunks can generate realistic networks elsewhere.
Editorial extensions
If this is right
- Stochastic discrete karst networks can be generated from a single mapped survey, replacing chemistry-based or fast-marching simulators that need a geological grid and many parameters.
- Ensembles of generated networks can feed groundwater flow and transport models, directly addressing the structural uncertainty that dominates prediction uncertainty in karst aquifers.
- The same two-step recipe extends from a nearly 2D coastal cave system to a 3D alpine network with conduit cross-section data, so the method is not tied to one morphology.
- Generated networks should be used with caution in applications sensitive to conduit sinuosity, because the paper's own results show mean tortuosity is systematically higher in generated graphs.
- The authors propose the model could fill unmapped or inaccessible sections of a cave with plausible structures, which would require conditioning generated graphs on existing mapped fragments.
Reading between the lines
- The 'various types of formations' claim is broader than the evidence: both test networks were used to build their own training sets, so cross-formation transfer is asserted, not demonstrated; a third, independent karst survey would be the decisive test.
- The consistently high tortuosity is consistent with G-DDPM adding independent coordinate noise on topologies it never saw during training; a cheap test would be to smooth generated branches or condition on branch-angle distributions and see whether the other geometry metrics stay intact.
- Because BFS subgraphs are overlapping neighborhoods of a single graph, the training distribution is not an i.i.d. sample of karst networks; comparing subgraph statistics with whole-network statistics would reveal how much local bias the augmentation injects.
- The near-Gaussian generated distributions for log cross-section width and height suggest the diffusion model is not capturing feature-feature or feature-space correlations; reporting joint statistics, such as width versus local curvature, would make the limitation visible.
Editorial analysis
A structured set of objections, weighed in public.
Referee Report
Summary. The paper proposes a two-step deep generative pipeline for stochastic simulation of discrete karst networks: GraphRNN generates graph topology, and a graph denoising diffusion probabilistic model (G-DDPM) generates node features (coordinates and additional attributes such as conduit width and height). To obtain training data from a single mapped network, the authors extract 500 connected subgraphs by breadth-first search with a prescribed Gaussian node-count distribution. The method is tested on two real karst systems, Ox Bel Ha (2D, 10,098 nodes) and Sakany (3D, 1,424 nodes). Evaluation compares ten geometry and topology metrics between the BFS-subgraph training set and the generated graphs. The authors report good matches for topology metrics and for most geometry metrics, but acknowledge a systematic overestimation of tortuosity in both case studies. The abstract claims the methodology allows stochastic simulation of discrete karst networks across various types of formations.
Significance. The paper is a novel application of graph generative models to a geoscience problem where stochastic simulation matters for uncertainty quantification in flow and transport. The two-step design, separating topology generation from feature generation, is sensible and the choice of metrics follows established karst-network characterization practice. The authors provide open code and data for the Sakany case, which is a concrete reproducibility asset. If the system-scale and cross-formation claims were established, the method would be a useful complement to process-based karst simulators. However, the evidence currently supports a narrower statement: the model reproduces local BFS-subgraph statistics of the two training networks reasonably well on most metrics, with a known geometry deficiency. The generalization of the trained model to full formation-scale networks and to other formations is not demonstrated.
major comments (3)
- [Sec. 5.1 and Figs. 10, 11, 15] The evaluation is entirely in-sample with respect to the BFS-subgraph training distribution. Generated graphs are compared only to subgraphs of the same type from which the training data were drawn, never to the full surveyed networks (Ox Bel Ha: 10,098 nodes; Sakany: 1,424 nodes) or to any independent karst survey. Because BFS subgraphs are overlapping local patches with node counts constrained to N(mu, sigma^2), their metric distributions reflect patch size and boundary effects; matching them is necessary but not sufficient for realism at the system scale relevant to flow and transport. The abstract's claim of stochastic simulation of discrete karst networks across various types of formations therefore goes beyond what the experiments demonstrate. Please add a comparison of generated full-size networks (or suitably assembled outputs) to the full-network metrics, or explicitly revise the central claim to the local-subgraph level.
- [Sec. 5.2, Fig. 10; Sec. 5.3, Fig. 15] The mean tortuosity is consistently higher for generated graphs in all Ox Bel Ha scenarios and in the Sakany case, and the coefficient of variation of branch length is also higher for Sakany. This is a geometry error in the direction that directly affects flow-path lengths and transport behavior, yet the paper does not quantify the discrepancy or test its impact on flow and transport. Since the stated motivation is that the generated networks be useful for studying flow and transport, the manuscript should either (i) reduce the tortuosity excess through the branch-smoothing pre-processing proposed in Sec. 6, (ii) quantify the magnitude of the bias and its practical consequences, or (iii) clearly delimit the claims to topology and coarse geometry.
- [Sec. 5.1 and Sec. 6] The data-augmentation premise is that N=500 BFS-sampled subgraphs extracted from one main graph represent the variability of the whole formation and, by extension, of other formations. No evidence is given that the local subgraph statistics match the global network statistics, nor that the Gaussian node-count distribution is appropriate. The text asserts that 'the extracted subgraphs best preserve the local topology' but does not show that local topology is representative of the system-scale connectivity. Please provide a diagnostic comparing the ten metrics computed on the full networks with the distribution of the same metrics on the subgraph training set, and discuss how overlapping, statistically dependent BFS patches support generalization to different karst environments.
minor comments (5)
- [Sec. 3.1] The statement that hyperparameters were 'set after some trial' is vague; please report the number of trials or at least the range considered, because the claimed flexibility of the architecture is otherwise difficult to assess.
- [Sec. 4] The Karstnet package is referenced only by URL; please add a formal citation or version identifier for the package in the references.
- [Sec. 5.3, Fig. 14 caption] The caption says 'for the four scenarios (each row)' but the Sakany study uses a single scenario; the caption should be corrected.
- [Throughout] There are several typographical errors, including 'betweeen' (Sec. 5.3), 'bottelneck' (Sec. 3.2), 'featuresis' (Sec. 5.1), and inconsistent notation for the Gaussian distribution (e.g., 'N(75,7.52)' should be 'N(75, 7.5^2)').
- [Sec. 6] The sentence 'this research area is entirely new' overstates novelty: stochastic karst network generators exist (Jaquet et al., 2004; Borghi et al., 2012; Fandel et al., 2022) and graph generative models exist (GraphRNN, G-DDPM); the novelty lies in the specific combination and application, which is already clear from the rest of the paper.
Circularity Check
No significant circularity: the generative pipeline is trained with standard losses and evaluated post hoc; the in-sample subgraph comparison is a generalizability limitation, not a derivation that reduces to its inputs.
full rationale
The derivation chain is self-contained with respect to the two external generative methods it builds on. GraphRNN is trained by teacher forcing with a binary cross-entropy loss, and G-DDPM is trained with an MSE loss on the added noise; neither loss optimizes the ten evaluation metrics, which are computed post hoc on generated samples. There is no equation in the paper that defines a predicted quantity in terms of a fitted parameter or vice versa. The hyperparameters are acknowledged as chosen by trial (Sec. 3.1), and the BFS window size m is a data-derived preprocessing constant (Sec. 2.1.1); neither is renamed as a prediction. The main validity weakness is that generated graphs are compared only to the BFS-subgraph training distribution (Figs. 10, 11, 15), not to a held-out set or the full surveyed networks, which makes the system-scale and cross-formation claims under-supported. That is an in-sample evaluation and generalization concern, not circularity: the model is trained to reproduce a distribution, and matching the training distribution is a sanity check rather than an independent prediction. The paper itself flags the main failure (tortuosity is consistently higher for generated subgraphs, Sec. 5.2) and explicitly states that conditioning on existing paths and realistic extrapolation require further research (Sec. 6). Self-citations, such as Collon et al. (2017) for the statistical metrics and prior DKN modeling work, provide published external methodology and are not load-bearing justifications of the central result. No uniqueness theorem, ansatz, or known result is imported from the authors' own prior work to force the conclusion. The reported topology match is a genuine empirical result, though its generalization scope is narrower than the abstract claims.
Assumptions & free parameters
free parameters (5)
- BFS neighborhood size m =
99.9th percentile over 100,000 BFS orderings of dataset graphs (not stated numerically)
- Subgraph node-count distribution (mean mu, variance sigma^2) =
N(75,7.5^2), N(100,10^2), N(200,20^2), N(500,50^2) per scenario
- Diffusion timesteps T and training epochs =
T=2400, epochs=1201 for G-DDPM; 5*(mu+3*sigma) epochs for GraphRNN
- G-DDPM U-Net hidden width and GraphSAGE depth =
8*d feature width, n=25 GraphSAGE operations
- GraphRNN hidden sizes and layer counts =
L_G=L_E=4 layers, d_G,hidden=48, d_E,GRU(in)=24, etc.
assumptions (5)
- domain assumption A karst conduit network is adequately represented as an undirected graph whose edges are conduits and whose node features are independent given the topology.
- ad hoc to paper BFS subgraphs of the first n nodes preserve the local topology and local statistics of the full network.
- standard math The DDPM forward process with scalar covariance beta_t*I converges to independent Gaussians, so the reverse process can be learned by MSE on the noise.
- domain assumption Karst networks are 'particularly regular', so a small BFS window m suffices.
- standard math Teacher forcing with binary cross-entropy on adjacency bits yields a valid graph topology distribution at inference.
Cite this review
Pith. "Pith review of A Deep Generative Model for the Simulation of Discrete Karst Networks." pith.science (2026). https://pith.science/paper/L5PGQMUO
@misc{pith2026250609832,
  author       = {Pith},
  title        = {Pith review of: A Deep Generative Model for the Simulation of Discrete Karst Networks},
  year         = {2026},
  howpublished = {\url{https://pith.science/paper/L5PGQMUO}},
  note         = {Machine review of arXiv:2506.09832}
}
read the original abstract
The simulation of discrete karst networks presents a significant challenge due to the complexity of the physicochemical processes occurring within various geological and hydrogeological contexts over extended periods. This complex interplay leads to a wide variety of karst network patterns, each intricately linked to specific hydrogeological conditions. We explore a novel approach that represents karst networks as graphs and applies graph generative models (deep learning techniques) to capture the intricate nature of karst environments. In this representation, nodes retain spatial information and properties, while edges signify connections between nodes. Our generative process consists of two main steps. First, we utilize graph recurrent neural networks (GraphRNN) to learn the topological distribution of karst networks. GraphRNN decomposes the graph simulation into a sequential generation of nodes and edges, informed by previously generated structures. Second, we employ denoising diffusion probabilistic models on graphs (G-DDPM) to learn node features (spatial coordinates and other properties). G-DDPMs enable the generation of nodes features on the graphs produced by the GraphRNN that adhere to the learned statistical properties by sampling from the derived probability distribution, ensuring that the generated graphs are realistic and capture the essential features of the original data. We test our approach using real-world karst networks and compare generated subgraphs with actual subgraphs from the database, by using geometry and topology metrics. Our methodology allows stochastic simulation of discrete karst networks across various types of formations, a useful tool for studying the behavior of physical processes such as flow and transport.
Figures


Figures from the paper (12 more)





Reference graph
Works this paper leans on
-
[1]
Borghi2012 APACrefauthors Borghi, A. , Renard, P. \ Jenni, S. APACrefauthors \ 2012 . A pseudo-genetic stochastic model to generate karstic networks A pseudo-genetic stochastic model to generate karstic networks . Journal of Hydrology 414–415 516--529 . APACrefDOI doi:10.1016/j.jhydrol.2011.11.032 APACrefDOI
-
[2]
cassou2007 APACrefauthors Cassou, J P. \ Bigot, J Y. APACrefauthors \ 2007 . Le labyrinthe de la grotte de Sakany (Qui \'e , Ari \`e ge) Le labyrinthe de la grotte de sakany (qui \'e , ari \`e ge) . Actes de la 17e Rencontre d'Octobre - Orgnac 2007 17 29--36
work page 2007
-
[3]
Chiles2012 APACrefauthors Chilès, J. \ Delfiner, P. APACrefauthors \ 2012 . Geostatistics: Modeling spatial uncertainty Geostatistics: Modeling spatial uncertainty . Wiley . APACrefDOI doi:10.1002/9781118136188 APACrefDOI
-
[4]
Cho2014 APACrefauthors Cho, K. , van Merrienboer, B. , Gulcehre, C. , Bahdanau, D. , Bougares, F. , Schwenk, H. \ Bengio, Y. APACrefauthors \ 2014 . Learning phrase representations using RNN encoder-decoder for statistical machine translation. Learning phrase representations using RNN encoder-decoder for statistical machine translation. arXiv . APACrefDOI...
-
[5]
Coke2019 APACrefauthors Coke, J G. APACrefauthors \ 2019 . Underwater Caves of the Yucatan Peninsula Underwater caves of the yucatan peninsula . Encyclopedia of Caves Encyclopedia of caves \ ( 1089–1095). Elsevier . APACrefURL http://dx.doi.org/10.1016/b978-0-12-814124-3.00127-8 APACrefURL APACrefDOI doi:10.1016/b978-0-12-814124-3.00127-8 APACrefDOI
-
[6]
Collon2017 APACrefauthors Collon, P. , Bernasconi, D. , Vuilleumier, C. \ Renard, P. APACrefauthors \ 2017 . Statistical metrics for the characterization of karst network geometry and topology Statistical metrics for the characterization of karst network geometry and topology . Geomorphology 283 122--142 . APACrefDOI doi:10.1016/j.geomorph.2017.01.034 APACrefDOI
-
[7]
Fandel2021 APACrefauthors Fandel, C. , Ferré, T. , Chen, Z. , Renard, P. \ Goldscheider, N. APACrefauthors \ 2021 . A model ensemble generator to explore structural uncertainty in karst systems with unmapped conduits A model ensemble generator to explore structural uncertainty in karst systems with unmapped conduits . Hydrogeology Journal 29 1 229--248 . ...
-
[8]
Fandel2022 APACrefauthors Fandel, C. , Miville, F. , Ferré, T. , Goldscheider, N. \ Renard, P. APACrefauthors \ 2022 . The stochastic simulation of karst conduit network structure using anisotropic fast marching, and its application to a geologically complex alpine karst system The stochastic simulation of karst conduit network structure using anisotropic...
work page 2022
Show all 30 references
-
[9]
, Jeannin, P Y
Filipponi2009 APACrefauthors Filipponi, M. , Jeannin, P Y. \ Tacher, L. APACrefauthors \ 2009 . Evidence of inception horizons in karst conduit networks Evidence of inception horizons in karst conduit networks . Geomorphology 106 1–2 86--99 . APACrefDOI doi:10.1016/j.geomorph....
2009 doi
-
[10]
APACrefauthors \ 1978
freeman1978 APACrefauthors Freeman, L C. APACrefauthors \ 1978 . Centrality in social networks conceptual clarification Centrality in social networks conceptual clarification . Social Networks 1 3 215-239 . APACrefDOI doi:10.1016/0378-8733(78)90021-7 APACrefDOI
1978 doi
-
[11]
, Miller, J
Goodman1991 APACrefauthors Goodman, R. , Miller, J. \ Smyth, P. APACrefauthors \ 1991 . Objective Functions For Neural Network Classifier Design Objective functions for neural network classifier design . Proceedings. 1991 IEEE International Symposium on Information Theory Proc...
1991
-
[12]
, Collon, P
Gouy2024 APACrefauthors Gouy, A. , Collon, P. , Bailly-Comte, V. , Galin, E. , Antoine, C. , Thebault, B. \ Landrein, P. APACrefauthors \ 2024 . Karst NS im: A graph-based method for 3 D geologically-driven simulation of karst networks Karst NS im: A graph-based method for 3 D...
2024
-
[13]
APACrefauthors \ 2024
groupe_de_recherches_et_dactivites_speleologiques_de_lourdes_base_2024 APACrefauthors Groupe de Recherches et d'Activités Spéléologiques de Lourdes . APACrefauthors \ 2024 . Base de données topographiques de la grotte Sakany . Base de données topographiques de la grotte Sakany...
2024
- [14]
-
[15]
, Satorras, V G
Hoogeboom2022 APACrefauthors Hoogeboom, E. , Satorras, V G. , Vignac, C. \ Welling, M. APACrefauthors \ 2022 . Equivariant Diffusion for Molecule Generation in 3D. Equivariant diffusion for molecule generation in 3d. arXiv . APACrefDOI doi:10.48550/ARXIV.2203.17003 APACrefDOI
-
[16]
, St\" a rk, H
Igashov2024 APACrefauthors Igashov, I. , St\" a rk, H. , Vignac, C. , Schneuing, A. , Satorras, V G. , Frossard, P. Correia, B. APACrefauthors \ 2024 . Equivariant 3D-conditional diffusion model for molecular linker design Equivariant 3d-conditional diffusion model for molecul...
2024 doi
-
[17]
, Siegel, P
Jaquet2004 APACrefauthors Jaquet, O. , Siegel, P. , Klubertanz, G. \ Benabderrhamane, H. APACrefauthors \ 2004 . Stochastic discrete model of karstic networks Stochastic discrete model of karstic networks . Advances in Water Resources 27 7 751--760 . APACrefDOI doi:10.1016/j.a...
2004 doi
-
[18]
Liao2019 APACrefauthors Liao, R. , Li, Y. , Song, Y. , Wang, S. , Hamilton, W., L. , Duvenaud, D. Zemel, R. APACrefauthors \ 2019 . Efficient graph generation with graph recurrent attention networks Efficient graph generation with graph recurrent attention networks . Proceedin...
2019
-
[19]
, Qamar, M
Zhang2023 APACrefauthors Mengchun, Z. , Qamar, M. , Taegoo, K. , Jung, Y. , Chenshuang, Z. , Bae, S H. \ Chaoning, Z. APACrefauthors \ 2023 . A survey on graph diffusion models: Generative AI in science for molecule, protein and material. A survey on graph diffusion models: Ge...
2023
-
[20]
, Renard, P
Miville2025 APACrefauthors Miville, F. , Renard, P. , Fandel, C. \ Filipponi, M. APACrefauthors \ 2025 . pyKasso: An open-source three-dimensional discrete karst network generator pykasso: An open-source three-dimensional discrete karst network generator . Environmental Modell...
2025
-
[21]
APACrefauthors \ 1991
Palmer1991 APACrefauthors Palmer, A N. APACrefauthors \ 1991 . Origin and morphology of limestone caves Origin and morphology of limestone caves . Geological Society of America Bulletin 103 1 1--21 . APACrefDOI doi:10.1130/0016-7606(1991)103<0001:oamolc>2.3.co;2 APACrefDOI
1991 doi
-
[22]
, Durán-Valsero, J J
PardoIguzquiza2011 APACrefauthors Pardo-Iguzquiza, E. , Durán-Valsero, J J. \ Rodríguez-Galiano, V. APACrefauthors \ 2011 . Morphometric analysis of three-dimensional networks of karst conduits Morphometric analysis of three-dimensional networks of karst conduits . Geomorpholo...
2011 doi
-
[23]
APACrefauthors \ 2024
qrss_quintana_roo_speleological_survey_ox_2024 APACrefauthors QRSS (Quintana Roo Speleological Survey) , GEO (Grupo de Exploración Ox Bel Ha) , MCEP (Mexico Cave Exploration Project) \ CINDAQ (El Centro Investigador del Sistema Acuífero de Quintana Roo) . APACrefauthors \ 2024...
2024
-
[24]
, van der Sluijs, J P
Refsgaard2006 APACrefauthors Refsgaard, J C. , van der Sluijs, J P. , Brown, J. \ van der Keur, P. APACrefauthors \ 2006 . A framework for dealing with uncertainty due to model structure error A framework for dealing with uncertainty due to model structure error . Advances in ...
2006 doi
-
[25]
, Fischer, P
Ronneberger2015 APACrefauthors Ronneberger, O. , Fischer, P. \ Brox, T. APACrefauthors \ 2015 . U-Net: Convolutional Networks for Biomedical Image Segmentation. U-net: Convolutional networks for biomedical image segmentation. arXiv . APACrefURL https://arxiv.org/abs/1505.04597...
-
[26]
\ Komodakis, N
Simonovsky2018 APACrefauthors Simonovsky, M. \ Komodakis, N. APACrefauthors \ 2018 . GraphVAE : Towards generation of small graphs using variational autoencoders GraphVAE : Towards generation of small graphs using variational autoencoders . Artificial Neural Networks and Machi...
2018 doi
- [27]
-
[28]
, Krawczuk, I
Vignac2022 APACrefauthors Vignac, C. , Krawczuk, I. , Siraudin, A. , Wang, B. , Cevher, V. \ Frossard, P. APACrefauthors \ 2022 . Di G ress: Discrete denoising diffusion for graph generation. Di G ress: Discrete denoising diffusion for graph generation. arXiv . APACrefDOI doi:...
-
[29]
, Ying, R
You2018 APACrefauthors You, J. , Ying, R. , Ren, X. , Hamilton, W L. \ Leskovec, J. APACrefauthors \ 2018 . Graph RNN : G enerating realistic graphs with deep auto-regressive models. Graph RNN : G enerating realistic graphs with deep auto-regressive models. arXiv . APACrefDOI ...
- [30]
Reviewed August 7, 2026 · model on record in the stance chip above.
Discussion (0). Sign in to comment.