REVIEW 3 major objections 6 minor 1 cited by
The Success of Optical Variability in Uncovering AGNs in Low-stellar Mass Galaxies
T0 review · 3 major / 6 minor · reviewed 2026-08-11 · deepseek-v4-flash
Pith's one-line read Applying random forest classifiers to optical light curves confirms 87% of low-mass galaxy AGN candidates, showing variability is a reliable route to black holes in dwarf galaxies.
desk verdict A high-purity variability-selected AGN sample in low-mass galaxies, but the 87% confirmation rate needs an explicit hold-out statement before it becomes fully convincing. read the letter →
The pith
A machine-rendered reading of the paper's core claim, the machinery that carries it, and where it could break.
The reading
What carries the argument
The mechanism that carries the argument is a set of hierarchical random forest classifiers that turn multi-epoch ZTF photometry into AGN classes: the alert-stream classifier, the ZTF data-release classifiers in g and r, and a forced-photometry classifier run on difference images. Their job is to separate AGN variability from ordinary stellar variability, transients, and artifacts using features such as damped random walk timescales, excess variance, colors, Gaia proper motion, and morphology. These classifiers select the 506 candidates; the confirmation step then uses pPXF spectral fitting of SDSS spectra with stellar-population templates, Gaussian narrow lines, Gauss-Hermite broad lines, Fe II pseudo-continuum, and power-law AGN continua to measure broad Balmer lines, black hole masses, and narrow-line ratios.
What would settle it
Compare the object IDs of the 506 candidates against the training sets used to build the random forest classifiers; if a substantial fraction of the 357 confirmed AGNs appear there, the 87% confirmation rate is not an independent validation, and a cleaner test would be to retrain on labels that explicitly exclude all 506 candidates and remeasure the broad-line confirmation rate on the held-out set.
Extended reading notes
Core claim
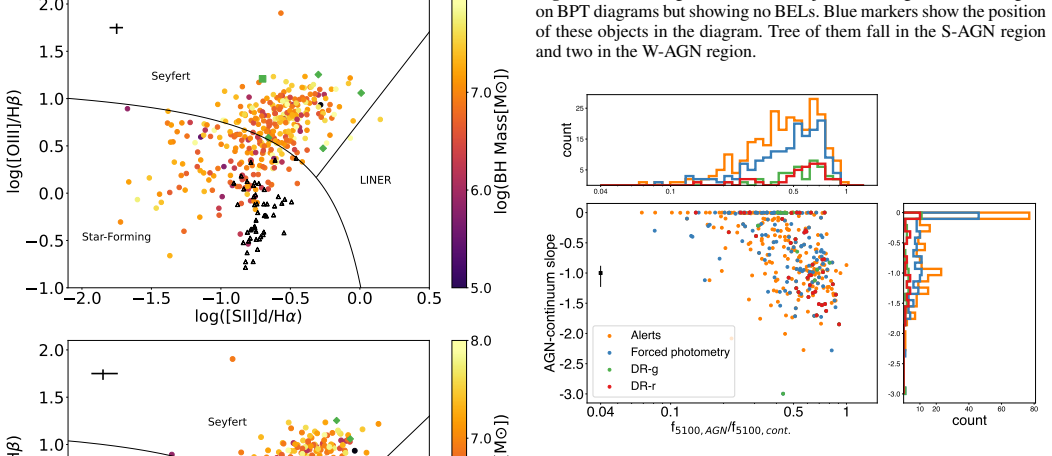
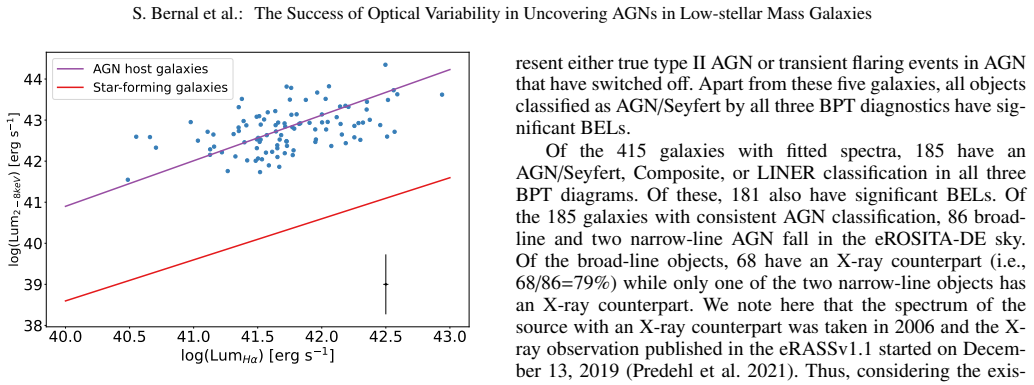
The paper's central claim is that random-forest classifiers applied to multi-epoch optical light curves select genuine type I AGNs in low-stellar-mass galaxies with high purity. Starting from 506 variability-selected candidates matched to NASA-Sloan Atlas galaxies with $M_*<2\times10^{10}\,M_\odot$ and $z<0.15$, the authors obtain 415 clean low-redshift spectra and confirm 362 (87%) as AGNs: 357 through significant broad Balmer lines (EW$_{\mathrm{H}\alpha}>5$ Å and SNR>3) and five more through BPT/WHAN narrow-line diagnostics. Candidates chosen from complete light curves, namely the ZTF data-release g and r sets and a custom forced-photometry set on difference images, are confirmed at 94–98%, while the alert-based set is 80% and contains essentially all the false positives, mostly bad image subtraction and nuclear transients. The inferred black hole masses span $2.2\times10^6$ to $4.2\times10^7\,M_\odot$, and the host-to-black-hole mass ratio clusters near $M_*/M_{\mathrm{BH}}\sim1000$, above the Reines & Volonteri relation but near the 0.1% ratio seen in more massive ellipticals. Among candidates in the eROSITA-DE footprint, 67% have X-ray counterparts, rising to 75% for those with broad lines, and this X-ray match rate does not depend on BPT class.
Load-bearing premise
The classifiers that pick the candidates were trained on previously labeled variable sources, and the paper does not show that the 506 candidates were excluded from that training; if they were not, the high confirmation rate partly reflects how well the classifier repeats its own training labels rather than an independent test of variability selection.
Editorial extensions
If this is right
- Variability selection can be used to build a census of low-mass black holes in nearby galaxies, adding hundreds of objects to the small set of spectroscopically confirmed AGNs in dwarfs.
- BPT-only searches miss a large fraction of type I AGNs: over half of the candidates classified as star-forming by narrow-line ratios still show broad Balmer lines.
- Selection from complete, difference-image-based light curves is both purer and more sensitive to the lowest black hole masses than alert-based selection.
- X-ray follow-up is most productive for candidates with broad lines: the fraction with eROSITA counterparts is 75% for broad-line objects and only 4% for those without.
- Because variability selection preferentially finds the largest black holes for a given host mass, the low-mass end of the scaling relation remains incomplete until deeper, higher-cadence surveys such as LSST supply more sensitive light curves.
Reading between the lines
- Editorial extension: verify whether the 506 candidates were excluded from the random forest training labels; without that exclusion, part of the 87% rate measures label reproduction rather than independent generalization.
- Editorial extension: apply the forced-photometry classifier to the full NSA galaxy catalog, not just the mass-limited sample, to map how purity and mass bias vary with host mass.
- Editorial extension: stack eROSITA images at the 33% of candidates without catalog counterparts to separate genuinely X-ray-faint AGNs from objects below the detection limit.
- Editorial extension: high-spatial-resolution spectroscopy of the star-forming-classified broad-line objects would test whether their narrow lines are diluted by host galaxy emission, as the paper suggests.
Signed reviews
Editorial analysis
A structured set of objections, weighed in public.
Referee Report
Summary. The paper reports on the use of random-forest classifiers applied to ZTF light curves to select AGN candidates in low-stellar-mass galaxies from the NASA-Sloan Atlas, using four different input data products: the ALeRCE alert stream, ZTF DR11 g-band and r-band light curves, and custom forced photometry. The 506 matched candidates are cross-checked against SDSS DR17 spectra; 415 pass the author's visual and redshift-quality cuts, and from these 362 (87%) are confirmed as AGNs, mainly through broad Balmer lines (357 objects) plus five additional BPT/WHAN-selected objects. The paper also derives black hole masses and Eddington ratios from spectral fits, compares BPT classifications with external catalogs, and reports X-ray counterpart fractions from eRASSv1.1 (67% of the VCS sample in the eROSITA-DE sky, rising to 75% for objects with broad lines). The central claim is that variability-based classification, especially when based on complete light curves, is a highly pure method for finding AGNs in low-mass galaxies.
Significance. If the reported purity holds, this is a valuable result for AGN censuses in low-mass galaxies and for planning IMBH searches with future facilities such as LSST. The paper's strengths include a careful spectral-fitting approach with Monte Carlo error estimation, visual inspection of borderline objects and light curves, comparison with MPA-JHU and Portsmouth emission-line catalogs, and an independent X-ray validation using eROSITA. The eROSITA match rates are particularly useful as an external check that does not depend on the optical classifiers. However, the main quantitative claim—the 87% confirmation rate—depends on the classifiers' training labels, and the paper does not establish that the candidates were held out from training. This must be addressed before the selection purity can be accepted as demonstrated.
major comments (3)
- [Section 2 and Sections 3-4] The manuscript adopts the random-forest classifiers of Sánchez-Sáez et al. (2021a), Sánchez-Sáez et al. (2023), and Arévalo et al. (in prep.) but never states that the 506 NSA-matched candidates (or the 415 VCS objects) were excluded from those classifiers' training labels. If the training sets include spectroscopically confirmed SDSS AGN, as is standard practice for such classifiers, then the 86% broad-line fraction in Section 4.1 and the per-set 94-98% fractions partly measure how well the classifier recalls its own training labels rather than how well optical variability selects new AGNs in low-mass galaxies. Because this confirmation rate is the paper's central quantitative claim, please (a) report whether any of the 506 candidates appear in the training sets, (b) recompute the confirmation fractions after removing any overlapping objects, or (c) clearly justify that the classifiers' labels were obtained without using SDSS spectroscopy of these candidates. The eROSITA match rate in Section 5 is an important independent check, but it does not by itself validate the spectroscopically defined purity numbers.
- [Section 3.1, Table 2, Section 4.1] The headline '87% confirmed' is computed only for the 415-object VCS sample after excluding 35 spectra that include 22 higher-redshift AGN and 5 suspected AGN, and the 52 candidates without spectra are not in the denominator. The paper is transparent about the 65 unconfirmed objects, but it should also state the unconditional confirmation rate among all 506 candidates (at least 362/506 = 71.5%, rising to about 77% if the 22 higher-z and 5 suspected AGN are counted) and discuss how the exclusion of the lowest-mass, lowest-redshift candidates without spectra (Section 3.2) affects the reported confirmation and mass statistics. This would prevent the abstract's conditional rate from being read as the overall selection success rate.
- [Section 2 (Forced Photometry)] The Forced Photometry selection, which produces the paper's highest confirmation rate (168/170 in the VCS sample), relies on a classifier and feature definitions described only as in Arévalo et al. (in prep.), with no public code, training-label description, or hyperparameters. The additional features (PAN-STARRS i-z color, Gaia proper motion, Mexican-Hat variances, flux asymmetry) are listed, but the labeled training set and classifier construction are not available for inspection. Because this set is central to the comparison in Section 4.1 and to the conclusion that forced photometry finds twice as many AGNs in the same sky region, please include the method details or a public reference that the reader can inspect; otherwise the main result for the most sensitive set is not reproducible.
minor comments (6)
- [Section 2] There is a typo: 'Whit this reduction' should be 'With this reduction'; also, Sánchez-Sáez et al. 2021a and 2021b appear to be the same paper and should be merged in the reference list.
- [Conclusion, item 4] The text 'below 1.8×16M⊙' appears to be a typo for '1.8×10^6 M⊙'; similarly, '6.4−6.4×10^6 M⊙' should likely be '6.4×10^6 M⊙' for both DR-g and DR-r.
- [Table 2 and Section 4.1] The per-set confirmation percentages are computed only for objects with good spectra; adding the total candidate counts per set (e.g., 168/188 for Forced Photometry, 40/54 for DR-g, 40/54 for DR-r) would make the selection purity less dependent on SDSS spectral availability.
- [Section 5 and Table 8] The text gives both 5 arcsec and 10 arcsec match rates (123 and 150 objects) and later uses 10 arcsec in Table 8; please state explicitly in the table caption that the quoted percentages use a 10 arcsec matching radius.
- [Figure 9] The green diamonds and the green square are described in the text, but the markers may be difficult to distinguish in printed grayscale; consider using distinct shapes or a colorblind-safe palette.
- [Appendix D] The sentence 'The dashed grey line correspond to zero Flux' should be 'The dashed grey line corresponds to zero flux.'
Circularity Check
No demonstrated circularity: the confirmation rates are measured against external SDSS spectra and eROSITA X-ray data, not derived from the classifiers' inputs by construction.
full rationale
No step in the paper's derivation chain equates an output to an input by construction. The central quantitative claims are measured confirmation rates of a variability-selected sample against archival SDSS spectra and eROSITA X-ray catalogs, both external to the variability features used by the classifiers. The classifiers are adopted from prior work (Sanchez-Saez et al. 2021a, 2023; Arevalo et al. in prep.), and the paper does not state whether the 506 candidates were excluded from training; if they were not, the spectroscopic confirmation rate could partly reflect training-label reproduction. This is a legitimate reproducibility or data-leakage concern, but the manuscript provides no quote or equation demonstrating that any candidate was in the training set, so under the hard rules it cannot be scored as demonstrated circularity. The eROSITA match rate (67% of VCS candidates; 75% of BEL objects) provides an independent benchmark not derived from classifier inputs. The filtering of DR samples to improve purity and the subsequent reporting of purity on the filtered sample is a characterization of the resulting selection, not a fitted parameter renamed as a prediction. Citations to the authors' own classifiers are methodological, not load-bearing validation of the confirmation claim. Therefore the analysis is self-contained against external spectroscopic and X-ray benchmarks, and no significant circularity is found.
Assumptions & free parameters
free parameters (4)
- DR-g and DR-r filter thresholds =
pred_init_class_prob >= 0.9; abs(gal_b) >= 20; pmsig <= 3; PM < 3; IAR_phi >= 0.8; GP_DRW_sigma >= 0.0001; GP_DRW_tau…
- Broad-line detection thresholds =
EW_Halpha > 5 A and SNR > 3
- X-ray matching radius =
5 and 10 arcsec
- Forced photometry aperture and quality cuts =
4 arcsec aperture; infobits = 0; maglimit > 20; seeing < 4 arcsec; at most one observation per night
assumptions (5)
- domain assumption The single-epoch virial mass estimator (Mejía-Restrepo et al. 2016, Eq. 1) is valid for the low-mass AGNs in this sample.
- domain assumption The random forest classifiers were trained on reliable, representative labeled datasets.
- domain assumption NSA SERSIC-MASS estimates are accurate for low-mass galaxies.
- domain assumption The BPT and WHAN diagnostics correctly separate AGN from star-forming ionization in low-mass galaxies.
- domain assumption The eRASSv1.1 X-ray catalog is sufficiently complete and correctly astrometrized for the matching analysis.
Cite this review
Pith. "Pith review of The Success of Optical Variability in Uncovering AGNs in Low-stellar Mass Galaxies." pith.science (2026). https://pith.science/paper/LLRM46V6
@misc{pith2026241214298,
  author       = {Pith},
  title        = {Pith review of: The Success of Optical Variability in Uncovering AGNs in Low-stellar Mass Galaxies},
  year         = {2026},
  howpublished = {\url{https://pith.science/paper/LLRM46V6}},
  note         = {Machine review of arXiv:2412.14298}
}
abstract
We used random forest algorithms to classify all objects in a large portion of the sky, using optical light curves obtained, or built from images provided, by the Zwicky Transient Facility (ZTF). We compare different selection sets based on alerts or complete light curves derived from different photometric selection algorithms. The AGN candidates thus selected are cross-matched with objects in the NASA-Sloan Atlas (NSA) of local galaxies, with $M_*<2\times10^{10}M_\odot$. The AGN nature of these candidates is verified and characterized using archival optical spectra from SDSS. We further establish the fraction of candidates with counterparts in the eROSITA data release 1 catalog of X-ray sources. From an initial sample of 506 candidates, 415 have good-quality spectra. Among these 415 objects, we found significant broad Balmer lines in the spectra for $86\%$ (357) of the candidates. When considering BPT classifications, an additional 5 candidates were confirmed, resulting in $87\%$ (362) confirmed candidates. Specifically, broad Balmer lines were detected in $94\%$-$98\%$ of the AGN candidates selected from complete light curves and in $80\%$ of those selected from the less frequent ZTF alerts. The black hole masses estimated from the spectra range from $2.2\times10^6M_\odot$ to $4.2\times10^7M_\odot$, reaching lower values for the candidates selected using the more sensitive light curves. The black hole masses obtained cluster around $0.1\%$ of the stellar mass of the host from the NSA catalog. Two-thirds of the AGN candidates are classified as Seyfert or Composite by their narrow emission line ratios (BPT diagnostics) while the rest are star-forming. Almost all the candidates classified as Seyfert and over $50\%$ of those classified as star-forming have significant BELs. We found X-ray counterparts for $67\%$ of the candidates that fall in the footprint of the eROSITA-DE DR1.
Figures


Figures from the paper (13 more)





Forward citations
Cited by 1 Pith paper
-
AGN radiative feedback as the main regulator of [O III] outflow activity and obscuration in X-ray AGN
Higher Eddington ratio AGN exhibit increased [O III] outflow incidence and reduced obscuration, supporting radiative feedback as the regulator.
Reference graph
Works this paper leans on
-
[1]
2022, ApJS, 259, 35
Abdurro’uf, Accetta, K., Aerts, C., et al. 2022, ApJS, 259, 35
2022
-
[2]
Alexander, D. M. & Hickox, R. C. 2012, New A Rev., 56, 93
2012
-
[3]
Arcodia, R., Merloni, A., Comparat, J., et al. 2024, A&A, 681, A97
work page 2024
-
[4]
F., Geha, M., & Greene, J
Baldassare, V . F., Geha, M., & Greene, J. 2018, ApJ, 868, 152
2018
-
[5]
Baldassare, V . F., Geha, M., & Greene, J. 2020, ApJ, 896, 10
work page 2020
-
[6]
A., Phillips, M
Baldwin, J. A., Phillips, M. M., & Terlevich, R. 1981, Publications of the Astro- nomical Society of the Pacific, 93, 5
1981
-
[7]
A., Phillips, M
Baldwin, J. A., Phillips, M. M., & Terlevich, R. 1981, PASP, 93, 5
1981
-
[8]
E., Lira, P., Anguita, T., et al
Bauer, F. E., Lira, P., Anguita, T., et al. 2023, The Messenger, 190, 34
2023
Show all 50 references
-
[9]
C., Kulkarni, S
Bellm, E. C., Kulkarni, S. R., Graham, M. J., et al. 2019, PASP, 131, 018002
2019
-
[10]
L., Watson, M
Birchall, K. L., Watson, M. G., & Aird, J. 2020, MNRAS, 492, 2268
2020
-
[11]
S., Schlegel, D
Bolton, A. S., Schlegel, D. J., Aubourg, É., et al. 2012, AJ, 144, 144
2012
-
[12]
Brinchmann, J., Charlot, S., White, S. D. M., et al. 2004, MNRAS, 351, 1151
2004
-
[13]
2024, arXiv e-prints, arXiv:2405.19297
Buchner, J., Starck, H., Salvato, M., et al. 2024, arXiv e-prints, arXiv:2405.19297
2024
-
[14]
J., Liu, X., Shen, Y ., et al
Burke, C. J., Liu, X., Shen, Y ., et al. 2022, MNRAS, 516, 2736
2022
-
[15]
M., Satyapal, S., Abel, N
Cann, J. M., Satyapal, S., Abel, N. P., et al. 2019, ApJ, 870, L2
2019
-
[16]
2017, MNRAS, 466, 798
Cappellari, M. 2017, MNRAS, 466, 798
2017
-
[17]
& Emsellem, E
Cappellari, M. & Emsellem, E. 2004, PASP, 116, 138 Cid Fernandes, R., Stasi ´nska, G., Mateus, A., & Vale Asari, N. 2011, MNRAS, 413, 1687 de Jong, R. S., Bellido-Tirado, O., Brynnel, J. G., et al. 2022, in Society of Photo- Optical Instrumentation Engineers (SPIE) Conference ...
2004
-
[18]
E., Chelouche, D., Kaspi, S., & Behar, E
Edri, H., Rafter, S. E., Chelouche, D., Kaspi, S., & Behar, E. 2012, ApJ, 756, 73 Förster, F., Cabrera-Vives, G., Castillo-Navarrete, E., et al. 2021, AJ, 161, 242
2012
-
[19]
& Spyromilio, J
Gilmozzi, R. & Spyromilio, J. 2007, The Messenger, 127, 11
2007
-
[20]
Greene, J. E. 2012, Nature Communications, 3, 1304
2012
-
[21]
C., Feigelson, E
Ho, L. C., Feigelson, E. D., Townsley, L. K., et al. 2001, ApJ, 549, L51
2001
-
[22]
E., Hainline, K
Hviding, R. E., Hainline, K. N., Goulding, A. D., & Greene, J. E. 2024, AJ, 167, 169
2024
-
[23]
2020, ARA&A, 58, 27 Ivezi´c, Ž., Kahn, S
Inayoshi, K., Visbal, E., & Haiman, Z. 2020, ARA&A, 58, 27 Ivezi´c, Ž., Kahn, S. M., Tyson, J. A., et al. 2019, ApJ, 873, 111
2020
-
[24]
J., Dopita, M
Kewley, L. J., Dopita, M. A., Sutherland, R. S., Heisler, C. A., & Trevena, J. 2001, ApJ, 556, 121
2001
-
[25]
J., Groves, B., Kauffmann, G., & Heckman, T
Kewley, L. J., Groves, B., Kauffmann, G., & Heckman, T. 2006, MNRAS, 372, 961
2006
-
[26]
2020, ApJ, 894, 24
Kimura, Y ., Yamada, T., Kokubo, M., et al. 2020, ApJ, 894, 24
2020
-
[27]
Kormendy, J. & Ho, L. C. 2013, ARA&A, 51, 511
2013
-
[28]
Latif, M. A. & Ferrara, A. 2016, PASA, 33, e051 López-Navas, E., Martínez-Aldama, M. L., Bernal, S., et al. 2022, MNRAS, 513, L57 López-Navas, E., Sánchez-Sáez, P., Arévalo, P., et al. 2023, MNRAS, 524, 188
2016
-
[29]
W., Higley, A
Lyke, B. W., Higley, A. N., McLane, J. N., et al. 2020, ApJS, 250, 8
2020
-
[30]
L., Ivezi´c, Ž., Kochanek, C
MacLeod, C. L., Ivezi´c, Ž., Kochanek, C. S., et al. 2010, ApJ, 721, 1014 Martínez-Palomera, J., Lira, P., Bhalla-Ladd, I., Förster, F., & Plotkin, R. M. 2020, ApJ, 889, 113
2010
-
[31]
J., Laher, R
Masci, F. J., Laher, R. R., Rusholme, B., et al. 2023, arXiv e-prints, arXiv:2305.16279
2023 arXiv
-
[32]
J., Laher, R
Masci, F. J., Laher, R. R., Rusholme, B., et al. 2019, PASP, 131, 018003 Mejía-Restrepo, J. E., Trakhtenbrot, B., Lira, P., Netzer, H., & Capellupo, D. M. 2016, MNRAS, 460, 187
2019
-
[33]
2024, A&A, 682, A34
Merloni, A., Lamer, G., Liu, T., et al. 2024, A&A, 682, A34
2024
-
[34]
2017, International Journal of Modern Physics D, 26, 1730021
Mezcua, M. 2017, International Journal of Modern Physics D, 26, 1730021
2017
-
[35]
& Domínguez Sánchez, H
Mezcua, M. & Domínguez Sánchez, H. 2020, ApJ, 898, L30
2020
-
[36]
& Domínguez Sánchez, H
Mezcua, M. & Domínguez Sánchez, H. 2024, MNRAS, 528, 5252
2024
-
[37]
C., Shahinyan, K., Sugarman, H
Moran, E. C., Shahinyan, K., Sugarman, H. R., Vélez, D. O., & Eracleous, M. 2014, AJ, 148, 136
2014
-
[38]
2006, A&A, 455, 173
Panessa, F., Bassani, L., Cappi, M., et al. 2006, A&A, 455, 173
2006
-
[39]
A., Nandra, K., Fink, H
Pounds, K. A., Nandra, K., Fink, H. H., & Makino, F. 1994, MNRAS, 267, 193
1994
-
[40]
2021, A&A, 647, A1
Predehl, P., Andritschke, R., Arefiev, V ., et al. 2021, A&A, 647, A1
2021
-
[41]
E., Greene, J
Reines, A. E., Greene, J. E., & Geha, M. 2013, ApJ, 775, 116
2013
-
[42]
Reines, A. E. & V olonteri, M. 2015, ApJ, 813, 82 Rosa González, D., Terlevich, E., Jiménez Bailón, E., et al. 2009, MNRAS, 399, 487 Sánchez-Sáez, P., Arredondo, J., Bayo, A., et al. 2023, A&A, 675, A195 Sánchez-Sáez, P., Lira, P., Cartier, R., et al. 2019, ApJS, 242, 10 Sánch...
2015
-
[43]
2007, MNRAS, 382, 1415
Schawinski, K., Thomas, D., Sarzi, M., et al. 2007, MNRAS, 382, 1415
2007
-
[44]
E., Strauss, M
Shen, Y ., Greene, J. E., Strauss, M. A., Richards, G. T., & Schneider, D. P. 2008, ApJ, 680, 169
2008
-
[45]
H., Smith, P., et al
Shi, Y ., Rieke, G. H., Smith, P., et al. 2010, ApJ, 714, 115
2010
-
[46]
& Miller, A
Tachibana, Y . & Miller, A. A. 2018, PASP, 130, 128001
2018
-
[47]
2013, MNRAS, 431, 1383
Thomas, D., Steele, O., Maraston, C., et al. 2013, MNRAS, 431, 1383
2013
-
[48]
A., Heckman, T
Tremonti, C. A., Heckman, T. M., Kauffmann, G., et al. 2004, ApJ, 613, 898
2004
-
[49]
2016, MNRAS, 463, 3409 V olonteri, M
Vazdekis, A., Koleva, M., Ricciardelli, E., Röck, B., & Falcón-Barroso, J. 2016, MNRAS, 463, 3409 V olonteri, M. 2010, A&A Rev., 18, 279
2016
-
[50]
2022, ApJ, 936, 104 Article number, page 19 of 25 A&A proofs: manuscript no
Ward, C., Gezari, S., Nugent, P., et al. 2022, ApJ, 936, 104 Article number, page 19 of 25 A&A proofs: manuscript no. aanda Appendix A: Higher redshift AGN AGN candidates at higher redshift that are included in the NSA low-stellar mass sample because their redshift was incorre...
2020
Reviewed August 11, 2026 · model on record in the stance chip above.
Discussion (0). Continue with ORCID to comment.