REVIEW 3 major objections 6 minor 37 references
Zero-Shot Forecasting Mortality Rates: A Global Study
T0 review · 3 major / 6 minor · reviewed 2026-08-15 · deepseek-v4-flash
Pith's one-line read A Random Forest beat zero-shot AI models at forecasting mortality rates.
desk verdict A broad, honest empirical benchmark of zero-shot foundation models for mortality forecasting, but the acknowledged train/validation overlap and missing code temper its headline claims. read the letter →
The pith
A machine-rendered reading of the paper's core claim, the machinery that carries it, and where it could break.
The reading
What carries the argument
The load-bearing mechanism is the evaluation design itself: a large panel of 50 national and sub-national life tables from the Human Mortality Database, 111 age groups grouped into five age bands, four country-income and four data-length strata, three horizons (5, 10, and 20 years), and SMAPE as a scale-free error metric. Pairwise Wilcoxon signed-rank tests decide whether differences are statistically significant, and a 5-point median difference is required for practical significance. This design is what lets the paper rank thirteen forecasting methods and claim that the differences between zero-shot, fine-tuned, and mortality-trained models are real.
What would settle it
A concrete check is to examine the released training data or documentation of CHRONOS and TimesFM for any series from the Human Mortality Database; if any HMD-derived mortality series appears in the pretraining corpus, the zero-shot claim fails. Independently, rerunning the full benchmark with an earlier validation window, such as forecasting 1980-2000 from data through 1979, would reveal whether the reported ranking is an artifact of testing only on the most recent period.
Extended reading notes
Core claim
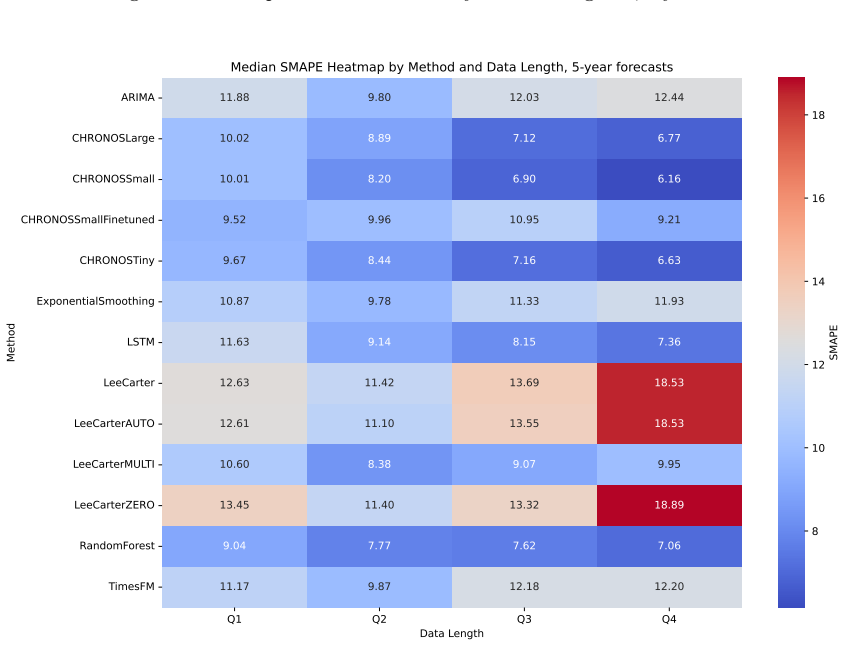
On the paper's own terms, the central discovery is a performance ranking that shifts with horizon. For 5-year forecasts, the zero-shot CHRONOS models (8M to 710M parameters) rank among the best, second only to Random Forest, and far ahead of Lee-Carter and ARIMA; at 20 years, fine-tuned CHRONOS moves to second place, and both zero-shot foundation models fall behind all mortality-trained models. TimesFM never escapes the bottom half. The ranking is established by median symmetric MAPE over 50 Human Mortality Database populations times 111 age groups, with Wilcoxon signed-rank tests and a 5-percentage-point threshold for practical significance.
Load-bearing premise
The conclusion that CHRONOS and TimesFM are truly zero-shot relies on the paper's stated assumption, taken from the models' documentation, that mortality-rate series were not part of their pretraining data; if that is wrong, the zero-shot versus domain-trained comparison is unfair.
Editorial extensions
If this is right
- For short-horizon (5-year) mortality forecasting, zero-shot CHRONOS is a viable off-the-shelf alternative to Lee-Carter and ARIMA.
- Fine-tuning a foundation model on domain data is the key to long-horizon accuracy: fine-tuned CHRONOS gains 5 or more SMAPE points at 20 years over its zero-shot version.
- The best overall mortality forecasts come from a Random Forest trained on lagged mortality rates across all populations, not from any foundation model tested.
- TimesFM's poor performance suggests that not all zero-shot models transfer to low-frequency demographic series, and model choice matters more than the zero-shot label.
- Traditional demographic benchmarks such as Lee-Carter are consistently beaten by machine-learning models, including zero-shot ones at short horizons.
Reading between the lines
- If CHRONOS's pretraining corpus turns out to contain Human Mortality Database series, the 'zero-shot' comparison collapses; the authors' assumption rests only on documentation, so an audit of pretraining data is a cheap, decisive check.
- The paper's validation uses only the most recent 5-, 10-, and 20-year window; re-running the benchmark with a historical holdout (e.g., predicting the 1980s from data up to 1980) would test whether the ranking reflects genuine generalisation or period-specific trends.
- A directly testable extension is to fine-tune TimesFM the same way as CHRONOS: if TimesFM still underperforms, the gap is architectural; if it improves dramatically, the problem was adaptation, not model quality.
- The strong Random Forest baseline suggests that autoregressive tree ensembles on pooled populations should become the default benchmark against which future mortality foundation models are judged.
Signed reviews
Editorial analysis
A structured set of objections, weighed in public.
Referee Report
Summary. The paper evaluates zero-shot time-series foundation models (TimesFM and CHRONOS in three sizes) against benchmark methods (ARIMA, exponential smoothing, LSTM, Random Forest, and Lee-Carter variants) for forecasting age-specific mortality rates from the Human Mortality Database. It uses 50 HMD data files, 111 age groups, horizons of 5, 10, and 20 years, and SMAPE-based evaluation with Wilcoxon signed-rank tests and practical-significance thresholds. The main reported findings are that a Random Forest trained on mortality data performs best overall, CHRONOS is competitive in the short term and outperforms traditional methods, TimesFM underperforms, and fine-tuning CHRONOS on mortality data improves long-term accuracy.
Significance. If the results survive a corrected evaluation, the paper is a useful applied benchmark for zero-shot mortality forecasting. Its strengths include the breadth of the test bed (50 populations, 111 age groups, three horizons), the use of public data and public pretrained models, and the transparent reporting of median SMAPE, Wilcoxon tests, and practical-significance comparisons. The practical takeaway—that a simple lag-based Random Forest is competitive with, and often better than, general zero-shot foundation models for this domain, and that CHRONOS is the stronger of the two tested foundation models—is relevant to actuaries, demographers, and public-health planners. However, the current manuscript does not yet support its headline claims because the mortality-trained models were evaluated under a training/validation split that the authors themselves acknowledge can overlap in time; this directly affects the comparisons that drive the abstract. The reported results are also based on a single validation window per horizon, which limits the generality of the rankings.
major comments (3)
- [6] The acknowledged temporal overlap between the training data of LSTM, RandomForest, and CHRONOSSmallFinetuned and the validation windows is load-bearing for the paper's central claims. Section 6 states that pretraining used "historical data spanning all countries, excluding the last 20 years" and then admits "there may be partial overlap in time between these periods." Under the natural reading that the exclusion is a global cutoff (e.g., all data before 2004, because the most recent data are from 2023), the last 20 years of validation extend into the training interval for countries whose series end before 2023. For example, for Israel (last year 2016; Table 1) the 20-year validation window is 1997-2016 and training includes 1983-2003, so 7 validation years were seen in training; for Russia (last year 2014) the overlap is 9 years; for Ukraine (last year 2013) it is 10 years; and for NZL_MA (last year 2008) it is 15 years. These are exactly the short-history countries in the Q1 category where Figure 12 shows RandomForest and fine-tuned CHRONOS with their largest advantages at the 20-year horizon. Calling the leakage "a small degree" is therefore inaccurate for these populations, and Tables 6-7 plus the abstract's claims that "A Random Forest model... achieved the best overall performance" and "Fine-tuning CHRONOS... significantly improved long-term accuracy" are directly affected. The authors should state the exact cutoff, quantify the overlap for every country, and re-run the mortality-trained models under a split that guarantees no temporal overlap, or report the sensitivity of the rankings to an overlap-free split.
- [8.4] The single validation window is another load-bearing limitation for the comparative claims. Section 8.4 admits that "in each case only the last available period was used for validation" and that different results might have been obtained for earlier periods. The headline rankings in Tables 2, 4, and 6 are therefore based on exactly one realization of history for each horizon. Given well-documented structural breaks in mortality (pandemics, changes in data collection, geopolitical events), the relative ordering of models, especially at the 20-year horizon, may be period-specific. The authors should either add rolling-origin or multiple-window validation or explicitly restrict the conclusions to "the most recent period" rather than general claims about model performance. At minimum, the abstract and conclusions should be softened to reflect this conditional scope.
- [3] The "zero-shot" characterization rests on an unverified assumption. Section 3 says "According to the documentations, mortality rate series were not used during the training" of TimesFM and CHRONOS. The entire comparison between zero-shot and mortality-trained models depends on the pretraining corpora being disjoint from the mortality domain; if mortality or closely related life-table data were present in the pretraining data, the zero-shot framing would be distorted. This is a correctness-risk concern rather than an observed error, but the paper should at least label it as an assumption that is not independently verified. A concrete test, such as checking whether the foundation models' nearest training series resemble mortality series, or a clear statement that contamination cannot be ruled out from public documentation, would make the claim appropriately cautious.
minor comments (6)
- [7.1] The text introducing Tables 2, 4, and 6 refers to "the three methods," but the tables report 13 methods; this should be corrected to "thirteen methods."
- [5] Because the 50 data files include multiple files for France, Germany, the United Kingdom, and New Zealand, the effective number of independent populations is smaller than 50; the paper should note this and discuss its implication for the paired Wilcoxon tests, whose effective sample size is also smaller than 5550 independent series.
- [4] The forecasting mechanics of the LSTM and Random Forest are underspecified for horizons beyond their 16-step or 16-lag windows; the paper should state whether 5-, 10-, and 20-year forecasts are generated recursively and how the initial conditioning is handled.
- [6] The phrase "excluding the last 20 years" is ambiguous: it could mean a per-country cutoff or a global cutoff. The authors should specify the exact split in one sentence, since this ambiguity is directly related to the leakage concern in Major Comment 1.
- [7] Wilcoxon p-values are reported as 0.00; they should be reported as p < 0.001, and the paper should state whether any multiple-comparison correction was applied (the practical-significance threshold mitigates this concern, but the reporting should be explicit).
- [5] There are minor typos, including "decoposition" in Section 4 and "with with" in Section 5; these should be corrected.
Circularity Check
Benchmark study with no derivation chain; the only self-citation is background material and the acknowledged train/validation overlap is a leakage concern, not circularity.
full rationale
This paper is an empirical benchmark comparison, not a derivation. The central claims are about measured SMAPE values for zero-shot foundation models versus mortality-trained baselines, and none of these claims reduce to the models' inputs by construction. The zero-shot models (TimesFM, CHRONOS) are external pretrained models; the paper does not define them in terms of the mortality data. The mortality-trained models (RF, LSTM, CHRONOSSmallFinetuned) are trained on historical mortality series and evaluated on held-out last periods, so their reported errors are not algebraically equal to training targets. The only self-citation is [24], a prior LSTM mortality paper cited in the background survey of deep learning applications; it is not load-bearing for any result. Section 6 does contain an explicit limitation: 'As the training and validation periods differ to some degree for different countries, there may be partial overlap in time between these periods.' This is a genuine data-leakage risk for the mortality-pretrained models and could inflate their long-horizon results, but leakage is an evaluation-validity problem, not circularity: the forecasts are still produced by the models rather than being identical to the fitted inputs. No circular step, self-imported uniqueness theorem, or renamed known result is present. The appropriate finding is no significant circularity.
Assumptions & free parameters
free parameters (3)
- LSTM hidden units and training epochs =
50 units, 100 epochs
- Random Forest tree count and lag length =
100 trees, 16 lags
- Clipping threshold for mortality rates =
1e-6
assumptions (4)
- domain assumption TimesFM and CHRONOS pretraining did not include mortality rate series.
- domain assumption The Human Mortality Database provides consistent, high-quality mortality data across countries.
- domain assumption SMAPE is an appropriate normalized error metric for comparing forecasts across age groups and countries.
- domain assumption The last 5, 10, or 20 years of each country's data form a representative validation window.
Cite this review
Pith. "Pith review of Zero-Shot Forecasting Mortality Rates: A Global Study." pith.science (2026). https://pith.science/paper/LNMR77D7
@misc{pith2026250513521,
  author       = {Pith},
  title        = {Pith review of: Zero-Shot Forecasting Mortality Rates: A Global Study},
  year         = {2026},
  howpublished = {\url{https://pith.science/paper/LNMR77D7}},
  note         = {Machine review of arXiv:2505.13521}
}
read the original abstract
This study explores the potential of zero-shot time series forecasting, an innovative approach leveraging pre-trained foundation models, to forecast mortality rates without task-specific fine-tuning. We evaluate two state-of-the-art foundation models, TimesFM and CHRONOS, alongside traditional and machine learning-based methods across three forecasting horizons (5, 10, and 20 years) using data from 50 countries and 111 age groups. In our investigations, zero-shot models showed varying results: while CHRONOS delivered competitive shorter-term forecasts, outperforming traditional methods like ARIMA and the Lee-Carter model, TimesFM consistently underperformed. Fine-tuning CHRONOS on mortality data significantly improved long-term accuracy. A Random Forest model, trained on mortality data, achieved the best overall performance. These findings underscore the potential of zero-shot forecasting while highlighting the need for careful model selection and domain-specific adaptation.
Figures


Figures from the paper (12 more)


Reference graph
Works this paper leans on
-
[1]
Chronos: Learning the language of time series
Abdul Fatir Ansari et al. “Chronos: Learning the language of time series”. In: arXiv preprint arXiv:2403.07815 (2024)
arXiv 2024
-
[2]
Forecasting Hungarian mortality rates using the Lee-Carter method
Sándor Baran et al. “Forecasting Hungarian mortality rates using the Lee-Carter method”. In:Acta Oeconomica 57.1 (2007), pp. 21–34
work page 2007
-
[3]
Age-time interactions in mortality projection: Applying Lee-Carter to Australia
Heather Booth, JH Maindonald, Len Smith, et al. “Age-time interactions in mortality projection: Applying Lee-Carter to Australia”. In: (2001). 19
work page 2001
-
[4]
Time series analysis: forecasting and control
George EP Box et al. Time series analysis: forecasting and control . John Wiley & Sons, 2015
work page 2015
-
[5]
Leo Breiman. “Random forests”. In: Machine learning 45 (2001), pp. 5–32
work page 2001
-
[6]
François Chollet et al. Keras. https://keras.io. 2015
2015
-
[7]
Quantile mortality modelling of multiple populations via neural networks
Stefania Corsaro, Zelda Marino, and Salvatore Scognamiglio. “Quantile mortality modelling of multiple populations via neural networks”. In:Insurance: Mathematics and Economics 116 (2024), pp. 114–133
work page 2024
-
[8]
A decoder-only foundation model for time-series forecasting
Abhimanyu Das et al. “A decoder-only foundation model for time-series forecasting”. In: arXiv preprint arXiv:2310.10688 (2023)
arXiv 2023
Show all 37 references
-
[9]
Human Mortality Database
Human Mortality Database. Human Mortality Database . https://www.mortality.org. Available at https://www.mortality.org. 2024
2024
-
[10]
Forecastpfn: Synthetically-trained zero-shot forecasting
Samuel Dooley et al. “Forecastpfn: Synthetically-trained zero-shot forecasting”. In: Advances in Neural Information Processing Systems 36 (2024)
2024
-
[11]
TimeGPT-1
Azul Garza and Max Mergenthaler-Canseco. “TimeGPT-1”. In: arXiv preprint arXiv:2310.03589 (2023)
2023 arXiv
-
[12]
Large language models are zero-shot time series forecasters
Nate Gruver et al. “Large language models are zero-shot time series forecasters”. In:Advances in Neural Information Processing Systems 36 (2024)
2024
-
[13]
A neural-network analyzer for mortality forecast
Donatien Hainaut. “A neural-network analyzer for mortality forecast”. In: ASTIN Bulletin: The Journal of the IAA 48.2 (2018), pp. 481–508
2018
-
[14]
Long Short-term Memory
S Hochreiter. “Long Short-term Memory”. In: Neural Computation MIT-Press (1997)
1997
-
[15]
Forecasting: principles and practice
RJ Hyndman. Forecasting: principles and practice. OTexts, 2018
2018
-
[16]
Automatic time series forecasting: the forecast package for R
Rob J Hyndman and Yeasmin Khandakar. “Automatic time series forecasting: the forecast package for R”. In:Journal of statistical software 27 (2008), pp. 1–22
2008
-
[17]
Modeling and forecasting US mortality
Ronald D Lee and Lawrence R Carter. “Modeling and forecasting US mortality”. In:Journal of the American statistical association 87.419 (1992), pp. 659–671
1992
-
[18]
Application of machine learning to mortality modeling and forecasting
Susanna Levantesi and Virginia Pizzorusso. “Application of machine learning to mortality modeling and forecasting”. In:Risks 7.1 (2019), p. 26
2019
-
[19]
Temporal fusion transformers for interpretable multi-horizon time series fore- casting
Bryan Lim et al. “Temporal fusion transformers for interpretable multi-horizon time series fore- casting”. In: International Journal of Forecasting 37.4 (2021), pp. 1748–1764
2021
-
[20]
Mortality Forecasting Using Temporal Fusion Transformers
Bhekamandaba Makhonza, Nape Mogodi, and Rendani Mbuvha. “Mortality Forecasting Using Temporal Fusion Transformers”. In:Available at SSRN 4684436 (2024)
2024
-
[21]
A time series is worth 64 words: Long-term forecasting with transformers
Yuqi Nie et al. “A time series is worth 64 words: Long-term forecasting with transformers”. In: arXiv preprint arXiv:2211.14730 (2022)
2022 arXiv
-
[22]
A deep learning integrated Lee–Carter model
Andrea Nigri et al. “A deep learning integrated Lee–Carter model”. In:Risks 7.1 (2019), p. 33
2019
-
[23]
Scikit-learn: Machine Learning in Python
F. Pedregosa et al. “Scikit-learn: Machine Learning in Python”. In:Journal of Machine Learning Research 12 (2011), pp. 2825–2830
2011
-
[24]
Mortality rate forecasting: can recurrent neural networks beat the Lee-Carter model?
Gábor Petneházi and József Gáll. “Mortality rate forecasting: can recurrent neural networks beat the Lee-Carter model?” In:arXiv preprint arXiv:1909.05501 (2019)
2019 arXiv
-
[25]
Improving language understanding by generative pre-training
Alec Radford et al. “Improving language understanding by generative pre-training”. In: (2018)
2018
-
[26]
Language models are unsupervised multitask learners
Alec Radford et al. “Language models are unsupervised multitask learners”. In:OpenAI blog 1.8 (2019), p. 9
2019
-
[27]
Exploring the limits of transfer learning with a unified text-to-text transformer
Colin Raffel et al. “Exploring the limits of transfer learning with a unified text-to-text transformer”. In: Journal of machine learning research 21.140 (2020), pp. 1–67
2020
-
[28]
Lag-llama: Towards foundation models for time series forecasting
Kashif Rasul et al. “Lag-llama: Towards foundation models for time series forecasting”. In: R0- FoMo: Robustness of Few-shot and Zero-shot Learning in Large Foundation Models . 2023
2023
-
[29]
A neural network extension of the Lee–Carter model to multiple populations
Ronald Richman and Mario V Wüthrich. “A neural network extension of the Lee–Carter model to multiple populations”. In:Annals of Actuarial Science 15.2 (2021), pp. 346–366
2021
-
[30]
Transformer self-attention network for forecasting mortality rates
Amin Roshani, Muhyiddin Izadi, and Baha-Eldin Khaledi. “Transformer self-attention network for forecasting mortality rates”. In:Journal of the Iranian Statistical Society 21.1 (2022), pp. 81–103
2022
-
[31]
Point and interval forecasts of death rates using neural networks
Simon Schnürch and Ralf Korn. “Point and interval forecasts of death rates using neural networks”. In: ASTIN Bulletin: The Journal of the IAA 52.1 (2022), pp. 333–360. 20
2022
-
[32]
Calibrating the lee-carter and the poisson lee-carter models via neural networks
Salvatore Scognamiglio. “Calibrating the lee-carter and the poisson lee-carter models via neural networks”. In: ASTIN Bulletin: The Journal of the IAA 52.2 (2022), pp. 519–561
2022
-
[33]
statsmodels: Econometric and statistical modeling with python
Skipper Seabold and Josef Perktold. “statsmodels: Econometric and statistical modeling with python”. In: 9th Python in Science Conference . 2010
2010
-
[34]
Smith et al
Taylor G. Smith et al. pmdarima: ARIMA estimators for Python . 2017–. url: http : / / www . alkaline-ml.com/pmdarima
2017
-
[35]
Attention is all you need
Ashish Vaswani et al. “Attention is all you need”. In:Advances in neural information processing systems 30 (2017)
2017
-
[36]
Time-series forecasting of mortality rates using transformer
Jun Wang et al. “Time-series forecasting of mortality rates using transformer”. In:Scandinavian Actuarial Journal 2024.2 (2024), pp. 109–123
2024
-
[37]
Unified training of universal time series forecasting transformers
Gerald Woo et al. “Unified training of universal time series forecasting transformers”. In:arXiv preprint arXiv:2402.02592 (2024). 21
2024 arXiv
Reviewed August 15, 2026 · model on record in the stance chip above.
Discussion (0). Continue with ORCID to comment.