REVIEW 3 major objections 7 minor 44 references
FinSurvival: A Suite of Large Scale Survival Modeling Tasks from Finance
T0 review · 3 major / 7 minor · reviewed 2026-08-06 · deepseek-v4-flash
Pith's one-line read FinSurvival turns 7.7 million public DeFi lending transactions into 16 survival-model benchmarks, and shows existing methods, especially deep learning, struggle on them.
desk verdict A genuinely useful public DeFi survival benchmark whose evaluation claims are weakened by user leakage and two addressable methodological ambiguities. read the letter →
The pith
A machine-rendered reading of the paper's core claim, the machinery that carries it, and where it could break.
The reading
What carries the argument
The central mechanism is the automated index-event/outcome-event pipeline: it takes raw Aave V2 transactions, groups events by user and coin, performs a rolling join so each index event is matched to the first subsequent outcome event by the same subject, and records the elapsed time, censoring any index event that never sees an outcome before the observation window ends. Two design choices carry the argument: the subject definition (user plus reserve) keeps the survival semantics aligned with actual lending behavior, and the 128 features combine raw transaction fields with user-history, market-history, and cyclic time encodings. A secondary mechanism is the restricted mean survival time threshold, computed by increasing the truncation horizon until the estimated RMST changes by less than five percent, which turns each survival task into a binary classification task with a short horizon of roughly 17 to 21 days.
What would settle it
Recompute the C-index and AUC after holding out entire wallets: train on transactions from one set of users and evaluate only on transactions from users never seen in training. If the mean C-index of XGBoost and the mean AUC of logistic regression drop toward 0.5, the paper's claim that the task is learnable across users would be weakened; if scores stay at the reported levels, the independence concern is empirically resolved.
Extended reading notes
Core claim
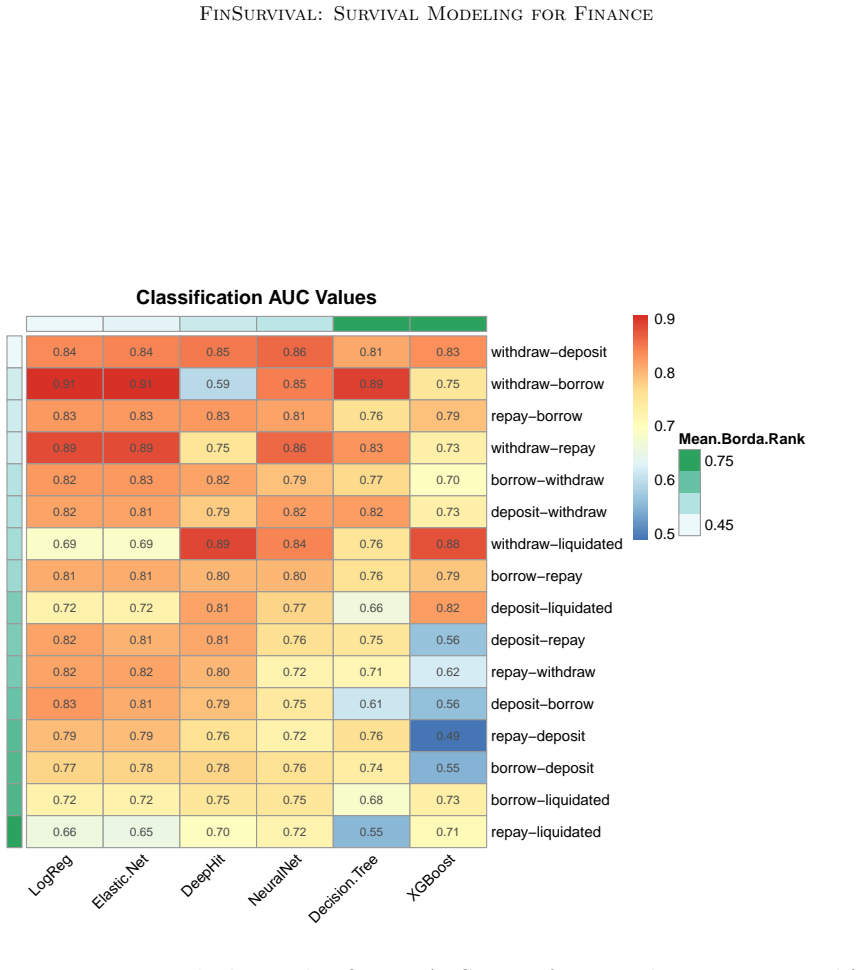
The central claim is that a large-scale, realistic financial survival benchmark can be built entirely from public blockchain transaction data, without any private or paid information, and that doing so reveals important limitations in current survival models. The authors define survival records by pairing an index event (borrow, deposit, repay, or withdraw) with a later outcome event (the same four types plus account liquidation), using the pair of user and coin as the subject so that, for example, the time from borrowing Wrapped Bitcoin to repaying Wrapped Bitcoin is tracked correctly. They report that no existing large public financial survival dataset is derived from DeFi transactions, and their pipeline produces 16 datasets with a mean censoring rate of 81.26%, including highly imbalanced tasks where class 1 rates are as low as 0.2%. On the time-to-event tasks, XGBoost achieves the highest concordance index with a mean of 0.783, followed by accelerated failure time regression at 0.747, while DeepHit and DeepSurv score near or below random guessing; on the classification tasks, linear models lead with mean AUC around 0.795, and XGBoost underperforms. These results are the paper's evidence that the suite offers a demanding, realistic evaluation environment spanning large scale, high censoring, rich covariates, and skewed outcomes.
Load-bearing premise
The benchmark treats each of the 7.6 million records as an independent observation even though 114,861 users each generate many records, and the temporal train/test split does not exclude the same user from both sides, so without a clustered or user-level analysis the reported scores may not measure generalization to new users.
Editorial extensions
If this is right
- If the benchmark is correct, deep survival models can finally be stress-tested at a scale far beyond existing public datasets, since FinSurvival contains roughly 150 times more records than the largest SurvSet entry.
- The RMST-based classification companion tasks make the suite usable by standard classifiers, not only specialized survival methods, broadening who can benchmark against the data.
- The demonstrated strength of XGBoost and AFT over deep survival models on these tasks implies that model choice depends heavily on data regime, and that existing deep survival approaches have headroom for improvement on heavily censored, high-dimensional financial data.
- The release of raw transaction data and the pipeline itself means new DeFi protocols and exchanges can be turned into new survival benchmarks as the ecosystem grows, without the pipeline being rebuilt from scratch.
Reading between the lines
- The reported concordance indices and AUC scores likely overstate generalization to unseen users, because each of the 114,861 wallets contributes many index events and the July 2022 cutoff can place records from the same wallet in both training and testing sets; a clustered evaluation holding out entire users would be a sterner test and could change model rankings.
- The short RMST horizons of roughly 17 to 21 days mean the classification tasks mostly reward predicting whether a behavior occurs within three weeks, so high AUC there may not imply good long-horizon risk discrimination; combining the classification and time-to-event results would give a fuller picture.
- Because liquidations compete with repayments as possible outcomes after a borrow, the single-outcome design likely oversimplifies real DeFi dynamics; explicitly modeling competing risks, which the paper lists as future work, could alter both task difficulty and the best-performing methods.
- The pipeline should transfer to other public financial event logs, such as decentralized exchange trades or crowdsourced lending records, so even without new data collection one could check whether the observed model rankings generalize across financial domains.
Editorial analysis
A structured set of objections, weighed in public.
Referee Report
Summary. The paper introduces FinSurvival, a suite of 16 survival analysis tasks constructed from Aave V2 Ethereum DeFi lending transactions, totaling 7,698,497 records and 128 features, with a mean censoring rate of 81.26%. The tasks are formed by pairing four index event types (borrow, deposit, repay, withdraw) with four outcome event types per index, with subjects defined as (user, coin) pairs. The paper also creates 16 binary classification tasks by thresholding the survival time at a per-task restricted mean survival time (RMST), and benchmarks six survival models (Cox, AFT, GBM, XGBoost, DeepSurv, DeepHit) using C-index and six classification models (LogReg, Decision Tree, XGBoost, Elastic Net, DeepHit, Neural Net) using AUC. It claims this is the first large-scale, publicly available financial survival dataset derived from DeFi transactions and that existing methods find the tasks challenging.
Significance. If the dataset and evaluation are sound, this is a valuable public resource: it is orders of magnitude larger than existing public survival datasets, has high-dimensional features, heavy censoring, and real financial behavior, and the open-source pipeline and public raw data are reproducibility strengths. The benchmark results, once the evaluation issues below are addressed, would provide a useful testbed for survival models under repeated-event and high-censoring conditions. The paper makes no machine-checked proof or parameter-free derivation claims, but the dataset release itself is a concrete, falsifiable contribution that can be independently validated.
major comments (3)
- [Section 4.1 (and Section 2.2)] The classification labels are defined by an RMST threshold, but the paper never states whether the RMST is computed on the training set, the full dataset, or the test set. Section 4.1 says 'We calculated RMST(τ) for increasing values of τ in one-day increments and stopped when the change in RMST(τ) was less than 5%' and Section 2.2 says the buffer length was selected 'in conjunction with the restricted mean survival times (RMSTs) for each task.' If the RMST is estimated from the full data (including the post-July-2022 test period), then test labels are defined using test outcomes, which is label leakage and undermines the temporal-split logic. Please specify the estimation scope, and if thresholds were derived from full data, recompute them on the training set only and re-run the classification benchmark in Table 8.
- [Sections 2.1, 2.2, 3.2, 4.3 (Tables 7 and 8)] The benchmark treats all 7,698,497 records as independent, but records are repeated events nested within 114,861 users (subjects are user-coin pairs; Section 2.1), and the July 1, 2022 split does not exclude users who appear in both training and test sets. Because the features include user-history aggregates computed from events before the index time (Tables 12-13), test records of active users contain information about behavior observed during the training window. The reported C-indices and AUCs therefore mix within-user prediction (using the user's own past) with prediction for never-seen users, and may overstate generalization to new users. Please provide a user-disjoint temporal split or a cluster-robust evaluation (e.g., metrics reported separately for users appearing only in test versus users overlapping with training), and scope the 'challenging tasks' claim accordingly.
- [Section 3.2 and Table 7] The GBM model achieves C-index values near or below 0.3 on nearly all tasks, which is far below the 0.5 random-guessing baseline. This consistent anti-predictive pattern strongly suggests a bug in the implementation or evaluation (e.g., inverted predictions or a survival-objective coding error) rather than a genuine property of the GBM. Since the paper uses these results to conclude that existing methods are not well addressed by the tasks, the authors should verify the GBM predictions (e.g., check concordance orientation on a subsample, or flip predictions to see if C-index rises) and either correct the implementation or explicitly report and explain the anomaly.
minor comments (7)
- [Section 1] The novelty claim ('to the best of our knowledge, this is the first large-scale, publicly available financial survival dataset derived from DeFi transactions') should be supported by a brief description of the search process (databases, queries, keywords) or softened to 'we are not aware of', since it is not a systematic claim.
- [Section 2.1] The text refers to 'section 2.1 for a visualization' and to Kaplan-Meier curves 'in section 2.1'; these should reference Figure 1 and Figure 2 respectively.
- [Section 4.1] The RMST calculation method ('monotonic spline method') is cited to a journal article rather than to a specific software implementation; please clarify the package/software used for the spline and the convergence check, and report whether the 5% change is measured as an absolute day difference or a relative change.
- [Section 4.1 and Table 4] The classification construction drops censored observations with censoring time less than RMST; the paper should report how many records are dropped per task (the difference between the survival and classification counts in Table 4) and discuss any selection bias this introduces.
- [Sections 3 and 4 (Tables 7 and 8)] The benchmark tables do not report variance or confidence intervals for the C-index and AUC scores; given that several model differences are small (e.g., LogReg vs Elastic Net mean AUC 0.795 vs 0.793), the Borda-rank-based ordering should be interpreted with caution.
- [Broader Impact Statement] The claims that Aave is 'inherently fair' and that the possibility of unethical or fraudulent use is 'very small' are unsupported opinions and should be removed or heavily qualified, as they are outside the technical analysis.
- [Appendix A.1] DeepSurv and DeepHit are trained on subsamples (40,000/20,000 rows) while other models use the full data; this asymmetry should be stated in the main text near Table 7 to avoid unfair comparisons.
Circularity Check
No significant circularity; the survival datasets are derived directly from raw transactions and benchmark results are not used as inputs to the construction.
full rationale
The derivation chain is self-contained: raw Aave V2 transaction data are converted to (time, status) records via index/outcome event pairing (Sections 2.1 and B.2), and the 128 features are computed only from information available up to the index event (Appendix B.4). No learned model output is fed back into dataset construction; the only data-derived constant is the RMST cutpoint used to define classification labels. That cutpoint is a fixed threshold on the survival time itself (Section 4.1: 'Class 1 is then defined as events that see their outcome in less time than RMST'), so the classification target is a deterministic label transformation rather than a fitted model parameter; it does not force any particular benchmark result. Self-citations [Green et al. (2022, 2023, 2024)] are used for feature definitions and for the competing-risks discussion, not to justify the central benchmark claims. The temporal split's user overlap and repeated-events dependence are genuine validation concerns, but they concern generalization and benchmark validity, not circular derivation. No uniqueness theorem, ansatz, or renamed known result is imported from the authors' prior work in a load-bearing way.
Assumptions & free parameters
free parameters (1)
- Per-task RMST threshold tau =
17-21 days per task, RMST 10.2-20.3 days (Table 5)
assumptions (5)
- domain assumption The first outcome event after the index event for the same (user, coin) is the event of interest.
- domain assumption Right censoring at the end of the observation period is non-informative.
- domain assumption Records are independent despite repeated index events per user.
- domain assumption TheGraph Aave V2 subgraph data is complete and accurate.
- ad hoc to paper RMST convergence criterion (change <5%) produces a meaningful classification horizon.
Cite this review
Pith. "Pith review of FinSurvival: A Suite of Large Scale Survival Modeling Tasks from Finance." pith.science (2026). https://pith.science/paper/LUOZLQ5P
@misc{pith2026250714160,
  author       = {Pith},
  title        = {Pith review of: FinSurvival: A Suite of Large Scale Survival Modeling Tasks from Finance},
  year         = {2026},
  howpublished = {\url{https://pith.science/paper/LUOZLQ5P}},
  note         = {Machine review of arXiv:2507.14160}
}
read the original abstract
Survival modeling predicts the time until an event occurs and is widely used in risk analysis; for example, it's used in medicine to predict the survival of a patient based on censored data. There is a need for large-scale, realistic, and freely available datasets for benchmarking artificial intelligence (AI) survival models. In this paper, we derive a suite of 16 survival modeling tasks from publicly available transaction data generated by lending of cryptocurrencies in Decentralized Finance (DeFi). Each task was constructed using an automated pipeline based on choices of index and outcome events. For example, the model predicts the time from when a user borrows cryptocurrency coins (index event) until their first repayment (outcome event). We formulate a survival benchmark consisting of a suite of 16 survival-time prediction tasks (FinSurvival). We also automatically create 16 corresponding classification problems for each task by thresholding the survival time using the restricted mean survival time. With over 7.5 million records, FinSurvival provides a suite of realistic financial modeling tasks that will spur future AI survival modeling research. Our evaluation indicated that these are challenging tasks that are not well addressed by existing methods. FinSurvival enables the evaluation of AI survival models applicable to traditional finance, industry, medicine, and commerce, which is currently hindered by the lack of large public datasets. Our benchmark demonstrates how AI models could assess opportunities and risks in DeFi. In the future, the FinSurvival benchmark pipeline can be used to create new benchmarks by incorporating more DeFi transactions and protocols as the use of cryptocurrency grows.
Figures


Figures from the paper (1 more)
Reference graph
Works this paper leans on
-
[1]
Biometrics. Empirical choice of time window for restricted mean survival: Statistical approaches and applications. Biometrics, 76 0 (4): 0 1157--1167, 2021. doi:10.1111/biom.13237. URL https://academic.oup.com/biometrics/article/76/4/1157/7425683
-
[2]
Boado, Ernesto . AAVE Protocol Whitepaper . Technical report, 01 2020. URL https://www.cryptocompare.com/media/38553941/aave\_protocol\_whitepaper\_v1\_0.pdf
-
[3]
A. P. Bradley. The use of the area under the roc curve in the evaluation of machine learning algorithms. Pattern Recognition, 30 0 (7): 0 1145--1159, 1997. ISSN 0031-3203. doi:https://doi.org/10.1016/S0031-3203(96)00142-2. URL https://www.sciencedirect.com/science/article/pii/S0031320396001422
-
[4]
L. Breiman, J. Friedman, R. A. Olshen, and C. J. Stone. Classification and Regression Trees. Chapman and Hall/CRC, New York, 1984. ISBN 9781315139470. doi:10.1201/9781315139470
-
[5]
N. V. Chawla, K. W. Bowyer, L. O. Hall, and W. P. Kegelmeyer. Smote: synthetic minority over-sampling technique. Journal of artificial intelligence research, 16: 0 321--357, 2002
work page 2002
-
[6]
T. Chen and C. Guestrin. Xgboost: A scalable tree boosting system. In Proceedings of the 22nd ACM SIGKDD International Conference on Knowledge Discovery and Data Mining, KDD ’16, page 785–794. ACM, Aug. 2016. doi:10.1145/2939672.2939785. URL http://dx.doi.org/10.1145/2939672.2939785
arXiv 2016
-
[7]
T. Chen, T. He, M. Benesty, V. Khotilovich, Y. Tang, H. Cho, K. Chen, R. Mitchell, I. Cano, T. Zhou, M. Li, J. Xie, M. Lin, Y. Geng, Y. Li, and J. Yuan. xgboost: Extreme Gradient Boosting, 2024. URL https://CRAN.R-project.org/package=xgboost. R package version 1.7.8.1
work page 2024
-
[8]
D. R. Cox. Regression models and life-tables. Journal of the Royal Statistical Society. Series B (Methodological), 34 0 (2): 0 187--220, 1972. ISSN 00359246. URL http://www.jstor.org/stable/2985181
arXiv 1972
Show all 44 references
-
[9]
M. J. Crowther, P. Royston, and M. Clements. A flexible parametric accelerated failure time model and the extension to time-dependent acceleration factors. Biostatistics, 24 0 (3): 0 811--831, 05 2022. ISSN 1465-4644. doi:10.1093/biostatistics/kxac009. URL https://doi.org/10.1...
2022 doi
-
[10]
Curtis, S
C. Curtis, S. Shah, S.-F. Chin, G. Turashvili, O. Rueda, M. Dunning, D. Speed, A. Lynch, S. Samarajiwa, Y. Yuan, S. Gräf, G. Ha, G. Haffari, A. Bashashati, R. Russell, S. McKinney, C. Caldas, S. Aparicio, J. Brenton, and A.-L. Børresen-Dale. The genomic and transcriptomic arch...
2012 doi
-
[11]
Drysdale
E. Drysdale. Survset: An open-source time-to-event dataset repository. arXiv preprint arXiv:2203.03094, 2022
2022 arXiv
-
[12]
DUFFIE, A
D. DUFFIE, A. ECKNER, G. HOREL, and L. SAITA. Frailty correlated default. The Journal of Finance, 64 0 (5): 0 2089--2123, 2009. doi:https://doi.org/10.1111/j.1540-6261.2009.01495.x. URL https://onlinelibrary.wiley.com/doi/abs/10.1111/j.1540-6261.2009.01495.x
2009
-
[13]
K. C. Floyd, J. Yarzebski, F. A. Spencer, D. Lessard, J. E. Dalen, J. S. Alpert, J. M. Gore, and R. J. Goldberg. A 30-year perspective (1975-2005) into the changing landscape of patients hospitalized with initial acute myocardial infarction: Worcester heart attack study. Circ....
1975
-
[14]
J. A. Foekens, H. A. Peters, M. P. Look, H. Portengen, M. Schmitt, M. D. Kramer, N. Brunner, F. Janicke, M. E. M.-v. Gelder, S. C. Henzen-Logmans, W. L. J. van Putten, and J. G. M. Klijn. The Urokinase System of Plasminogen Activation and Prognosis in 2780 Breast Cancer Patien...
2000
-
[15]
Friedman, R
J. Friedman, R. Tibshirani, and T. Hastie. Regularization paths for generalized linear models via coordinate descent. Journal of Statistical Software, 33 0 (1): 0 1--22, 2010. doi:10.18637/jss.v033.i01
2010 doi
-
[16]
J. H. Friedman. Greedy function approximation: A gradient boosting machine. The Annals of Statistics, 29 0 (5): 0 1189 -- 1232, 2001. doi:10.1214/aos/1013203451. URL https://doi.org/10.1214/aos/1013203451
2001
-
[17]
B. F. Ganzfried, M. Riester, B. Haibe-Kains, T. Risch, S. Tyekucheva, I. Jazic, X. V. Wang, M. Ahmadifar, M. J. Birrer, G. Parmigiani, C. Huttenhower, and L. Waldron. curatedOvarianData : clinically annotated data for the ovarian cancer transcriptome. Database (Oxford), 2013: ...
2013
-
[18]
Green, C
A. Green, C. Cammilleri, J. S. Erickson, O. Seneviratne, and K. P. Bennett. Defi survival analysis: Insights into risks and user behaviors. In The International Conference on Mathematical Research for Blockchain Economy, pages 127--141. Springer, 2022
2022
-
[19]
Green, M
A. Green, M. Giannattasio, K. Wang, J. S. Erickson, Oshani, Seneviratne, and K. P. Bennett. Characterizing common quarterly behaviors in defi lending protocols. 2023. URL https://www.marble-conference.org/marble2023-cfp
2023
-
[20]
A. M. Green, M. P. Giannattasio, J. S. Erickson, O. Seneviratne, and K. P. Bennett. Defi survival analysis: Insights into the emerging decentralized financial ecosystem. Distributed Ledger Technologies: Research and Practice, 3 0 (1): 0 1--23, 2024
2024
-
[21]
B. Jing, T. Zhang, Z. Wang, Y. Jin, K. Liu, W. Qiu, L. Ke, Y. Sun, C. He, D. Hou, et al. A deep survival analysis method based on ranking. Artificial intelligence in medicine, 98: 0 1--9, 2019
2019
-
[22]
J. Kaplan. fastDummies: Fast Creation of Dummy (Binary) Columns and Rows from Categorical Variables, 2025. URL https://CRAN.R-project.org/package=fastDummies. R package version 1.7.5
2025
-
[23]
J. L. Katzman, U. Shaham, A. Cloninger, J. Bates, T. Jiang, and Y. Kluger. Deepsurv: personalized treatment recommender system using a cox proportional hazards deep neural network. BMC medical research methodology, 18: 0 1--12, 2018
2018
-
[24]
W. A. Knaus, F. E. Harrell, J. Lynn, L. Goldman, R. S. Phillips, A. F. Connors, N. Dawson, W. J. Fulkerson, R. M. Califf, N. A. Desbiens, P. Layde, R. Oye, P. E. Bellamy, R. B. Hakim, and D. P. Wagner. The support prognostic model. objective estimates of survival for seriously...
1995
-
[25]
D. Lando. On cox processes and credit risky securities. Review of Derivatives Research, 2: 0 99--120, 12 1998. doi:10.1007/BF01531332
1998 doi
-
[26]
C. Lee, W. Zame, J. Yoon, and M. van der Schaar. Deephit: A deep learning approach to survival analysis with competing risks. Proceedings of the AAAI Conference on Artificial Intelligence, 32 0 (1), 2018. doi:10.1609/aaai.v32i1.11842. URL https://doi.org/10.1609/aaai.v32i1.11842
2018 doi
-
[27]
Miscouridou, A
X. Miscouridou, A. Perotte, N. Elhadad, and R. Ranganath. Deep survival analysis: Nonparametrics and missingness. In Machine Learning for Healthcare Conference, pages 244--256. PMLR, 2018
2018
-
[28]
J. V. Monaco, M. Gorfine, and L. Hsu. General semiparametric shared frailty model: Estimation and simulation with frailtySurv . Journal of Statistical Software, 86 0 (4): 0 1--42, 2018. doi:10.18637/jss.v086.i04
2018 doi
-
[29]
Pav \ a o
A. Pav \ a o. Methodology for Design and Analysis of Machine Learning Competitions . Theses, Universit \'e Paris-Saclay , Dec. 2023. URL https://inria.hal.science/tel-04401932
2023
-
[30]
R: A Language and Environment for Statistical Computing
R Core Team . R: A Language and Environment for Statistical Computing. R Foundation for Statistical Computing, Vienna, Austria, 2024. URL https://www.R-project.org/
2024
-
[31]
Ranganath, A
R. Ranganath, A. Perotte, N. Elhadad, and D. Blei. Deep survival analysis. In Machine Learning for Healthcare Conference, pages 101--114. PMLR, 2016
2016
-
[32]
Salerno and Y
S. Salerno and Y. Li. High-dimensional survival analysis: Methods and applications. Annual Review of Statistics and Its Application, 10 0 (1): 0 25--49, 2023. doi:10.1146/annurev-statistics-042623-040121. URL https://doi.org/10.1146/annurev-statistics-042623-040121
2023 doi
-
[33]
T. Shumway. Forecasting bankruptcy more accurately: A simple hazard model. The Journal of Business, 74 0 (1): 0 101--124, 2001. ISSN 00219398, 15375374. URL http://www.jstor.org/stable/10.1086/209665
2001 doi
-
[34]
Sonabend
R. Sonabend. survivalmodels: Models for Survival Analysis, 2024. URL https://CRAN.R-project.org/package=survivalmodels. R package version 0.1.191
2024
-
[35]
J. K. Tay, B. Narasimhan, and T. Hastie. Elastic net regularization paths for all generalized linear models. Journal of Statistical Software, 106 0 (1): 0 1--31, 2023. doi:10.18637/jss.v106.i01
2023 doi
-
[36]
Therneau and B
T. Therneau and B. Atkinson. rpart: Recursive Partitioning and Regression Trees, 2023. URL https://CRAN.R-project.org/package=rpart. R package version 4.1.23
2023
-
[37]
T. M. Therneau. A Package for Survival Analysis in R, 2022. URL https://CRAN.R-project.org/package=survival. R package version 3.4-0
2022
-
[38]
Tibshirani
R. Tibshirani. Regression shrinkage and selection via the lasso. Journal of the Royal Statistical Society: Series B (Methodological), 58 0 (1): 0 267--288, 1996
1996
-
[39]
H. Uno, B. Claggett, L. Tian, E. Inoue, W. T. Gallo, T. Miyata, D. Schrag, M. Takeuchi, Y. Uyama, L. T. Zhao, et al. Restricted mean survival time: an alternative to the hazard ratio for the design and analysis of randomized trials. Journal of Clinical Oncology, 32 0 (25): 0 2...
2014 doi
-
[40]
Ushey, J
K. Ushey, J. Allaire, and Y. Tang. reticulate: Interface to 'Python', 2024. URL https://CRAN.R-project.org/package=reticulate. R package version 1.38.0
2024
-
[41]
K. Y. Wang, G. M. Pupo, V. Tembe, E. Patrick, D. Strbenac, S.-J. Schramm, J. F. Thompson, R. A. Scolyer, S. Mueller, G. Tarr, G. J. Mann, and J. Y. Yang. Cross-platform omics prediction procedure: a game changer for implementing precision medicine in patients with stage-iii me...
2020 doi
-
[42]
Wiegrebe, P
S. Wiegrebe, P. Kopper, R. Sonabend, B. Bischl, and A. Bender. Deep learning for survival analysis: a review. Artificial Intelligence Review, 57 0 (3): 0 65, 2024
2024
-
[43]
J. Yinger. Discrimination in mortgage lending: A literature review. Mortgage lending, racial discrimination and federal policy, pages 29--73, 2018
2018
-
[44]
Zou and T
H. Zou and T. Hastie. Regularization and variable selection via the elastic net. Journal of the Royal Statistical Society: Series B (Statistical Methodology), 67 0 (2): 0 301--320, 2005
2005
Reviewed August 6, 2026 · model on record in the stance chip above.
Discussion (0). Continue with ORCID to comment.