REVIEW 2 major objections 5 minor 84 references
Modeling and Interpreting Correlations, Null Distributions and Significance Levels in Neural Tracking of Natural Stimuli
T0 review · 2 major / 5 minor · reviewed 2026-08-12 · deepseek-v4-flash
Pith's one-line read Neural-tracking correlations only become comparable when scored against their null distribution, and 3–5 minutes of data suffice to build it.
desk verdict A principled, well-validated framework for interpreting neural-tracking correlations, with one honest gap: the window-length extrapolation is used beyond its validated range. read the letter →
The pith
A machine-rendered reading of the paper's core claim, the machinery that carries it, and where it could break.
The reading
What carries the argument
The carrying mechanism is the Fisher transform z = artanh(r) applied to null correlations, modeled as z ~ N(0, $sigma_z^{2}$) with the variance estimated empirically from misaligned stimulus-response pairs rather than set to 1/(N-3). The variance is then rescaled across window lengths using the ratio V(N_target)/V(N_base) of the theoretical independent-sample variances, and the significance level is recovered by applying the inverse transform tanh to a normal percentile. NNTS divides Fisher-transformed real correlations by the null standard deviation (window level) or by the pooled standard deviation of real and null correlations (participant level), making NNTS a d-prime-like sensitivity index.
What would settle it
Measure the Fisher-transformed null variance from misaligned stimulus-response pairs at several window lengths (for example 1, 2, 5, 10, and 20 seconds), divide each by the theoretical independent-sample variance V(N), and check whether the resulting ratios are constant across N; if they drift, the extrapolation formula is systematically biased and the predicted significance levels and recording times are unreliable.
Extended reading notes
Core claim
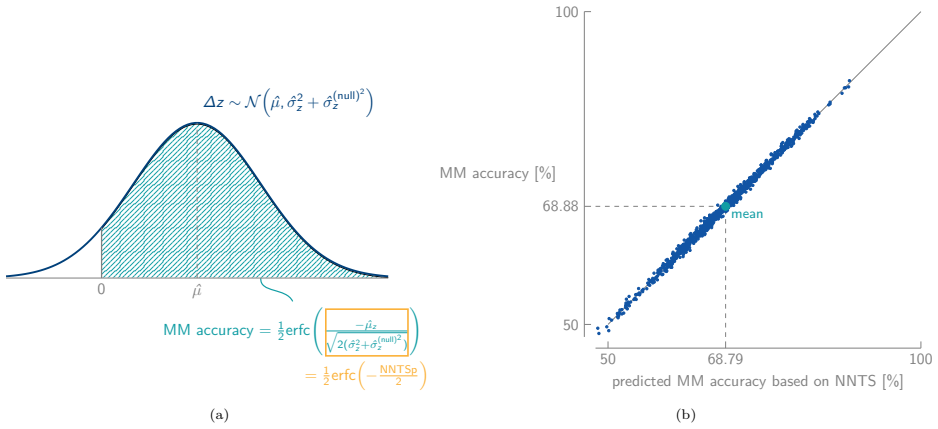
The paper's central claim is that the Pearson correlation between a decoded neural response and a stimulus feature is not a meaningful performance metric by itself, because its scale depends on the statistical properties of the feature and the decoder. The authors establish that the right way to interpret a tracking correlation is against the null distribution generated by stimulus-response misalignment, and that this null distribution is accurately and efficiently captured by a zero-mean normal distribution after the Fisher transform. From that model they derive significance levels at any window length and a null-normalized tracking score (NNTS) that puts different features and models on a common, unbounded scale, equals d-prime, and has a direct mathematical relation to match-mismatch accuracy. In EEG data from 121 listeners, the framework reverses the ranking suggested by raw correlations: a 1-1.1 Hz smallband envelope has among the highest raw correlations but the lowest NNTS.
Load-bearing premise
The load-bearing premise is that autocorrelation inflates the spread of null correlations by the same factor at every window length, so a variance measured at one window length can be extrapolated to all others.
Editorial extensions
If this is right
- With only 3-5 minutes of data (about 1000 misaligned permutations), significance levels can be estimated reliably for any window length and feature, removing the need for tens of thousands of permutations.
- Features and models can be compared on a common scale via NNTS; in the 121-participant EEG analysis, the smallband envelope drops from the top raw correlation to the worst NNTS, while the envelope, acoustic edge, and phoneme onset form a top tier.
- NNTS is mathematically equivalent, up to a monotone transform, to match-mismatch accuracy, with predicted accuracy within 0.37 percentage points of measured accuracy, and it saturates less because it is unbounded.
- Significance levels can be extrapolated across window lengths, allowing prediction of the measurement time needed for a target correlation to reach significance: about 17 seconds for the envelope, acoustic edge, and phoneme onset versus 93 seconds for the smallband envelope.
- The framework is agnostic to the choice of permutation method and to stimulus modality, so the same pipeline should apply to music, video, MEG, or ECoG data, subject to empirical confirmation.
Reading between the lines
- If the variance-ratio assumption holds for other stimuli and recording modalities, the same 3-5 minute recipe could be used to design clinical or hearing-aid protocols that pre-specify recording duration from a target correlation.
- Because NNTS depends only on the distributions of real and null correlations, it should also apply to non-linear or deep-learning decoders, whose raw correlation scales are even harder to interpret; this is a testable extension the paper does not run.
- The equivalence between NNTS and match-mismatch accuracy suggests that existing match-mismatch pipelines could switch to NNTS to gain continuous, unbounded resolution without changing the underlying experiment.
- A direct check of the variance-ratio assumption across window lengths on non-speech stimuli would tell whether the extrapolated significance levels and recording-time predictions transfer beyond the one dataset used here.
Signed reviews
Editorial analysis
A structured set of objections, weighed in public.
Referee Report
Summary. The paper argues that raw Pearson correlations used to quantify neural tracking of natural stimuli are not comparable across stimulus features or models, because their null distributions differ. It compares four surrogate-data methods for constructing null distributions (random shuffling, circular shifting, phase scrambling, and stimulus-response misalignment), argues that each encodes a different null hypothesis, and adopts misalignment as the most appropriate for content-specific neural tracking. The paper then introduces a semi-parametric model in which Fisher-transformed null correlations are treated as zero-mean normal with an empirically estimated variance, claims that this yields accurate significance levels with far fewer permutations than the empirical null distribution, and extends this to predict significance levels at other window lengths by rescaling the estimated variance with the theoretical independent-sample variance V(N). On this basis it proposes the null-normalized tracking score (NNTS), shows a mathematical and empirical relationship between NNTS and match-mismatch accuracy, and applies the framework to EEG data from 121 participants listening to a continuous story, concluding that raw correlations would reverse the ranking of features relative to the NNTS-based ranking.
Significance. If the central claims hold, the paper provides a practically useful and statistically principled framework for a widespread analysis choice in EEG/MEG speech tracking: it offers a way to estimate significance levels efficiently, to compare features and models on a common scale, and to connect correlation-based tracking metrics to match-mismatch accuracy. The paper is unusually thorough in its empirical validation: it uses 100,000 permutations as a ground-truth null, reports both correlation-domain and percentile-domain errors, quantifies bias and variance through resampling, and verifies the NNTS-to-match-mismatch relationship with a reported 0.37 percentage point error. The theoretical V(N) rescaling is a parameter-free derivation, and the code, data, and toolbox availability statements are exemplary. The main limitation is that the cross-window extrapolation, which underpins the headline efficiency claim and the predicted measurement times, is validated only for window lengths up to 20 s and is then applied to far longer windows; this is a load-bearing issue rather than a cosmetic one, but it is addressable with additional validation or with appropriately restricted claims.
major comments (2)
- [4.3 (Eq. (3)); Table 1] The extrapolation formula in Eq. (3) rests on the assumption that the empirical null variance of the Fisher-transformed correlations equals c*V(N) with the same multiplicative constant c at every window length, where c absorbs the autocorrelation-induced inflation of the effective sample size. The manuscript validates the resulting extrapolation only for window lengths of 1, 2, 5, 10, and 20 s (Figures 11-12), and Table 1 then extrapolates to 93.4 s for the smallband envelope and 43.0 s for punctuation onset, far beyond the validated range. Because the ridge-regularized decoder is retrained at each window length and because the spectral properties of the stimulus feature and the reconstruction differ, the inflation factor could plausibly change with N, which would bias the extrapolated significance levels and the predicted measurement times. The manuscript should either validate the constancy of the inflation factor at longer window lengths, provide a bound on its variation, or explicitly restrict the extrapolation claim to the validated range.
- [5.1 (Table 1)] The predicted measurement times in Table 1 additionally assume that the mean correlation for each feature is approximately constant across window lengths. This assumption is stated in Section 5.1 with a citation to Lopez-Gordo et al. (2025), but that reference concerns unsupervised accuracy estimation in auditory attention decoding rather than a direct demonstration for the speech features and the 121-participant dataset used here. Since the predicted time to significance depends as much on this assumed constancy as on the null-variance extrapolation, the table should either provide supporting evidence that the mean correlations are stable for these features or present the assumption explicitly with a discussion of how its failure would change the predictions.
minor comments (5)
- [Figure 3 caption] The caption contains a typo: 'readibility' should be 'readability'.
- [Section 1] The text contains a typo: 'non-trival problem' should be 'non-trivial problem'.
- [Appendix B] The appendix appears to contain a duplicated and incomplete passage: the sentence beginning 'Given estimated variance of the per-window raw correlations (with mean assumed0):' is immediately followed by a second, nearly identical introduction of the same problem; this passage should be rewritten as a single clean statement.
- [Figure 16(b)] The x-axis label 'mean predicted MM accuracy based on NNTS [%]' is ambiguous; the figure would be clearer if the axes were labeled 'Predicted match-mismatch accuracy [%]' and 'Observed match-mismatch accuracy [%]'.
- [Key take-away #4] The key take-away box ends with an ellipsis and appears to omit the end of the sentence ('...across window lengths, features, ...'); the sentence should be completed or the ellipsis removed.
Circularity Check
No circular derivation: the null model, the window-length extrapolation, and the NNTS/match-mismatch link are self-contained, empirically validated, or explicitly assumed, rather than reduced to their own inputs.
full rationale
The paper's derivation chain does not reduce to its inputs. The null distribution is generated by the misalignment procedure of Section 3.1.5, and the semi-parametric Fisher-transform model has a single data-estimated parameter, the null variance, fitted from those permutations (Section 4.1). The significance-level estimates are validated against independent 100,000-permutation ground truths and against subset sizes (Figures 9-10), so the '3-5 min' efficiency claim is an out-of-sample statistical claim, not a renamed fit. The window-length extrapolation in Eq. (3) uses V(N) from Fouladi and Steiger (2008), an external cumulant result, and the key assumption that the autocorrelation inflation factor is window-length-independent is explicit and empirically checked over the validated 1-20 s range (Figures 11-12). Extrapolation to 93 s in Table 1 is labeled illustrative and rests on a stated assumption about constant mean correlation, not on a tautology. The NNTS definitions in Eq. (5) are constructions, and the match-mismatch relation is derived algebraically from normal assumptions and then empirically checked (0.37 percentage point error, Figure 16b), so it is not circular. Self-citations to Geirnaert et al. (2025) and Lopez-Gordo et al. (2025) support implementation details or an explicitly stated assumption for Table 1, and they are not load-bearing; no result is forced by a self-citation chain. Single-dataset validation is a limitation, but it is a generalization risk rather than circularity.
Assumptions & free parameters
free parameters (2)
- Null variance of Fisher-transformed correlations (sigma_z^2) =
Estimated per participant, feature, and window length (no single value)
- Ridge regularization parameter (lambda) of the backward decoder =
Not reported in the text
assumptions (6)
- standard math The Fisher transformation of a Pearson correlation is approximately normally distributed, with variance depending on the sample size N.
- domain assumption The null distribution of correlation coefficients must have a mean of zero.
- domain assumption The stimulus and its statistical relationship to the neural response are approximately stationary across the segments used for misalignment.
- ad hoc to paper The ratio of the actual null variance of Fisher-transformed correlations to the theoretical independent-sample variance V(N) is constant across window lengths.
- domain assumption Real (aligned) correlations, after Fisher transformation, follow a normal distribution with a non-zero mean.
- ad hoc to paper Aligned and misaligned Fisher-transformed correlations are independent in the match-mismatch derivation.
Cite this review
Pith. "Pith review of Modeling and Interpreting Correlations, Null Distributions and Significance Levels in Neural Tracking of Natural Stimuli." pith.science (2026). https://pith.science/paper/LWR5SRNK
@misc{pith2026260810887,
  author       = {Pith},
  title        = {Pith review of: Modeling and Interpreting Correlations, Null Distributions and Significance Levels in Neural Tracking of Natural Stimuli},
  year         = {2026},
  howpublished = {\url{https://pith.science/paper/LWR5SRNK}},
  note         = {Machine review of arXiv:2608.10887}
}
read the original abstract
Neural tracking - the time-locking of neural responses to continuous stimuli such as speech, music, and video - is widely used to study how the brain processes natural input. Tracking strength is typically quantified as the correlation between the recorded neural response and the stimulus, decoded and/or encoded through data-driven models, and this correlation is routinely used to compare stimulus features, models, or settings. However, its magnitude depends not only on how strongly the brain tracks the stimulus, but also on the statistical properties of the signals being correlated. For example, a smallband speech envelope carrying almost no information about speech content yields among the highest correlations, simply because it is easier to reconstruct. Meaningful interpretation therefore requires comparing each correlation to its null distribution: the correlations expected without any stimulus-response relationship. We show that the randomization procedures commonly used to construct this null distribution are not interchangeable: each implicitly encodes a different null hypothesis, and we motivate stimulus-response misalignment as the most practical and appropriate choice. Because reliable null distributions require many permutations, we introduce a semi-parametric model using the normal distribution after the Fisher transform that yields accurate significance levels from only 3-5 min of data and predicts them across analysis window lengths. Building on this, we propose the null-normalized tracking score, an interpretable measure placing features and models on a common scale, which relates directly to the widely used match-mismatch accuracy. Applied to EEG from 121 participants listening to continuous speech, the framework reverses conclusions drawn from raw correlations, providing an efficient and principled methodology for interpreting neural tracking correlations.
Figures


Figures from the paper (14 more)



Reference graph
Works this paper leans on
-
[1]
doi:10.1109/ICASSP39728.2021.9413404 , file =
Geirnaert, Simon and Francart, Tom and Bertrand, Alexander , booktitle =. doi:10.1109/ICASSP39728.2021.9413404 , file =
arXiv 2021
-
[2]
IEEE Signal Processing Magazine , volume=
Electroencephalography-based auditory attention decoding: Toward neurosteered hearing devices , author=. IEEE Signal Processing Magazine , volume=. 2021 , publisher=
2021
-
[3]
Proceedings of the National Academy of Sciences , volume=
The harmonic mean p-value for combining dependent tests , author=. Proceedings of the National Academy of Sciences , volume=. 2019 , doi =
2019
-
[4]
doi:10.1088/1741-2552/abf771 , year =
de Cheveigné, Alain and Slaney, Malcolm and Fuglsang, Søren A and Hjortkjaer, Jens , title =. doi:10.1088/1741-2552/abf771 , year =
-
[5]
Decoding the auditory brain with canonical component analysis , journal =. 2018 , issn =. doi:10.1016/j.neuroimage.2018.01.033 , author =
-
[6]
NeuroImage , volume =. 2019 , issn =. doi:10.1016/j.neuroimage.2019.04.037 , author =
-
[7]
Wilroth, Johanna and Silva, Nancy Sotero and Tafakkor, Ali and de Avo Mesquita, Bruno and Ip, Emily Y. J. and Lau, Bonnie and Hannah, Jaimy and Di Liberto, Giovanni M. , title =. 2026 , doi =
2026
-
[8]
2024 , volume=
Monesi, Mohammad Jalilpour and Bollens, Lies and Accou, Bernd and Vanthornhout, Jonas and Van Hamme, Hugo and Francart, Tom , journal=. 2024 , volume=
2024
Show all 84 references
-
[9]
doi:10.1088/1741-2552/ae3ae1 , year =
MacIntyre, Alexis D and Gaultier, Clément and Goehring, Tobias , title =. doi:10.1088/1741-2552/ae3ae1 , year =
-
[10]
Di Liberto, Giovanni M. , year=
-
[11]
Nicolas Heintz and Tom Francart and Alexander Bertrand , year=
-
[12]
and Power, Alan J
O'Sullivan, James A. and Power, Alan J. and Mesgarani, Nima and Rajaram, Siddharth and Foxe, John J. and Shinn-Cunningham, Barbara G. and Slaney, Malcolm and Shamma, Shihab A. and Lalor, Edmund C. , doi =. Cerebral Cortex , keywords =
-
[13]
Mesgarani, Nima and Chang, Edward F. , doi =. Nature , keywords =
-
[14]
and Fuglsang, S
Wong, Daniel D.E. and Fuglsang, S. Frontiers in Neuroscience , keywords =. doi:10.3389/fnins.2018.00531 , file =
2018
-
[15]
IEEE Transactions on Neural Systems and Rehabilitation Engineering , keywords =
Geirnaert, Simon and Francart, Tom and Bertrand, Alexander , doi =. IEEE Transactions on Neural Systems and Rehabilitation Engineering , keywords =
-
[16]
eLife , number =
Vandecappelle, Servaas and Deckers, Lucas and Das, Neetha and Ansari, Amir Hossein and Bertrand, Alexander and Francart, Tom , doi =. eLife , number =
-
[17]
and Zuk, Nathaniel J
Crosse, Michael J. and Zuk, Nathaniel J. and Di Liberto, Giovanni M. and Nidiffer, Aaron R. and Molholm, Sophie and Lalor, Edmund C. , month = nov, year =. Linear. doi:10.3389/fnins.2021.705621 , journal =
2021
-
[18]
Fisher, Ronald A , publisher=
-
[19]
1937 , publisher=
Pitman, Edwin J G , journal=. 1937 , publisher=
1937
-
[20]
2015 , publisher=
Combrisson, Etienne and Jerbi, Karim , journal =. 2015 , publisher=
2015
-
[21]
doi:10.1088/1741-2552/ace73f , year =
Puffay, Corentin and Accou, Bernd and Bollens, Lies and Monesi, Mohammad Jalilpour and Vanthornhout, Jonas and Van hamme, Hugo and Francart, Tom , title =. doi:10.1088/1741-2552/ace73f , year =
-
[22]
The American Statistician , volume =
John Ludbrook and Hugh Dudley , title =. The American Statistician , volume =. 1998 , publisher =
1998
-
[23]
2021 , publisher=
Noguchi, Kimihiro and Konietschke, Frank and Marmolejo-Ramos, Fernando and Pauly, Markus , journal=. 2021 , publisher=
2021
-
[24]
2007 , publisher=
Maris, Eric and Oostenveld, Robert , journal=. 2007 , publisher=
2007
-
[25]
2023 , publisher=
Holt, Charles A and Sullivan, Sean P , journal=. 2023 , publisher=
2023
-
[26]
2024 , doi=
Crosse, Michael J and Foxe, John J and Molholm, Sophie , howpublished =. 2024 , doi=
2024
-
[27]
IEEE Transactions on Biomedical Engineering , number =
Geirnaert, Simon and Francart, Tom and Bertrand, Alexander , doi =. IEEE Transactions on Biomedical Engineering , number =
-
[28]
2024 , doi =
Rotaru, Iustina and Geirnaert, Simon and Heintz, Nicolas and Van de Ryck, Iris and Bertrand, Alexander and Francart, Tom , journal =. 2024 , doi =
2024
-
[29]
doi:10.5281/zenodo.11058711 , url =
Rotaru, Iustina and Geirnaert, Simon and Bertrand, Alexander and Francart, Tom , title =. doi:10.5281/zenodo.11058711 , url =
-
[30]
2024 , publisher=
Geirnaert, Simon and Zink, Rob and Francart, Tom and Bertrand, Alexander , editor=. 2024 , publisher=
2024
-
[31]
doi:10.1016/j.neuron.2012.12.037 , file =
Neuron , number =. doi:10.1016/j.neuron.2012.12.037 , file =
2012 doi
-
[32]
Ding, Nai and Simon, Jonathan Z. , doi =. Journal of Neurophysiology , keywords =
-
[33]
doi:10.1016/j.cub.2015.08.030 , file =
Current Biology , number =. doi:10.1016/j.cub.2015.08.030 , file =
2015 doi
-
[34]
Journal of Neural Engineering , keywords =
Das, Neetha and Biesmans, Wouter and Bertrand, Alexander and Francart, Tom , doi =. Journal of Neural Engineering , keywords =
-
[35]
Journal of Neural Engineering , keywords =
Lotte, Fabien and Bougrain, Laurent and Cichocki, Andrzej and Clerc, Maureen and Congedo, Marco and Rakotomamonjy, Alain and Yger, Florian , doi =. Journal of Neural Engineering , keywords =
-
[36]
IEEE Journal on Biomedical and Health Informatics , number =
Geirnaert, Simon and Francart, Tom and Bertrand, Alexander , doi =. IEEE Journal on Biomedical and Health Informatics , number =
-
[37]
Journal of Neural Engineering , keywords =
Das, Neetha and Bertrand, Alexander and Francart, Tom , doi =. Journal of Neural Engineering , keywords =
-
[38]
2017 , issn =
NeuroImage , volume =. 2017 , issn =. doi:10.1016/j.neuroimage.2017.04.026 , author =
2017 doi
-
[39]
2024 , volume =
Roebben, Arnout and Heintz, Nicolas and Geirnaert, Simon and Francart, Tom and Bertrand, Alexander , journal=. 2024 , volume =
2024
-
[40]
2019 , publisher=
McShane, Blakeley B and Gal, David and Gelman, Andrew and Robert, Christian and Tackett, Jennifer L , journal=. 2019 , publisher=
2019
-
[41]
Nature Human Behaviour , volume=
Benjamin, Daniel J and Berger, James O and Johannesson, Magnus and Nosek, Brian A and Wagenmakers, E-J and Berk, Richard and Bollen, Kenneth A and Brembs, Bj. Nature Human Behaviour , volume=. 2018 , publisher=
2018
-
[42]
and Parra, Lucas C
Ki, Jason J. and Parra, Lucas C. and Dmochowski, Jacek P. , title =. European Journal of Neuroscience , volume =. doi:10.1111/ejn.14924 , year =
-
[43]
2017 , volume=
Biesmans, Wouter and Das, Neetha and Francart, Tom and Bertrand, Alexander , journal=. 2017 , volume=
2017
-
[44]
and Murphy, Jeremy W
Zuk, Nathaniel J. and Murphy, Jeremy W. and Reilly, Richard B. and Lalor, Edmund C. , doi =. PLOS Computational Biology , number =
-
[45]
doi:10.1088/1741-2552/ad2333 , pages =
Yao, Yuanyuan and Stebner, Axel and Tuytelaars, Tinne and Geirnaert, Simon and Bertrand, Alexander , journal =. doi:10.1088/1741-2552/ad2333 , pages =
-
[46]
2022 , publisher=
Thornton, Mike and Mandic, Danilo and Reichenbach, Tobias , journal=. 2022 , publisher=
2022
-
[47]
2019 , publisher=
Etard, Octave and Reichenbach, Tobias , journal=. 2019 , publisher=
2019
-
[48]
2021 , volume=
Reddy Katthi, Jaswanth and Ganapathy, Sriram , journal=. 2021 , volume=
2021
-
[49]
and Francart, Tom and Brodbeck, Christian , doi =
Gillis, Marlies and Vanthornhout, Jonas and Simon, Jonathan Z. and Francart, Tom and Brodbeck, Christian , doi =. Journal of Neuroscience , number =
-
[50]
and Ki, Jason J
Dmochowski, Jacek P. and Ki, Jason J. and DeGuzman, Paul and Sajda, Paul and Parra, Lucas C. , doi =. NeuroImage , keywords =
-
[51]
Frontiers in Neuroscience , keywords =
Alickovic, Emina and Lunner, Thomas and Gustafsson, Fredrik and Ljung, Lennart , doi =. Frontiers in Neuroscience , keywords =
-
[52]
PLOS ONE , number =
Sturm, Irene and D. PLOS ONE , number =. doi:10.1371/journal.pone.0141281 , editor =
-
[53]
doi:10.3389/fnins.2021.673401 , file =
Frontiers in Neuroscience , keywords =. doi:10.3389/fnins.2021.673401 , file =
2021
-
[54]
Hearing Research , pages =
Verschueren, Eline and Somers, Ben and Francart, Tom , doi =. Hearing Research , pages =
-
[55]
and Francart, Tom , doi =
Vanthornhout, Jonas and Decruy, Lien and Wouters, Jan and Simon, Jonathan Z. and Francart, Tom , doi =. Journal of the Association for Research in Otolaryngology , keywords =
- [56]
-
[57]
and David, Stephen V
Pasley, Brian N. and David, Stephen V. and Mesgarani, Nima and Flinker, Adeen and Shamma, Shihab A. and Crone, Nathan E. and Knight, Robert T. and Chang, Edward F. , doi =. PLoS Biology , number =
-
[58]
Journal of Multivariate Analysis , number =
Ledoit, Olivier and Wolf, Michael , doi =. Journal of Multivariate Analysis , number =
-
[59]
Aiken, Steven J and Picton, Terence W. , doi =. Ear and Hearing , number =
-
[60]
doi:10.1109/TBME.2021.3080123 , file =
IEEE Transactions on Biomedical Engineering , number =. doi:10.1109/TBME.2021.3080123 , file =
2021
-
[61]
2008 , doi=
Fouladi, Rachel T and Steiger, James H , journal=. 2008 , doi=
2008
-
[62]
1953 , doi=
Hotelling, Harold , journal=. 1953 , doi=
1953
-
[63]
Fisher, R , journal=
-
[64]
Asuero, A. G. and Sayago, A. and González, A. G. , journal=. 2006 , publisher=
2006
-
[65]
and Wöstmann, M
Fiedler, L. and Wöstmann, M. and Herbst, S. K. and Obleser, J. , doi =. NeuroImage , number =
-
[66]
NeuroImage , number =
Chen, Ya-Ping and Schmidt, Fabian and Keitel, Anne and Rösch, Sebastian and Hauswald, Anne and Weisz, Nathan , doi =. NeuroImage , number =
-
[67]
and Otten, J
Daeglau, M. and Otten, J. and Grimm, G. and Mirkovic, B. and Hohmann, V. and Debener, S. , doi =. Frontiers in Human Neuroscience , pages =
-
[68]
Lopez-Gordo, M. A. and Geirnaert, Simon and Bertrand, Alexander , doi =. IEEE Transactions on Biomedical Engineering , number =
-
[69]
2025 , volume=
Geirnaert, Simon and Vanthornhout, Jonas and Francart, Tom and Bertrand, Alexander , booktitle=. 2025 , volume=
2025
-
[70]
Statistical Applications in Genetics and Molecular Biology , doi =
Belinda Phipson and Gordon K Smyth , volume =. Statistical Applications in Genetics and Molecular Biology , doi =
-
[71]
Data , VOLUME =
Accou, Bernd and Bollens, Lies and Gillis, Marlies and Verheijen, Wendy and Van hamme, Hugo and Francart, Tom , TITLE =. Data , VOLUME =. 2024 , NUMBER =
2024
-
[72]
2015 , publisher=
Horrace, William C , journal=. 2015 , publisher=
2015
-
[73]
2018 , publisher=
Brodbeck, Christian and Hong, L Elliot and Simon, Jonathan Z , journal=. 2018 , publisher=
2018
-
[74]
2018 , publisher=
Broderick, Michael P and Anderson, Andrew J and Di Liberto, Giovanni M and Crosse, Michael J and Lalor, Edmund C , journal=. 2018 , publisher=
2018
-
[75]
2018 , issn =
Physics Reports , volume =. 2018 , issn =. doi:10.1016/j.physrep.2018.06.001 , author =
2018 doi
-
[76]
1996 , publisher =
Schreiber, Thomas and Schmitz, Andreas , journal =. 1996 , publisher =
1996
-
[77]
and Stuart, Alan , title =
Kendall, Maurice G. and Stuart, Alan , title =. 1979 , isbn =
1979
-
[78]
and Torrésani, Bruno and Balazs, Peter , title =
Søndergaard, Peter L. and Torrésani, Bruno and Balazs, Peter , title =. International Journal of Wavelets, Multiresolution and Information Processing , volume =. 2012 , doi =
2012
-
[79]
doi:10.1088/1741-2552/ac33e9 , year =
Accou, Bernd and Jalilpour Monesi, Mohammad and Van hamme, Hugo and Francart, Tom , title =. doi:10.1088/1741-2552/ac33e9 , year =
-
[80]
2026 , publisher =
Geirnaert, Simon and Bertrand, Alexander and Francart, Tom and Vanthornhout, Jonas , title =. 2026 , publisher =. doi:10.5281/zenodo.21821416 , url =
2026 doi
-
[81]
2026 , publisher =
Geirnaert, Simon and Bertrand, Alexander and Francart, Tom and Vanthornhout, Jonas , title =. 2026 , publisher =. doi:10.5281/zenodo.21827915 , url =
2026 doi
-
[82]
2026 , publisher =
Geirnaert, Simon and Bertrand, Alexander and Francart, Tom and Vanthornhout, Jonas , title =. 2026 , publisher =. doi:10.5281/zenodo.21819899 , url =
2026 doi
-
[83]
and Foxe, John J
Lalor, Edmund C. and Foxe, John J. , title =. European Journal of Neuroscience , volume =. doi:10.1111/j.1460-9568.2009.07055.x , year =
2009
-
[84]
The Technology of Binaural Listening , publisher =
Søndergaard, Peter and Majdak, Piotr , title =. The Technology of Binaural Listening , publisher =. 2013 , editor =
2013
Reviewed August 12, 2026 · model on record in the stance chip above.
Discussion (0). Continue with ORCID to comment.