REVIEW 3 major objections 5 minor 17 references
Generative Augmentation of Raman Spectra for Glioma Classification
T0 review · 3 major / 5 minor · reviewed 2026-07-14 · grok-4.5
Pith's one-line read Synthetic Raman spectra from a small-cohort generative model improve glioma classifiers when mixed with real data, even though pure synthetic training falls short.
desk verdict Careful small-cohort Raman study that honestly shows a large TS/TR domain gap and only tiny, mostly non-significant TSR/TR gains; useful protocol, overstated "consistent" claim. read the letter →
The pith
A machine-rendered reading of the paper's core claim, the machinery that carries it, and where it could break.
The reading
What carries the argument
The beta-CVAE: a 1-D convolutional encoder-decoder whose decoder is conditioned on class labels, trained with a multi-task loss (reconstruction + weighted KL + auxiliary classification) so that sampling from the latent prior yields class-balanced synthetic Raman spectra used for TSR/TR augmentation and for Classification-by-Reconstruction.
What would settle it
Re-run the identical patient-isolated protocol after replacing the manual tumor-spectrum selection with a fully automated, histopathology-validated mask; if the TSR/TR accuracy gains disappear while TR/TR stays the same, the claimed regularization benefit is an artifact of selection bias.
Extended reading notes
Core claim
Even with only 58 independent glioma biopsies, a beta-regularized conditional variational autoencoder can learn enough class-conditioned spectral structure that adding its synthetic outputs to real training data improves downstream IDH-status and methylation-subtype classification under patient-isolated evaluation, while training on synthetic data alone remains inferior because of a clear domain gap.
Load-bearing premise
The heuristic, visually guided pipeline that picks which spectra count as tumor (intensity threshold plus per-slide clustering and manual selection) produces an unbiased set of spectra whose class distributions the generator can safely learn.
Editorial extensions
If this is right
- Synthetic Raman spectra can be used as a regularizer rather than a full replacement for scarce real biopsies.
- Strict patient-isolated evaluation remains mandatory; spectrum-level splits would inflate the apparent gains.
- Reconstruction-error classification offers a generative alternative when discriminative boundaries are unstable.
- The same pipeline can be tried on other small-cohort Raman tasks (e.g., other solid tumors) where multi-class biochemical differences are subtle.
Reading between the lines
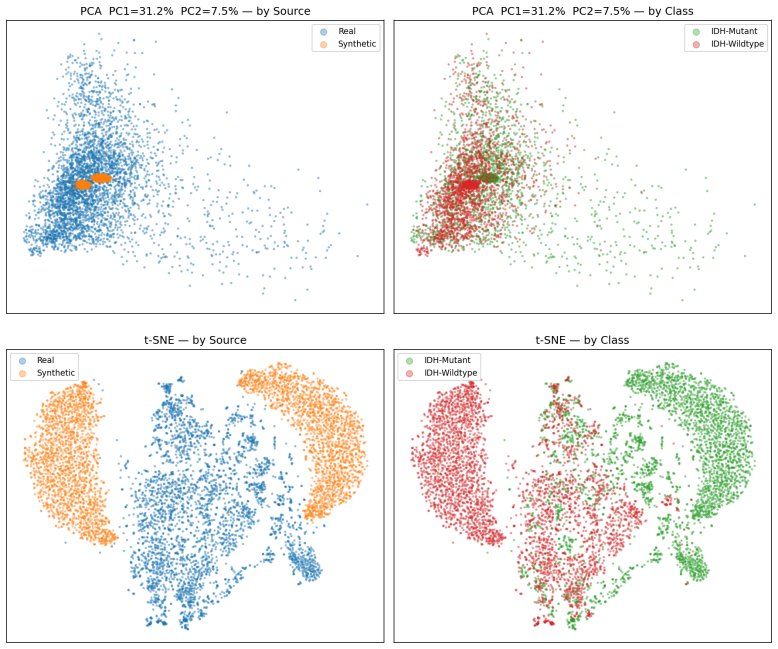
- The observed domain gap (synthetic spectra hug the class mean and under-represent real variance) suggests that future generators may need explicit diversity or noise-matching terms before pure TS/TR becomes viable.
- If the upper bound on accuracy is set by class overlap in the original spectral space, generative augmentation may hit a ceiling that only larger multi-site cohorts can raise.
- CbR’s comparable performance to TS/TR hints that latent reconstruction error could serve as a built-in uncertainty or out-of-distribution detector for clinical Raman systems.
Editorial analysis
A structured set of objections, weighed in public.
Referee Report
Summary. The manuscript studies generative data augmentation for Raman-based glioma classification on a small cohort of 58 biopsy slides. A 1D-convolutional β-CVAE with an auxiliary classification head is trained under slide-isolated 5-fold CV to produce class-conditioned synthetic spectra. These are evaluated in TS/TR and TSR/TR regimes for binary IDH-status and 6-class methylation subtype tasks, using RF+SVM, RF, XGBoost and a 1D-CNN, plus a reconstruction-error inference method (CbR). Pure synthetic training underperforms the real baseline (domain gap), while mixing synthetic with real data yields small positive accuracy deltas for most models. The authors conclude that generative models can still capture enough structure for useful regularization even with limited independent patient samples.
Significance. Data scarcity and acquisition variability are genuine bottlenecks for Raman spectroscopy ML in oncology. The work is carefully designed: strict slide-isolated folds, bootstrap CIs at the slide level, multiple classifiers, and ablations of reconstruction loss, latent dimension and real:synthetic ratio. The explicit documentation of the domain gap and the modest size of the TSR/TR gains is scientifically honest and useful for the community. If the regularization claim holds under tighter statistical control and a less heuristic tumor-spectrum selection pipeline, the paper would provide a practical, reproducible template for generative augmentation in other small-cohort biomedical spectroscopy settings. The CbR idea is a secondary but interesting generative-inference baseline.
major comments (3)
- The central claim that synthetic spectra “consistently improve” classification (Abstract, §5.1, §5.3, Conclusion) is not secured by the reported statistics. Table 2 and Tables A.1–A.11 show that most TSR/TR Δs for RF/XGBoost are +0.00–+0.02 with 95 % CIs that include zero; only occasional larger gains appear for 1D-CNN. The authors themselves note that improvements are “mostly small and not statistically significant” and that no multiple-testing correction was applied (§5.3). With dozens of model×loss×latent×ratio comparisons, uncorrected bootstrap p-values cannot support the adverb “consistently.” Either apply a correction (or a pre-specified primary endpoint) or rephrase the claim to match the evidence (e.g., “small positive trends that rarely reach significance”).
- The load-bearing assumption that the heuristic spatio-spectral pipeline (§3.2, intensity threshold 0.6 + 3-component GMM on NMF coefficients + manual cluster selection per slide, Figs. 2–3) yields an unbiased set of “tumor” spectra is not validated. Retention rates vary widely across slides (Fig. 3). Any class-dependent selection bias would affect both the real baseline and the CVAE training distribution and could reverse the tiny positive TSR/TR deltas. At minimum, report inter-annotator agreement or a sensitivity analysis (different thresholds / automatic cluster selection) showing that the claimed regularization benefit is stable.
- The domain gap (TS/TR Δ ≈ −0.06 to −0.26) is an order of magnitude larger than the claimed regularization benefit. PCA/t-SNE and mean±σ plots (Figs. 5–6) correctly show that synthetic spectra have far lower variance and form tighter class clusters than real data. Without a quantitative fidelity/diversity metric (e.g., MMD, coverage of real spectral modes) it remains unclear whether the small TSR/TR gains arise from genuine regularization or from mild label-smoothing / class-balancing effects that could be obtained by simpler means. A short comparison against classical augmentation (noise, SMOTE, mixup alone) would clarify the added value of the β-CVAE.
minor comments (5)
- Hyper-parameter choices (β=2, α=0.2, γ, d=32, max 500 spectra/slide, 40k/120k synthetic samples) are stated but not systematically justified beyond small ablations; a short sensitivity table or fixed primary configuration would improve reproducibility.
- Appendix B notes that four slides appear in two test folds; the bootstrap procedure should explicitly account for this repeated use so that uncertainty is not understated.
- Notation for the reconstruction loss mixes γ and an undefined “delta” in the appendix table captions; unify with Eq. (2).
- CbR is introduced as model-independent yet its accuracy (≈62 % binary) is only compared narratively to TS/TR; a direct head-to-head table would help.
- Minor typos and formatting: “Ius,an”, “P˘aun”, occasional missing spaces around citations, and the arXiv date line.
Circularity Check
No circularity: purely empirical ML evaluation; performance deltas are measured on held-out real slides, not forced by construction or self-citation.
full rationale
The paper reports an empirical study of β-CVAE synthetic augmentation for Raman glioma spectra under patient-isolated CV. All load-bearing claims (TS/TR domain gap, modest TSR/TR gains, CbR accuracy) are obtained by training generators/classifiers on training folds and scoring on held-out real test slides; none reduce by definition to a fitted parameter or to an input equation. Hyper-parameters (β=2, α=0.2, γ, d=32, max-spectra=500, mixup/shift) are chosen by hand or small ablations and then frozen; the reported accuracies and bootstrap Δs are independent measurements, not tautological. The sole external protocol citation (Lita et al. for the dataset and slide-isolated splits) is non-overlapping authorship and supplies data/protocol, not a uniqueness theorem or ansatz that forces the present results. No self-definitional loops, fitted-input-as-prediction, or renaming of known results appear. The work is therefore self-contained against its own held-out benchmarks; any weakness lies in statistical power/overclaiming of “consistent” gains, not circularity.
Assumptions & free parameters
free parameters (7)
- β (KL weight) =
2
- α (auxiliary classification weight) =
0.2
- γ (MSE vs cosine reconstruction mix) =
varied in ablations
- latent dimension d =
32 (default)
- max spectra per slide =
500
- intensity threshold for signal filtering =
0.6
- synthetic sample counts (40k / 120k) =
40 000 (binary), 120 000 (6-class)
assumptions (4)
- domain assumption Raman spectral differences between IDH-mutant and IDH-wildtype (and among the six methylation subtypes) are large enough to be learnable above acquisition noise and fluorescence background.
- standard math The β-VAE ELBO with the stated multi-task loss yields a latent space from which class-conditional samples can be drawn by z ~ N(0,I).
- ad hoc to paper Slide-level stratified 5-fold splits with manual balancing (each class ≥15 % in every test fold) prevent patient-level leakage while remaining statistically valid.
- ad hoc to paper Visual inspection of GMM clusters after NMF correctly identifies tumor versus background/low-signal spectra without introducing class-dependent selection bias.
invented entities (1)
-
Classification by Reconstruction (CbR)
Cite this review
Pith. "Pith review of Generative Augmentation of Raman Spectra for Glioma Classification." pith.science (2026). https://pith.science/paper/LZH4FSMB
@misc{pith2026260710196,
  author       = {Pith},
  title        = {Pith review of: Generative Augmentation of Raman Spectra for Glioma Classification},
  year         = {2026},
  howpublished = {\url{https://pith.science/paper/LZH4FSMB}},
  note         = {Machine review of arXiv:2607.10196}
}
abstract
Access to sufficiently large biomedical datasets remains a major obstacle for machine learning in Raman spectroscopy-based diagnostics. In particular, for glioma analysis, datasets are typically small and heterogeneous, affected by acquisition-specific variability. This work investigates the utility of deep generative augmentation in such a small-cohort setting. We analyze glioma biopsy spectra acquired from 58 tumor samples and consider both binary IDH-status classification and 6-class methylation subtype classification problems. To address the limited size and imbalance of the dataset, we develop a conditional variational autoencoder ($\beta$-CVAE) capable of generating class-conditioned synthetic Raman spectra. The generated data are evaluated in Train-on-Synthetic, Test-on-Real (TS/TR) and Train-on-Synthetic+Real, Test-on-Real (TSR/TR) settings under a strict patient-isolated cross-validation protocol. Models trained exclusively on synthetic data underperform models trained on real spectra, indicating a substantial domain gap between synthetic and real distributions. However, augmenting the real training data with synthetic spectra consistently improves classification performance across multiple models. These findings indicate that, even with a limited number of independent patient samples, generative models can capture sufficient structure to provide useful regularization for downstream classifiers. We also investigate a reconstruction-based inference strategy, termed Classification by Reconstruction (CbR), in which class prediction is based on reconstruction error under different class conditions. Overall, the results support the use of deep generative augmentation as a practical strategy for improving machine learning robustness in Raman spectroscopy applications characterized by limited biomedical datasets.
Figures


Figures from the paper (3 more)


Reference graph
Works this paper leans on
-
[1]
James J. P. Alix et al. “Non-negative matrix factorisation of Raman spectra finds common patterns relating to neuromuscular disease across differing equipment configurations, preclinical models and human tis- sue”. In:Journal of Raman Spectroscopy54.3 (Dec. 2022), pp. 258–268. issn: 1097-4555.doi:10.1002/jrs.6480
-
[2]
Balancing reconstruction error and Kullback-Leibler divergence in Variational Autoencoders
Andrea Asperti and Matteo Trentin.Balancing reconstruction error and Kullback-Leibler divergence in Variational Autoencoders. 2020.doi: 10.48550/ARXIV.2002.07514
work page Pith review arXiv doi:10.48550/arxiv.2002.07514 2020
-
[3]
Digital medicine and the curse of dimensionality
Visar Berisha et al. “Digital medicine and the curse of dimensionality”. In:npj Digital Medicine4.1 (2021), p. 153.doi:10.1038/s41746-021- 00521-5
-
[4]
Raman based molecular imaging and analytics: a magic bullet for biomedical applications?
Thomas Bocklitz et al. “Raman based molecular imaging and analytics: a magic bullet for biomedical applications?” In:Analyst141.2 (2016), pp. 505–515.doi:10.1039/C5AN01806G. 22
-
[5]
Maximum Likelihood from Incomplete Data Via the ¡i¿EM¡/i¿ Algorithm
A. P. Dempster, N. M. Laird, and D. B. Rubin. “Maximum Likelihood from Incomplete Data Via the ¡i¿EM¡/i¿ Algorithm”. In:Journal of the Royal Statistical Society Series B: Statistical Methodology39.1 (Sept. 1977), pp. 1–22.issn: 1467-9868.doi:10.1111/j.2517-6161.1977. tb01600.x
-
[6]
Real- valued (medical) time series generation with recurrent conditional gans
Crist´ obal Esteban, Stephanie L Hyland, and Gunnar R¨ atsch. “Real- valued (medical) time series generation with recurrent conditional gans”. In:arXiv preprint arXiv:1706.02633(2017)
arXiv 2017
-
[7]
Raman Spectroscopy Spectral Fingerprints of Biomarkers of Traumatic Brain Injury
Georgia Harris et al. “Raman Spectroscopy Spectral Fingerprints of Biomarkers of Traumatic Brain Injury”. In:Cells12.22 (Nov. 2023), p. 2589.issn: 2073-4409.doi:10.3390/cells12222589.url:http: //dx.doi.org/10.3390/cells12222589
-
[8]
beta-VAE: Learning Basic Visual Concepts with a Constrained Variational Framework
Irina Higgins et al. “beta-VAE: Learning Basic Visual Concepts with a Constrained Variational Framework”. In:International Conference on Learning Representations. 2017
2017
Show all 17 references
- [9]
-
[10]
Application of non-negative matrix factorization in oncology
H. Kato et al. “Application of non-negative matrix factorization in oncology”. In:Precision Cancer Medicine5 (2022)
2022
-
[11]
Biomedical ap- plications of Raman and infrared spectroscopy to diagnose tissues
Christoph Krafft, Gerwin Steiner, and Reiner Salzer. “Biomedical ap- plications of Raman and infrared spectroscopy to diagnose tissues”. In: Journal of Physics D: Applied Physics42.18 (2009), p. 183001.doi: 10.1088/0022-3727/42/18/183001
2009 doi
-
[12]
Glioblastoma – A Contemporary Overview of Epidemiology, Classification, Pathogenesis, Diagnosis, and Treatment: A Review Article
K. Kr´ olikowska et al. “Glioblastoma – A Contemporary Overview of Epidemiology, Classification, Pathogenesis, Diagnosis, and Treatment: A Review Article”. In:International Journal of Molecular Sciences 26.24 (2025).doi:10.3390/ijms262412162
2025 doi
-
[13]
Learning the parts of objects by non-negative matrix factorization
Daniel D. Lee and H. Sebastian Seung. “Learning the parts of objects by non-negative matrix factorization”. In:Nature401.6755 (Oct. 1999), pp. 788–791.issn: 1476-4687.doi:10.1038/44565
1999 doi
-
[14]
Raman-based machine learning platform reveals unique metabolic differences between IDHmut and IDHwt glioma
Adrian Lita et al. “Raman-based machine learning platform reveals unique metabolic differences between IDHmut and IDHwt glioma”. In: Neuro-oncology26 (June 2024).doi:10.1093/neuonc/noae101. 23
2024 doi
-
[15]
Raman Spectroscopy in the Diagnosis of Brain Gliomas: A Literature Review
E. V. Stupak et al. “Raman Spectroscopy in the Diagnosis of Brain Gliomas: A Literature Review”. In:Cureus17.2 (2025).doi:10.7759/ cureus.79165
2025
-
[16]
Overfitting in prediction models – is it a problem only in high dimensions?
Jyothi Subramanian and Richard Simon. “Overfitting in prediction models – is it a problem only in high dimensions?” In:Contempo- rary Clinical Trials36.2 (2013), pp. 636–641.issn: 1551-7144.doi: https://doi.org/10.1016/j.cct.2013.06.011
2013 doi
-
[17]
Improving skin cancer detection by Raman spectroscopy using convolutional neural networks and data augmentation
J. Zhao et al. “Improving skin cancer detection by Raman spectroscopy using convolutional neural networks and data augmentation”. In:Fron- tiers in Oncology14 (2024), p. 1320220.doi:10.3389/fonc.2024. 1320220. 24 A Extended Experiment Results This appendix reports the per-expe...
2024 doi
Reviewed July 14, 2026 · model on record in the stance chip above.
Discussion (0). Sign in to comment.