REVIEW 2 major objections 6 minor 36 references
OLinear: A Linear Model for Time Series Forecasting in Orthogonally Transformed Domain
T0 review · 2 major / 6 minor · reviewed 2026-08-15 · deepseek-v4-flash
Pith's one-line read Rotating time series into their own correlation eigenbasis lets a linear model beat transformer forecasters.
desk verdict Solid empirical plug-in results with an overstated theoretical narrative; the decorrelation mechanism doesn't actually apply to the RevIN-normalized inputs. read the letter →
The pith
A machine-rendered reading of the paper's core claim, the machinery that carries it, and where it could break.
The reading
What carries the argument
The load-bearing object is the pair (OrthoTrans, NormLin). OrthoTrans computes the averaged temporal Pearson correlation matrix $\mathrm{CorrMat}_t$ from $T$ lagged copies of each variate, performs the eigenvalue decomposition $\mathrm{CorrMat}_t=Q_i\Lambda Q_i^T$, and multiplies the input by $Q_i^T$ so that $Q_i^T x$ has diagonal covariance; the output-side matrix $Q_o$ maps predictions back to the time domain. NormLin is the linear layer $x\mapsto \mathrm{RowNorm}_{L1}(\mathrm{Softplus}(W))x$, whose positive row-normalized weight matrix mimics the row-stochastic attention matrix of self-attention. Together they carry the argument: OrthoTrans supplies a decorrelated input that a linear encoder can exploit, and NormLin supplies cross-variate dependency modeling that is cheaper, higher-rank, and better conditioned for gradients than softmax attention.
What would settle it
On a held-out series from a different regime than the training window (e.g., a financial index before and after a volatility shift), compute the average absolute off-diagonal entry of $\mathrm{Cov}(Q_i^T x_{\text{test}})$: if it stays large, the decorrelation premise fails and the accuracy gap over time-domain linear models should vanish. For the NormLin claim, rerun the controlled substitution of self-attention with NormLin in a transformer on a new high-variate dataset with all hyperparameters fixed; a failure to match or beat the vanilla MSE would refute the plug-in claim.
Extended reading notes
Core claim
On the paper's own terms, the discovery is that forecasting is easier in a coordinate system that diagonalizes the series' empirical temporal correlation, and that a normalized linear layer captures multivariate dependence at least as well as self-attention. For an input window $x$, the transformation satisfies $\mathrm{Cov}(Q_i^T x)=\Lambda$, so the coordinates entering the model are approximately independent; the paper motivates this with a Gaussian conditional-expectation theorem stating that $\mu_{y|x}=\mu_y+\Sigma_{xy}^T\Sigma_x^{-1}(x-\mu_x)$, where the second term is the entanglement that OrthoTrans removes. NormLin replaces the attention weight computation with $\mathrm{RowNorm}_{L1}(\mathrm{Softplus}(W))x$, preserving attention's positive row-stochastic structure while keeping the weight matrix high-rank and improving gradient flow. The paper's falsifiable core is the controlled-substitution evidence: inserting OrthoTrans into iTransformer, PatchTST, and RLinear, and inserting NormLin into iTransformer, PatchTST, Leddam, Fredformer, and Timer, improves average MSE in nearly every reported setting.
Load-bearing premise
The whole benefit rests on the training-set Pearson correlation matrix being a faithful picture of the dependence that will be faced at test time, so that rotating onto its eigenvectors truly removes the temporal entanglement; real non-stationary series, including financial data, only satisfy this approximately.
Editorial extensions
If this is right
- If the plug-in results hold, any transformer forecaster can swap self-attention for NormLin and expect MSE improvements (6.7% on iTransformer, 10.3% on PatchTST in the reported averages) while cutting FLOPs roughly in half.
- If OrthoTrans generalizes as a module, dataset-specific correlation structure becomes a reusable preprocessing step that improves iTransformer, PatchTST, and even the single-layer RLinear.
- The success of OLinear-C, which fixes NormLin's weights to Softmax(CorrMat_v), implies that much of what the cross-series learner learns is the empirical correlation structure among variates; a cheaper fixed-weight variant nearly matches the learned one.
- Because NormLin improved zero-shot and fine-tuning performance when substituted into the large decoder-only forecaster Timer, linear token-dependency layers may scale to pre-trained time-series foundation models.
- The reported efficiency numbers mean state-of-the-art forecasting can be maintained with a fraction of the compute of transformer baselines.
Reading between the lines
- A natural extension the paper does not test: if a positive row-stochastic interaction matrix is the active ingredient, NormLin could replace attention in other token-mixing settings such as graph or set learning.
- A stress test implied but not run: recompute or shrink $Q_i$ when the test regime's correlation structure shifts, since the paper only varies the amount of training data used to build $Q$.
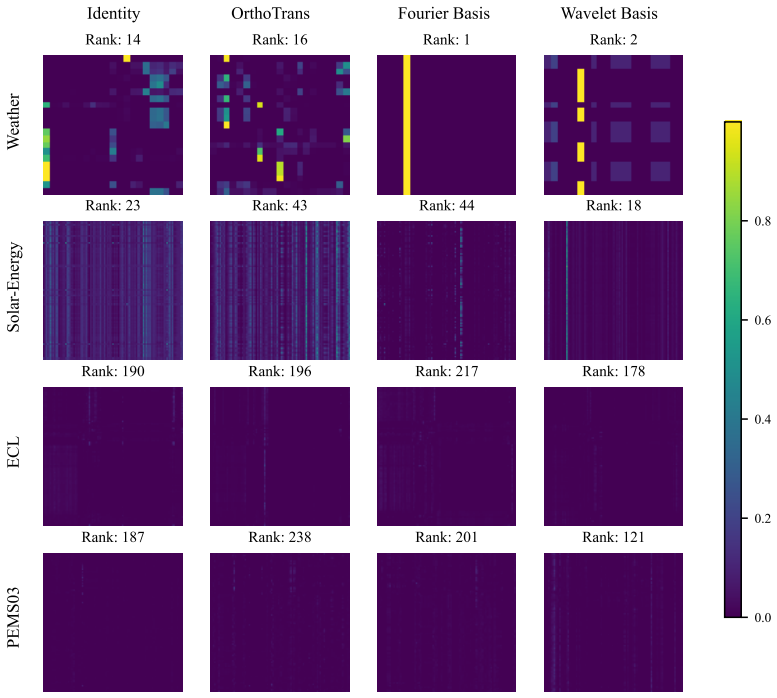
- A hybrid not explored: use OrthoTrans as a data-driven refinement of Fourier or wavelet bases rather than as a replacement, capturing both dataset-specific and generic frequency structure.
- A diagnostic to try: measure the off-diagonal mass of $\mathrm{Cov}(Q_i^T x_{\text{test}})$ as the forecast horizon grows; if decorrelation decays at long horizons, the gains over time-domain linear models should shrink.
Signed reviews
Editorial analysis
A structured set of objections, weighed in public.
Referee Report
Summary. The paper proposes OLinear, a linear multivariate time-series forecaster that operates in an orthogonally transformed domain. The first contribution, OrthoTrans, is a data-adaptive orthogonal transformation obtained from the eigendecomposition of the temporal Pearson correlation matrix of the training series; it is applied to RevIN-normalized inputs and is also proposed as a plug-in module for existing forecasters. The second contribution, NormLin, is a linear layer whose weight matrix is made positive via Softplus and row-wise L1-normalized, used as a cross-series learner and proposed as a drop-in replacement for self-attention in Transformer-based forecasters. The paper reports extensive experiments on 24 benchmarks and 140 forecasting tasks, including long- and short-term forecasting, few-shot and zero-shot evaluation, hyperparameter sensitivity, ablations, and efficiency measurements, and claims consistent state-of-the-art performance plus consistent plug-in improvements from both modules.
Significance. If the plug-in results hold, NormLin is a genuinely interesting finding: a simple normalized linear token-mixer matches or beats multi-head self-attention in the tested forecasting settings at roughly half the compute, and the controlled substitutions in Tables 5, 9, and 10 with unchanged hyperparameters are strong evidence in its favor. The paper also provides full result tables, seed-robustness statistics, FLOP/memory arithmetic that checks out, and an anonymous code repository, which are commendable for reproducibility. The main weakness is that the theoretical mechanism claimed for OrthoTrans is not established for the actual model inputs, and the unqualified 'state-of-the-art' and 'consistently improves' claims are stronger than the presented tables support.
major comments (2)
- [§4.2 and §3] The decorrelation argument for OrthoTrans is not established for the inputs the model actually consumes. The identity Cov(Q_i^T x) = Lambda presumes that x has covariance CorrMat_t and that Q_i^T is applied to x directly, but Eq. (2) applies Q_i^T to Z = (RevINNorm(X) ⊗ phi_d), which is generated from per-window instance-normalized and outer-product-scaled inputs; the covariance of such features need not equal CorrMat_t, so even in-sample the rotation need not diagonalize the features seen by the encoder. In addition, the statement in §4.2 that 'the entries of Q_i^T x are linearly independent, removing sequential dependencies' is not a valid consequence of a diagonal covariance: diagonal covariance gives uncorrelatedness, and statistical independence would require joint Gaussianity, which is not established for these benchmarks. Finally, the Gaussian conditional-expectation theorem in §3 does not by itself convert forecasting into an 'inter-independent feature prediction task,' because after transforming only x, the conditional mean still depends on all transformed coordinates through Sigma_xy^T Q_i. Since OrthoTrans is the paper's first contribution and its gains in Tables 4 and 5 are explained through this mechanism, please either verify empirically that the actual transformed features are near-diagonal on in-sample and held-out windows, or revise the stated mechanism and motivation to what is demonstrated (e.g., the rank-increasing and energy-compaction observations and the empirical plug-in gains).
- [Abstract and §5.1] The claim that OLinear 'consistently achieves state-of-the-art performance' is not supported by the tables as presented. In Table 2, TimeMixer++ has lower average MSE than OLinear on ETT (0.349 vs. 0.359), Traffic (0.416 vs. 0.451), Weather (0.226 vs. 0.237), and Solar-Energy (0.203 vs. 0.215). In Table 3, iTransformer beats OLinear on Website setting S1 (0.179 vs. 0.225 MSE) and DLinear beats OLinear on Unemp (0.565 vs. 0.729 MSE). Similarly, the phrase 'consistently improves' for the plug-in modules is only true on averages: in Table 19, PatchTST with OrthoTrans on PEMS03 at horizon 96 worsens from 0.269 to 0.293 MSE, and in Table 10, Timer zero-shot on Traffic worsens from 0.458 to 0.462 MSE. Please report an aggregate statistic such as mean/median rank across the 140 tasks, or qualify the claims as average improvements rather than consistent per-dataset, per-horizon wins.
minor comments (6)
- [Table 4] The Wavelet1 row reports an ILI (S1) MSE of 0.116, which appears to be a typo for 1.116 as given in Table 18; please correct it.
- [Tables 16–17] The model name is spelled 'OrthoLienar' in the headers of Tables 16 and 17; please fix the typo.
- [Table 24] The entry for Weather H2 is written as '0.204±3-3'; this should presumably be '0.204±3e-3', and other entries should be checked for the same notation error.
- [Appendix I.8] The sentence 'this property also ensures robust performance in few-shot learning scenarios (see Appendix ??)' contains an unresolved cross-reference; please replace it with the actual appendix or remove the pointer.
- [Eq. (2) and Figure 2] The text around Eq. (2) and the caption of Figure 2 contains encoding artifacts (sequences like '/uni00000013/uni00000018/...'); these should be cleaned before publication.
- [§5.3] The word 'consistently' is used repeatedly for NormLin plug-in results (e.g., Abstract and §5.3), but the data in Table 10 show a zero-shot Traffic case with a small degradation (0.458 to 0.462 MSE); please state the claim as average behavior or explicitly note exceptions.
Circularity Check
No circularity: central claims are benchmarked on held-out data via controlled substitutions; self-citations are not load-bearing.
full rationale
The paper's derivation chain is not circular. OrthoTrans constructs Q_i and Q_o from the training set only (Section 4.2: 'Let Xtrain ... denote the training set'), and its benefit is measured on held-out test windows in Tables 4-5, so the transform is not a fitted parameter that is then renamed a prediction. NormLin's weights are trained on the training split and evaluated on test splits; the plug-in gains in Tables 5, 9, and 10 are controlled substitutions of the same vanilla models with only the module changed, so the comparisons are self-contained against external baselines. OLinear-C (Section 5.2, 'we replace the learnable weights in NormLin with the pre-computed Softmax (CorrMatv)') is an ablation showing the learned layer resembles a correlation matrix; it does not make the prediction equal to an input. The self-citations (Yue et al., 2025 Freeformer; Yue et al., 2024 Sub-adjacent transformer) appear only as background mentions of frequency-domain or anomaly-detection work and are not invoked to justify any load-bearing premise; no uniqueness theorem or ansatz is imported from those works. Two non-circular weaknesses are noted for completeness: Section 4.2 states 'the entries of Q_i^T x are linearly independent, removing sequential dependencies,' which is mathematically imprecise because diagonal covariance gives uncorrelatedness, not independence, and the identity is distributional while the model consumes RevIN-normalized per-window inputs; and Appendix I.8 contains a dangling 'see Appendix ??' reference. These are correctness/editorial concerns, not cases where a prediction reduces to its inputs by construction.
Assumptions & free parameters
free parameters (3)
- NormLin weight matrix W =
learned per dataset
- embedding size d =
16
- per-dataset hyperparameters (lr, D, batch size, L) =
lr in {1e-4,2e-4,5e-4}, D in {128,256,512}, batch in {4,8,16,32}, L in {1,2,3}
assumptions (5)
- domain assumption The series are approximately jointly Gaussian, so the conditional-expectation result in Theorem 1 and the decorrelation argument in Section 4.2 apply.
- domain assumption The temporal Pearson correlation matrix computed from the training split is stationary and representative of test-time dependence.
- domain assumption Positive, row-stochastic linear mixing is a sufficient inductive bias for multivariate dependencies.
- standard math Standard linear algebra: symmetric matrices admit real eigendecompositions, and the block matrix inverse (Schur complement) formula holds.
- standard math An orthogonal transform is information-preserving for the downstream linear maps.
Cite this review
Pith. "Pith review of OLinear: A Linear Model for Time Series Forecasting in Orthogonally Transformed Domain." pith.science (2026). https://pith.science/paper/M3SGP2OK
@misc{pith2026250508550,
  author       = {Pith},
  title        = {Pith review of: OLinear: A Linear Model for Time Series Forecasting in Orthogonally Transformed Domain},
  year         = {2026},
  howpublished = {\url{https://pith.science/paper/M3SGP2OK}},
  note         = {Machine review of arXiv:2505.08550}
}
abstract
This paper presents $\mathbf{OLinear}$, a $\mathbf{linear}$-based multivariate time series forecasting model that operates in an $\mathbf{o}$rthogonally transformed domain. Recent forecasting models typically adopt the temporal forecast (TF) paradigm, which directly encode and decode time series in the time domain. However, the entangled step-wise dependencies in series data can hinder the performance of TF. To address this, some forecasters conduct encoding and decoding in the transformed domain using fixed, dataset-independent bases (e.g., sine and cosine signals in the Fourier transform). In contrast, we utilize $\mathbf{OrthoTrans}$, a data-adaptive transformation based on an orthogonal matrix that diagonalizes the series' temporal Pearson correlation matrix. This approach enables more effective encoding and decoding in the decorrelated feature domain and can serve as a plug-in module to enhance existing forecasters. To enhance the representation learning for multivariate time series, we introduce a customized linear layer, $\mathbf{NormLin}$, which employs a normalized weight matrix to capture multivariate dependencies. Empirically, the NormLin module shows a surprising performance advantage over multi-head self-attention, while requiring nearly half the FLOPs. Extensive experiments on 24 benchmarks and 140 forecasting tasks demonstrate that OLinear consistently achieves state-of-the-art performance with high efficiency. Notably, as a plug-in replacement for self-attention, the NormLin module consistently enhances Transformer-based forecasters. The code and datasets are available at https://anonymous.4open.science/r/OLinear
Figures


Figures from the paper (14 more)




Reference graph
Works this paper leans on
-
[2]
Category Linear-Based Transformer-Based TCN-Based Model OLinear (Ours) TimeMixer 2024a FilterNet 2024a FITS 2024 DLinear 2023 TimeMixer++ 2025a Leddam 2024 CARD 2024b Fredformer 2024 iTrans. 2024a PatchTST 2023 TimesNet 2023b Metric MSE MAE MSE MAE MSE MAE MSE MAE MSE MAE MSE MAE MSE MAE MSE MAE MSE MAE MSE MAE MSE MAE MSE MAEETTm1 96 0.302 0.334 0.320 0....
work page 2024
-
[3]
Model OrthoLienar (Ours) TimeMix. 2024a FilterNet 2024a FITS 2024 DLinear 2023 TimeMix.++ 2025a Leddam 2024 CARD 2024b Fredformer 2024 iTrans. 2024a PatchTST 2023 TimesNet 2023b Metric MSE MAE MSE MAE MSE MAE MSE MAE MSE MAE MSE MAE MSE MAE MSE MAE MSE MAE MSE MAE MSE MAE MSE MAEILI 3 0.468 0.349 0.659 0.435 0.660 0.437 1.461 0.743 1.280 0.747 0.658 0.430...
work page 2024
-
[4]
Long-term forecasting with tide: Time-series dense encoder
Abhimanyu Das, Weihao Kong, Andrew Leach, Rajat Sen, and Rose Yu. Long-term forecasting with tide: Time-series dense encoder. arXiv preprint arXiv:2304.08424,
-
[5]
iTransformer 2024a PatchTST 2023 RLinear 2023 Model Vanilla +OrthoTrans Vanilla +OrthoTrans Vanilla +OrthoTrans Metric MSE MAE MSE MAE MSE MAE MSE MAE MSE MAE MSE MAE 96 0.334 0.368 0.334 0.367 0.329 0.367 0.322 0.359 0.355 0.376 0.348 0.366 192 0.377 0.391 0.377 0.389 0.367 0.385 0.363 0.383 0.391 0.392 0.386 0.385 336 0.426 0.420 0.414 0.413 0.399 0.410...
work page 2023
-
[6]
Timer: Transformers for time series analysis at scale
Yong Liu, Haoran Zhang, Chenyu Li, Xiangdong Huang, Jianmin Wang, and Mingsheng Long. Timer: Transformers for time series analysis at scale. In ICML, 2024b. 12 Abdul Fatir Ansari, Lorenzo Stella, Caner Turkmen, Xiyuan Zhang, Pedro Mercado, Huibin Shen, Oleksandr Shchur, Syama Sundar Rangapuram, Sebastian Pineda Arango, Shubham Kapoor, et al. Chronos: Lear...
-
[7]
Standard deviations are calculated over seven random seeds
Dataset ETTm1 ETTm2 ETTh1 ETTh2 ECL Exchange Traffic Metric MSE MAE MSE MAE MSE MAE MSE MAE MSE MAE MSE MAE MSE MAEOLinear 96 0.302 0.334 0.169 0.249 0.360 0.382 0.284 0.329 0.131 0.221 0.082 0.200 0.398 0.226 192 0.357 0.363 0.232 0.290 0.416 0.414 0.360 0.379 0.150 0.238 0.171 0.293 0.439 0.241 336 0.387 0.385 0.291 0.328 0.457 0.438 0.409 0.415 0.165 0...
-
[8]
2017 Reformer 2020 Flowformer 2022 Flashformer 2022 FLatten 2023 Mamba 2023 Lin.Attn
Model OLinear (Ours) Trans. 2017 Reformer 2020 Flowformer 2022 Flashformer 2022 FLatten 2023 Mamba 2023 Lin.Attn. 2024 Enh.Attn. 2025 Metric MSE MAE MSE MAE MSE MAE MSE MAE MSE MAE MSE MAE MSE MAE MSE MAE MSE MAEECL 96 0.131 0.221 0.138 0.226 0.134 0.223 0.135 0.225 0.138 0.227 0.135 0.225 0.142 0.231 0.134 0.222 0.131 0.221 192 0.150 0.238 0.157 0.245 0....
work page 2017
-
[9]
We can observe that the Jacobian matrix is a function of c
Therefore, the Jacobian matrix ∂c ∂a can be written as ∂c ∂a = Diag(c)− ccT, (14) where Diag(c) is the diagonal matrix with c as its diagonal. We can observe that the Jacobian matrix is a function of c. Since the Softmax function could cause sharp value concentration, the Jacobian matrix may exhibit sparsity, with most entries being close to zero [Surya D...
work page 2024
Show all 36 references
-
[11]
• ETT datasets [Zhou et al., 2021] record seven channels related to electricity transformers from July 2016 to July
2021
-
[13]
• Traffic [Wu et al., 2021] includes hourly road occupancy rates from 862 sensors in the Bay Area from January 2015 to December
2021
-
[16]
The block numberL is chosen from{1, 2, 3}
The batch size is selected from {4, 8, 16, 32} depending on the dataset scale. The block numberL is chosen from{1, 2, 3}. Training is performed for up to 50 epochs with early stopping, which halts training if the validation performance does not improve for 10 consecutive epoch...
2019
-
[17]
• METR-LA 2 collects traffic network data in Los Angeles every 5 minutes from March to June
• COVID-19 [Chen et al., 2022] includes daily records of COVID-19 hospitalizations in California in 2020, provided by Johns Hopkins University. • METR-LA 2 collects traffic network data in Los Angeles every 5 minutes from March to June
2022
-
[20]
• DowJones collects daily stock prices of 27 Dow Jones Industrial Average (DJIA) component companies from January 1999 to March
1999
-
[21]
from January 2005 to June
• CarSales collects daily sales of 10 vehicle brands (e.g., Toyota, Honda) in the U.S. from January 2005 to June
2005
-
[22]
• Power contains daily wind and solar energy production (in MW) records for the French grid from April 2020 to June
The data are compiled from the Vehicles Sales dataset 5 on Kaggle. • Power contains daily wind and solar energy production (in MW) records for the French grid from April 2020 to June
2020
-
[23]
• Website 7 contains six years of daily visit data (e.g., first-time and returning visits) to an academic website, spanning from September 2014 to August
The data are compiled from the Wind & Solar Daily Power Production dataset 6 on Kaggle. • Website 7 contains six years of daily visit data (e.g., first-time and returning visits) to an academic website, spanning from September 2014 to August
2014
-
[24]
states and three other territories from January 1976 to March 2020, sourced from the official website of the U.S
1https://gis.cdc.gov/grasp/fluview/fluportaldashboard.html 2https://github.com/liyaguang/DCRNN 3https://www.kaggle.com/datasets/sai14karthik/nasdq-dataset 4https://www.kaggle.com/datasets/sandeshbhat/wikipedia-web-traffic-201819 5https://www.kaggle.com/datasets/crisbam/vehicle...
1976
-
[26]
The low-rank attention matrix could limit the expressive capacity of the model
This phenomenon can be attributed to the sparsity induced by the transformed domain and the sharp focus introduced by the Softmax operation. The low-rank attention matrix could limit the expressive capacity of the model. In contrast, the weight matrices in NormLin exhibit high...
2023
-
[30]
2024a FilterNet 2024a FITS 2024 DLinear 2023 TimeMix.++ 2025a Leddam 2024 CARD 2024b Fredformer 2024 iTrans
Model OrthoLienar (Ours) TimeMix. 2024a FilterNet 2024a FITS 2024 DLinear 2023 TimeMix.++ 2025a Leddam 2024 CARD 2024b Fredformer 2024 iTrans. 2024a PatchTST 2023 TimesNet 2023b Metric MSE MAE MSE MAE MSE MAE MSE MAE MSE MAE MSE MAE MSE MAE MSE MAE MSE MAE MSE MAE MSE MAE MSE ...
2024
-
[34]
Model OLinear (Ours) Leddam 2024 CARD 2024b iTrans. 2024a TimeMixer 2024a Metric R2 (↑) r (↑) MASE (↓) R2 (↑) r (↑) MASE (↓) R2 (↑) r (↑) MASE (↓) R2 (↑) r (↑) MASE (↓) R2 (↑) r (↑) MASE (↓) ECL 96 0.640 0.916 0.902 0.527 0.911 0.964 0.533 0.905 0.975 0.550 0.907 0.990 0.456 0...
2024
-
[35]
‘OL’ refers to OLinear
To ensure a fair comparison, the number of layers (or blocks) is fixed at 2, except for DLinear, which employs only 1 linear layer. ‘OL’ refers to OLinear. ‘OOM’ indicates that the experiment runs out of memory on a 24 GB GPU. Model OL (Ours) OL-C (Ours) Leddam 2024 CARD 2024b...
2024
-
[36]
Model Leddam 2024 iTrans
Notably, in its official implementation, Fredformer employs Nystromformer [Xiong et al., 2021]—an approximate yet more efficient self-attention mechanism—for the ETTm1, ECL, and Weather datasets. Model Leddam 2024 iTrans. 2024a PatchTST 2023 Fredformer 2024 Attn. NormLin Attn....
2021
-
[96]
In total, 140 prediction tasks across various datasets and prediction length settings are evaluated in this work
For short-term forecasting, we adopt two settings: S1 (Input-12, Predict-{3, 6, 9, 12}) and S2 (Input-36, Predict-{24, 36, 48, 60}). In total, 140 prediction tasks across various datasets and prediction length settings are evaluated in this work. Dataset Dim Frequency Total le...
2022
-
[720]
As shown in Table 26, both models consistently achieve state-of-the-art results across different forecasting lengths and datasets, demonstrating their robustness and strong performance. 23 /uni00000035/uni00000044/uni00000051/uni0000004e/uni0000001d/uni00000003/uni0000001a /un...
2020
-
[2010]
• Solar-Energy [Lai et al., 2018] records the solar power output every 10 minutes from 137 photovoltaic plants in
2018
-
[2012]
• NASDAQ 3 includes daily NASDAQ index and key economic indicators (e.g., interest rate and gold price) from 2010 to
A total of 207 channels are included. • NASDAQ 3 includes daily NASDAQ index and key economic indicators (e.g., interest rate and gold price) from 2010 to
2010
-
[2016]
• Exchange [Wu et al., 2021] collects daily exchange rates for eight countries from January 1990 to October
2021
-
[2017]
Revisiting long-term time series forecasting: An investigation on linear mapping
Zhe Li, Shiyi Qi, Yiduo Li, and Zenglin Xu. Revisiting long-term time series forecasting: An investigation on linear mapping. arXiv preprint arXiv:2305.10721,
-
[2018]
• Weather [Wu et al., 2021] contains 21 meteorological variables (e.g., air temperature, humidity) recorded every 10 minutes in
It contains four datasets: ETTh1 and ETTh2, with hourly recordings, and ETTm1 and ETTm2, with 15-minute recordings. • Weather [Wu et al., 2021] contains 21 meteorological variables (e.g., air temperature, humidity) recorded every 10 minutes in
2021
-
[2019]
Language models are few-shot learners
Tom Brown, Benjamin Mann, Nick Ryder, Melanie Subbiah, Jared D Kaplan, Prafulla Dhariwal, Arvind Neelakantan, Pranav Shyam, Girish Sastry, Amanda Askell, et al. Language models are few-shot learners. NIPS, 33:1877–1901,
1901
-
[2020]
• ECL [Wu et al., 2021] records hourly electricity consumption of 321 consumers from July 2016 to July
2021
-
[2021]
For clarity, we denote z ≜ [ x y ] ∈ Rt+1, µz ≜ [ µx µy ] ∈ Rt+1, and Σ ≜ [Σx Σxy ΣT xy σ2 y ]
13 A Proof of Theorem 1 Proof. For clarity, we denote z ≜ [ x y ] ∈ Rt+1, µz ≜ [ µx µy ] ∈ Rt+1, and Σ ≜ [Σx Σxy ΣT xy σ2 y ] . According to the definition, the probability density function of z, i.e, the joint density of x andy, is p(z) =p(x,y ) = 1 (2π)(t+1)/2|Σ|1/2 exp ( −1...
2012
-
[2022]
Mamba: Linear-time sequence modeling with selective state spaces
Albert Gu and Tri Dao. Mamba: Linear-time sequence modeling with selective state spaces. arXiv preprint arXiv:2312.00752,
-
[2023]
Freeformer: Frequency enhanced transformer for multivariate time series forecasting
Wenzhen Yue, Yong Liu, Xianghua Ying, Bowei Xing, Ruohao Guo, and Ji Shi. Freeformer: Frequency enhanced transformer for multivariate time series forecasting. arXiv preprint arXiv:2501.13989,
-
[2024]
The first 99 channels are used in this study
• Wiki 4 records daily page view counts for Wikipedia articles over two years (2018–2019). The first 99 channels are used in this study. • SP500 records daily SP500 index data (e.g., opening price, closing price, and trading volume) from January 1993 to February
2018
-
[2025]
Filternet: Harnessing frequency filters for time series forecasting
Kun Yi, Jingru Fei, Qi Zhang, Hui He, Shufeng Hao, Defu Lian, and Wei Fan. Filternet: Harnessing frequency filters for time series forecasting. Advances in Neural Information Processing Systems, 37:55115–55140, 2024a. Luca Masserano, Abdul Fatir Ansari, Boran Han, Xiyuan Zhang...
Reviewed August 15, 2026 · model on record in the stance chip above.
Discussion (0). Continue with ORCID to comment.