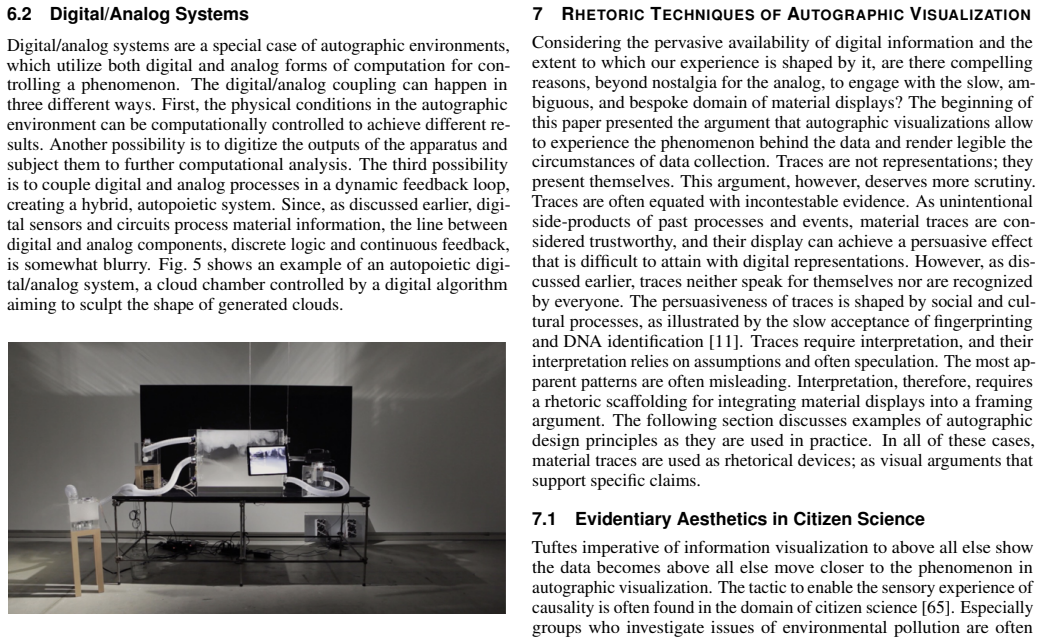
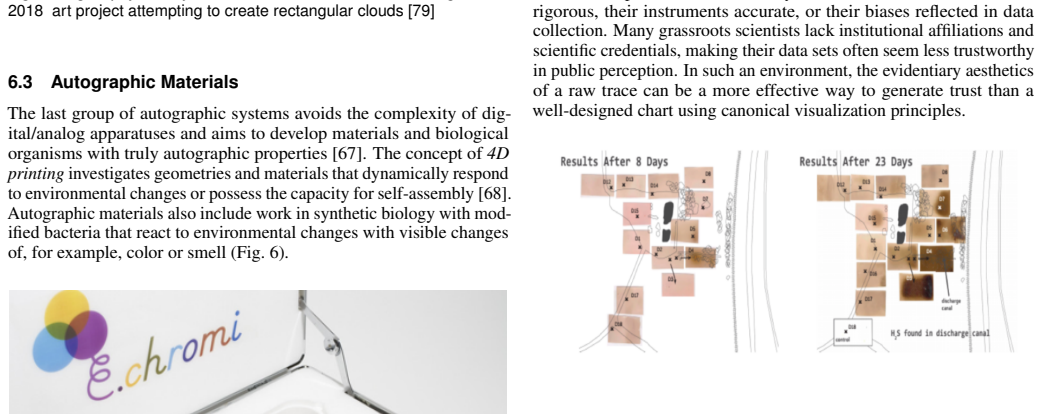
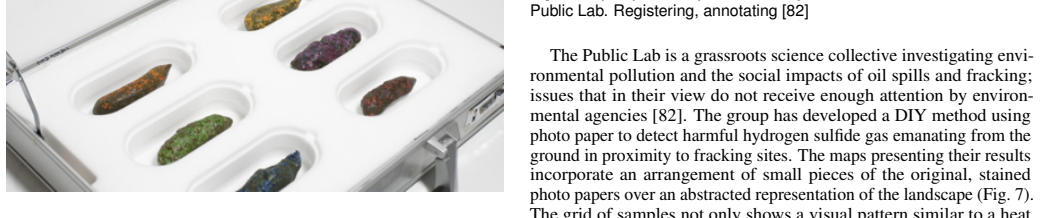
Data by Proxy -- Material Traces as Autographic Visualizations
Pith reviewed 2026-05-24 22:39 UTC · model grok-4.3
The pith
Autographic visualization uses physical traces as data representations to overcome limits of symbolic information visualization.
A machine-rendered reading of the paper's core claim, the machinery that carries it, and where it could break.
Core claim
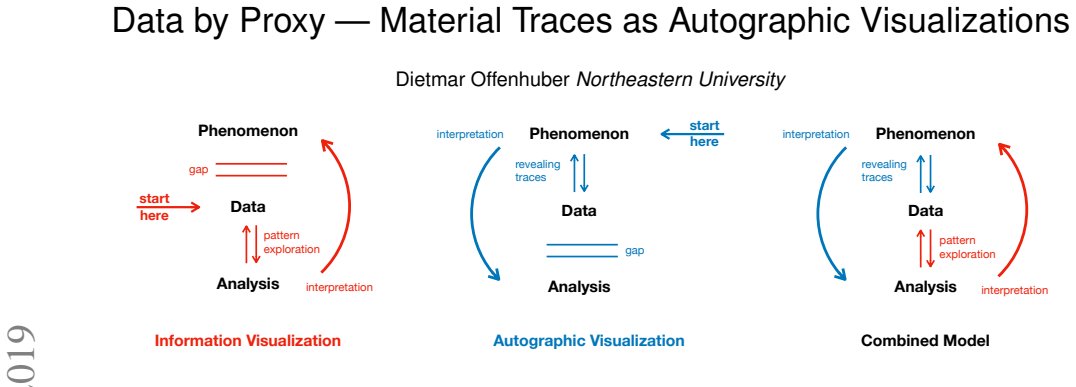
By contrasting information visualization with a speculative counter model of autographic visualization, this paper examines the design principles for material data. Autographic visualization addresses limitations of information visualization, such as the inability to directly reflect the material circumstances of data generation. The comparison between the two models allows probing the epistemic assumptions behind information visualization and uncovers linkages with the rich history of scientific visualization and trace reading.
What carries the argument
Autographic visualization: the treatment of physical traces and material indicators as visualizations without symbolic encoding.
If this is right
- It allows systematic comparison of material data design principles with those of symbolic visualizations.
- It directly reflects the material circumstances of data generation in the representation itself.
- It probes the epistemic assumptions behind information visualization.
- It uncovers linkages with the history of scientific visualization and trace reading.
Where Pith is reading between the lines
- Designers could create hybrid systems that combine physical traces with digital overlays for richer data displays.
- Fields like environmental monitoring might adopt visible material changes as primary data representations.
- Interpretation methods for traces could draw explicit design rules from visualization principles.
Load-bearing premise
Physical traces and material indicators can be systematically treated as visualizations with comparable epistemic value and design principles to symbolic forms.
What would settle it
A controlled user study where participants fail to derive consistent or reliable data insights from physical traces at rates comparable to those from equivalent symbolic visualizations.
Figures
read the original abstract
Information visualization limits itself, per definition, to the domain of symbolic information. This paper discusses arguments why the field should also consider forms of data that are not symbolically encoded, including physical traces and material indicators. Continuing a provocation presented by Pat Hanrahan in his 2004 IEEE Vis capstone address, this paper compares physical traces to visualizations and describes the techniques and visual practices for producing, revealing, and interpreting them. By contrasting information visualization with a speculative counter model of autographic visualization, this paper examines the design principles for material data. Autographic visualization addresses limitations of information visualization, such as the inability to directly reflect the material circumstances of data generation. The comparison between the two models allows probing the epistemic assumptions behind information visualization and uncovers linkages with the rich history of scientific visualization and trace reading.
Editorial analysis
A structured set of objections, weighed in public.
Referee Report
Summary. The paper claims that information visualization, by definition limited to symbolic information, should expand to consider non-symbolically encoded data such as physical traces and material indicators. It continues Pat Hanrahan's 2004 IEEE Vis provocation by comparing these traces to visualizations, outlining techniques for their production, revelation, and interpretation, and contrasting them with a speculative 'autographic visualization' model. This contrast is used to probe epistemic assumptions in information visualization and to highlight historical linkages with scientific visualization and trace-reading practices. The central assertion is that autographic visualization can address limitations such as the inability to directly reflect the material circumstances of data generation.
Significance. If the proposed conceptual framework holds, the paper would contribute by broadening visualization research beyond symbolic forms, potentially enabling new design principles for material data and fostering critical examination of epistemic assumptions. Its value lies in the speculative counter-model and explicit historical contextualization rather than empirical validation or formal derivation; this could stimulate interdisciplinary discussion in HCI and visualization but would depend on subsequent adoption and elaboration by the community.
major comments (1)
- [Abstract / Introduction] The central claim (abstract) that autographic visualization addresses the 'inability to directly reflect the material circumstances of data generation' is load-bearing for the comparison with information visualization, yet the manuscript provides no concrete mechanisms, worked examples, or criteria for when a physical trace qualifies as autographic; this leaves the epistemic contrast underspecified.
minor comments (2)
- The term 'autographic visualization' is introduced as an invented counter-model without an explicit, standalone definition or set of distinguishing properties early in the text; a dedicated subsection would improve clarity for readers.
- Historical linkages to scientific visualization and trace reading are invoked but not tied to specific references or case studies; adding 2-3 canonical citations would strengthen the contextualization without altering the conceptual argument.
Simulated Author's Rebuttal
We thank the referee for their constructive feedback and for recognizing the paper's speculative and historical contributions. We address the single major comment below.
read point-by-point responses
-
Referee: [Abstract / Introduction] The central claim (abstract) that autographic visualization addresses the 'inability to directly reflect the material circumstances of data generation' is load-bearing for the comparison with information visualization, yet the manuscript provides no concrete mechanisms, worked examples, or criteria for when a physical trace qualifies as autographic; this leaves the epistemic contrast underspecified.
Authors: The manuscript does outline techniques for producing, revealing, and interpreting physical traces and grounds the comparison in historical examples from scientific visualization and trace-reading practices. These elements illustrate how material traces can directly index the circumstances of their generation, in contrast to symbolic encoding. We nevertheless agree that the criteria distinguishing autographic from other traces could be stated more explicitly to sharpen the epistemic contrast. We will add a short subsection in the introduction that enumerates these criteria and reference the existing examples more directly to them. revision: partial
Circularity Check
No significant circularity
full rationale
The paper is a conceptual position piece continuing an external 2004 provocation by Hanrahan rather than presenting any derivation chain, equations, fitted parameters, or first-principles results. Its central contrast between information visualization and autographic visualization is framed as an examination of epistemic assumptions and historical linkages, with no self-definitional steps, no predictions that reduce to fitted inputs, and no load-bearing self-citations. The argument remains self-contained against external benchmarks and does not reduce any claim to its own inputs by construction.
Axiom & Free-Parameter Ledger
axioms (1)
- domain assumption Information visualization limits itself, per definition, to the domain of symbolic information.
invented entities (1)
-
autographic visualization
no independent evidence
Reference graph
Works this paper leans on
-
[1]
A. B. Atwan. Islamic State: The Digital Caliphate . Univ of California Press, 9 2015
work page 2015
-
[2]
K. Barad. Meeting the Universe Halfway: Quantum Physics and the Entanglement of Matter and Meaning . Duke University Press Books, Durham, 7 2007
work page 2007
-
[3]
G. Bateson. Steps to an ecology of mind: Collected essays in anthropology, psychiatry, evolution, and epistemology . University of Chicago Press,
-
[4]
[Online; accessed 2015-05-10]
work page 2015
-
[5]
M. Baym, T. D. Lieberman, E. D. Kelsic, R. Chait, R. Gross, I. Yelin, and R. Kishony. Spatiotemporal microbial evolution on antibiotic landscapes. Science, 353(6304):1147–1151, 9 2016. PMID: 27609891
work page 2016
-
[6]
J. Berger. Ways of Seeing. Penguin Books Limited, 9 2008
work page 2008
-
[7]
J. Bertin. Semiology of Graphics: Diagrams, Networks, Maps. University of Wisconsin Press, Madison, Wis, 1983
work page 1983
-
[8]
C. Bissell. Historical perspectives-the moniac a hydromechanical analog computer of the 1950s. 27(1):69–74
-
[9]
H. Bredekamp, V . Dnkel, and B. Schneider.The technical image. Univer- sity of Chicago Press, 2015
work page 2015
-
[10]
S. Card and J. Mackinlay. The structure of the information visualization design space. In Information Visualization, IEEE Symposium on, page 92, Los Alamitos, CA, USA, 1997. IEEE Computer Society
work page 1997
-
[11]
W. S. Cleveland and R. McGill. Graphical perception: The visual decoding of quantitative information on graphical displays of data. Journal of the Royal Statistical Society. Series A (General), 150(3):192, 1987
work page 1987
-
[12]
S. A. Cole. Suspect Identities: A History of Fingerprinting and Criminal Identification. Harvard University Press, Cambridge, MA, 10 2002
work page 2002
-
[13]
C. Coopmans, J. Vertesi, and M. E. Lynch. Representation in Scientific Practice Revisited. MIT Press, 1 2014
work page 2014
-
[14]
L. J. Daston and P. Galison. Objectivity. Zone, New York : Cambridge, Mass, 1 edition, 9 2007
work page 2007
-
[15]
H. B. de Saussure. Description dun cyanomtre ou dun appareil destin a mesurer lintensit de la couleur bleue du ciel. Journ. de Physique, 38(pt 1):199–208, 1791
-
[16]
J. Derrida and G. C. Spivak. Of Grammatology. Johns Hopkins University Press, fortieth-anniversary edition edition, 2016
work page 2016
-
[17]
P. Dourish and M. Mazmanian. Media as material: Information represen- tations as material foundations for organizational practice. How Matter Matters: Objects, Artifacts, and Materiality in Organization Studies, 3:92, 2013
work page 2013
-
[18]
P. N. Edwards. A vast machine: computer models, climate data, and the politics of global warming. MIT Press, 2013. OCLC: 813540927
work page 2013
-
[19]
N. Felton. Photoviz: visualizing information through photography. Gestal- ten. OCLC: 993532265
-
[20]
L. Floridi. The Philosophy of Information. Oxford University Press, 1 2011
work page 2011
-
[21]
J. J. Gibson. The ecological approach to visual perception. Houghton Mifflin, Boston, 1979
work page 1979
-
[22]
A. D. Ginsberg. E-chromi, the scatalog, 2009. [Online; accessed 2019-03- 30]
work page 2009
- [23]
-
[24]
N. Goodman. Language of Art: An Approach to a Theory of Symbols . Hackett, 1968
work page 1968
- [25]
-
[26]
S. Haroz and D. K.-L. Ma. Natural visualizations. In B. S. Santos, T. Ertl, and K. Joy, editors,Eurographics 2006, pages 43–50. Eurographics, Eurographics Association, 2006. [Online; accessed 2019-03-26]
work page 2006
-
[27]
T. H. Huxley. On the method of zadig. 7(40):929–940
-
[28]
H. Ishii and B. Ullmer. Tangible bits: towards seamless interfaces between people, bits and atoms. In Proceedings of the ACM SIGCHI Conference on Human factors in computing systems, pages 234–241. ACM, 1997
work page 1997
-
[29]
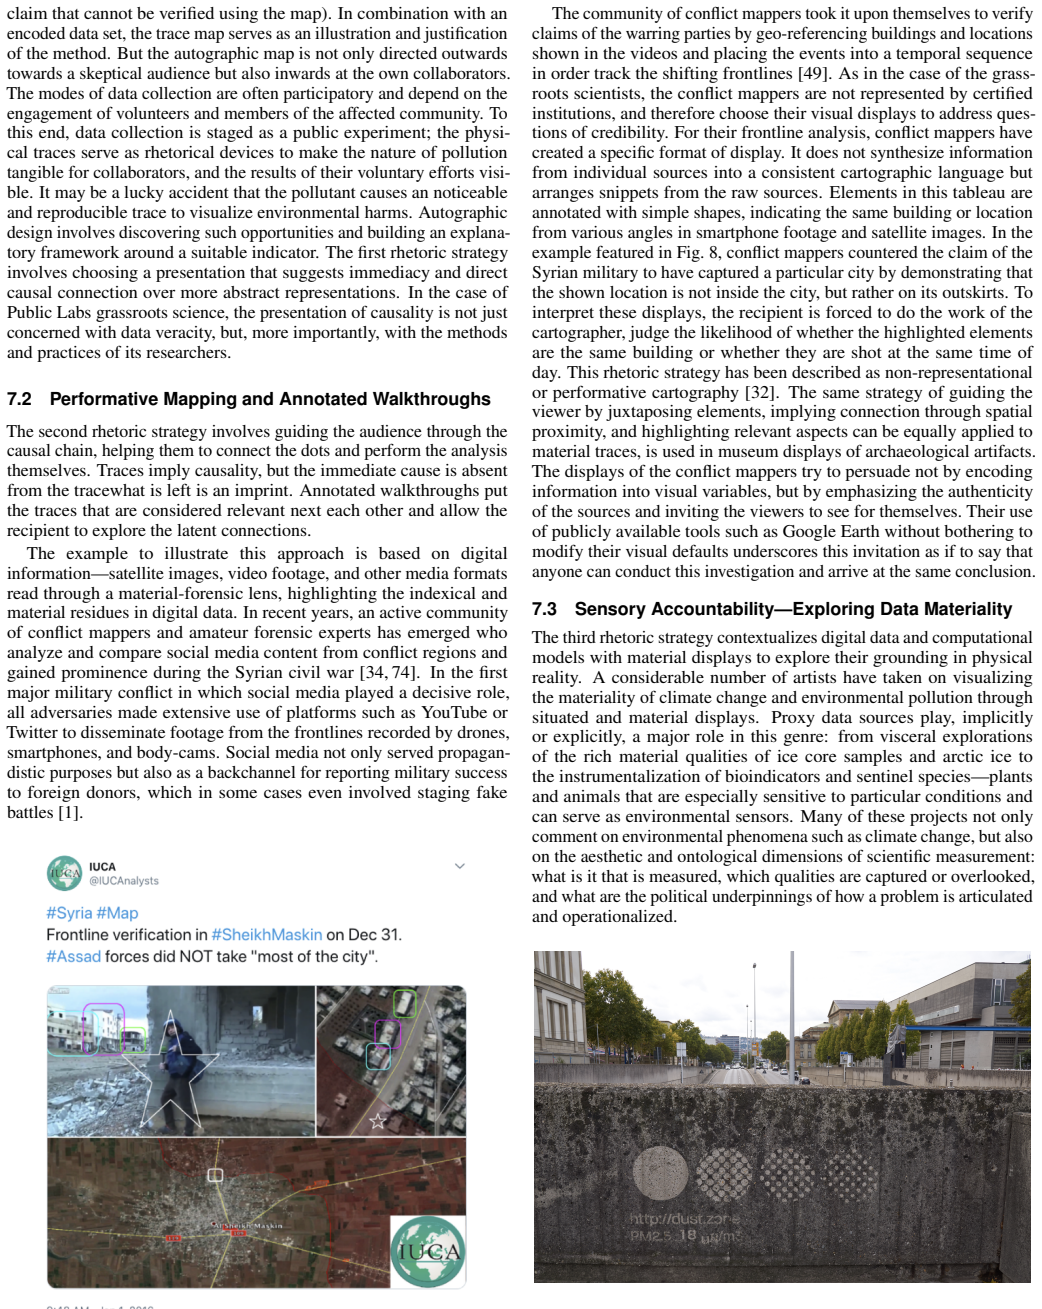
#syria #map frontline verification in #sheikhmaskin on dec 31
IUCA. #syria #map frontline verification in #sheikhmaskin on dec 31. #assad forces did not take ”most of the city”.pic.twitter.com/zip0aiiwej, 1
-
[30]
[Online; accessed 2017-10-19]
work page 2017
- [31]
-
[32]
Y . Jansen, P. Dragicevic, P. Isenberg, J. Alexander, A. Karnik, J. Kildal, S. Subramanian, and K. Hornbk. Opportunities and challenges for data physicalization. In Proceedings of the 33rd Annual ACM Conference on Human Factors in Computing Systems, pages 3227–3236. ACM, 2015
work page 2015
-
[33]
M. G. Kirschenbaum. Mechanisms: New Media and the Forensic Imagi- nation. MIT Press, 1 2008
work page 2008
-
[34]
R. Kitchin and M. Dodge. Rethinking maps. Progress in Human Geogra- phy, 31(3):331–344, 6 2007
work page 2007
- [35]
-
[36]
L. Kurgan. Conflict urbanism, aleppo: Mapping urban damage. Architec- tural Design, 87(1):72–77, 1 2017
work page 2017
-
[37]
S. Kuznetsov, W. Odom, J. Pierce, and E. Paulos. Nurturing natural sensors. In Proceedings of the 13th international conference on Ubiquitous computing, UbiComp ’11, pages 227–236, New York, NY , USA, 2011. ACM. [Online; accessed 2012-12-29]
work page 2011
-
[38]
B. Latour. Visualisation and cognition: Drawing things together. Rep- resentation in Scientific Practice. Ed. Michael Lynch and Steve Woolgar, 1990
work page 1990
-
[39]
B. Latour. Pandora’s Hope: Essays on the Reality of Science Studies . Harvard University Press, 1999
work page 1999
- [40]
-
[41]
D. Lockton, D. Ricketts, S. Aditya Chowdhury, and C. H. Lee. Explor- ing qualitative displays and interfaces. In Proceedings of the 2017 CHI Conference Extended Abstracts on Human Factors in Computing Systems, pages 1844–1852. ACM, 2017
work page 2017
-
[42]
Y . A. Loukissas. Taking big data apart: local readings of composite media collections. Information, Communication & Society, pages 1–14, 7 2016
work page 2016
-
[43]
G. Lupi, S. Posavec, and M. Popova. Dear Data. Princeton Architectural Press, 2016
work page 2016
-
[44]
M. Lynch. Discipline and the material form of images: An analysis of scientific visibility. Social Studies of Science, pages 37–66, 1985
work page 1985
-
[45]
E.-J. Marey. La mthode graphique dans les sciences exprimentales et principalement en physiologie et en mdecine . G. Masson, Paris, 1878. ark:/12148/bpt6k6211376f
-
[46]
S. Mattern. The big data of ice, rocks, soils, and sediments.Places Journal, 11 2017. [Online; accessed 2019-03-01]
work page 2017
-
[47]
A. V . Moere and S. Patel. Analyzing the design approaches of physi- cal data sculptures in a design education context. Visual Information Communications International, 2009. [Online; accessed 2014-12-07]
work page 2009
-
[48]
A. Nieto-Galan. Science in the Public Sphere: A history of lay knowledge and expertise. Routledge, Abingdon, Oxon, 1 edition, 3 2016
work page 2016
-
[49]
A. No. Action in Perception. MIT Press, 2004
work page 2004
-
[50]
D. Offenhuber. Kuleshov’s display: on contextual invisibility. In U. Ekman, editor, Throughout: Art and Culture Emerging with Ubiquitous Computing, pages 431–442. MIT Press, Cambridge, Mass., 2012
work page 2012
-
[51]
D. Offenhuber. Maps of daesh: The cartographic warfare surrounding insurgent statehood. GeoHumanities, 4(1):1–24, 12 2017
work page 2017
- [52]
-
[53]
D. Offenhuber and O. Telhan. Indexical visualization - the data-less information display. In U. Ekman, J. D. Bolter, L. Diaz, M. Sndergaard, and M. Engberg, editors, Ubiquitous Computing, Complexity and Culture, pages 288–303. Routledge, New York, 12 2015
work page 2015
-
[54]
C. S. Peirce. What is a sign? In P. E. Project, editor, The Essential Peirce: Selected Philosophical Writings, Volume 2 (1893-1913). Indiana University Press, Bloomington, IN, 1998
work page 1913
-
[55]
C. S. Peirce, N. Houser, and C. J. W. Kloesel. The Essential Peirce: Selected Philosophical Writings, 1893-1913. Indiana University Press, 6 1998
work page 1913
-
[56]
J. D. Peters. The Marvelous Clouds: Toward a Philosophy of Elemental Media. University of Chicago Press, reprint edition edition, 6 2015
work page 2015
-
[57]
M. Polanyi. Personal Knowledge: towards a post-critical philosophy . CRC Press, 3 1998
work page 1998
-
[58]
H.-J. Rheinberger. Toward a history of epistemic things: synthesizing proteins in the test tube. Stanford University Press, 1997
work page 1997
-
[59]
H.-J. Rheinberger. Infra-experimentality : from traces to data, from data to patterning facts. History of Science, 49(3):337–348, 2011
work page 2011
-
[60]
A. Riegler. Superstition in the machine. In M. V . Butz, O. Sigaud, G. Pezzulo, and G. Baldassarre, editors,Anticipatory Behavior in Adaptive Learning Systems, volume 4520, pages 57–72. Springer
-
[61]
H. Robin. The scientific image : from cave to computer . H.N. Abrams, New York, 1992
work page 1992
-
[62]
A. H. Robinson and B. B. Petchenik. The map as a communication system. The Cartographic Journal, 12:7–15, 1975
work page 1975
- [63]
-
[64]
T. Schofield, M. Drk, and M. Dade-Robertson. Indexicality and visu- alization: exploring analogies with art, cinema and photography. In Proceedings of the 9th ACM Conference on Creativity & Cognition, pages 175–184. ACM, 2013. [Online; accessed 2014-12-07]
work page 2013
-
[65]
B. Shneiderman. The eyes have it: A task by data type taxonomy for information visualizations. In IEEE Symposium on Visual Languages , pages 336–343, 1996. [Online; accessed 2013-08-22]
work page 1996
-
[66]
G. Siegel. Forensic Media: Reconstructing Accidents in Accelerated Modernity. Duke University Press Books, 10 2014
work page 2014
-
[67]
J. Snyder. Vernacular visualization practices in a citizen science project. In Proceedings of the 2017 ACM Conference on Computer Supported Cooperative Work and Social Computing, CSCW ’17, pages 2097–2111, New York, NY , USA, 2017. ACM. event-place: Portland, Oregon, USA
work page 2017
-
[68]
D. E. Struble. Automotive Accident Reconstruction: Practices and Princi- ples. CRC Press, 9 2013
work page 2013
-
[69]
O. Telhan. Designature: The Nature of Signatures in Art and Design . Revolver Publishing, 2016
work page 2016
-
[70]
S. Tibbits. 4d printing: multi-material shape change. Architectural Design, 84(1):116–121, 2014
work page 2014
-
[71]
E. R. Tufte. The Visual Display of Quantitative Information. Graphics Press, Cheshire, Conn., 1983
work page 1983
-
[72]
B. Ulmann. Analog Computing. De Gruyter, Berlin, Boston, 2013. DOI: 10.1524/9783486755183
-
[73]
I. Van der Tuin and R. Dolphijn. New materialism: Interviews & cartogra- phies. Open Humanities Press, 2012. [Online; accessed 2016-12-20]
work page 2012
-
[74]
M. Weiser. The computer for the 21st century. Scientific American, pages 94–104, 9 1991
work page 1991
-
[75]
M. Weiser and J. S. Brown. Designing calm technology. PowerGrid Journal, 1(1):75–85, 1996
work page 1996
-
[76]
E. Weizman. Forensic Architecture: Violence at the Threshold of De- tectability. Zone Books, Brooklyn, NY , 4 2017
work page 2017
-
[77]
G. M. Whitesides. The origins and the future of microfluidics. Nature, 442(7101):368–373, 2006
work page 2006
-
[78]
H. Wickham. A layered grammar of graphics. Journal of Computational and Graphical Statistics, 19(1):3–28, 1 2010
work page 2010
-
[79]
L. Wilkinson and G. Wills. The grammar of graphics . Springer, New York, 2005. [Online; accessed 2013-08-03]
work page 2005
-
[80]
W. Willett, Y . Jansen, and P. Dragicevic. Embedded data representations. IEEE transactions on visualization and computer graphics, 23(1):461–470, 2017
work page 2017
discussion (0)
Sign in with ORCID, Apple, or X to comment. Anyone can read and Pith papers without signing in.