REVIEW 3 major objections 4 minor 87 references
Fair-Count-Min: Frequency Estimation under Equal Group-wise Approximation Factor
T0 review · 3 major / 4 minor · reviewed 2026-08-07 · deepseek-v4-flash
Pith's one-line read Fair-Count-Min, a sketch for streaming frequency estimation, claims to guarantee equal expected approximation factors across element groups while using the same memory and time as Count-Min.
desk verdict The d=1 analysis is correct and worth keeping, but the paper's central d>1 fairness theorem is not proven—it equalizes the wrong quantity. read the letter →
The pith
A machine-rendered reading of the paper's core claim, the machinery that carries it, and where it could break.
The reading
What carries the argument
The central mechanism is column partitioning with group-aware semi-uniform hashing: each element group is confined to its own contiguous block of columns, so collisions only occur within a group. The load-bearing identity is the formula for the expected minimum bucket size across $d$ independent rows, $E[Y]=\sum_{x\ge1}\Pr(X\ge x)^d$ where $X$ is the number of element types hashed into a bucket, and the fairness condition for $d>1$ is obtained by equating this quantity across groups (Equation 8). For $d=1$, the identity reduces to the closed form $E[\alpha_l]=w_l/n_l$, which yields the proportional-allocation rule $w_l = (n_l/n)w$.
What would settle it
Compute, for a synthetic stream with two frequency groups and $d>1$, the $w_l$ solving Equation 8, then directly measure the empirical mean approximation factor $\hat\alpha_l$ and $\hat\alpha_h$. If the means differ by more than sampling noise while the expected minimum bucket sizes are equal, the fairness claim for $d>1$ is falsified.
Extended reading notes
Core claim
The paper claims that fairness in frequency-estimation sketches can be achieved by eliminating inter-group collisions rather than by inflating the sketch. For one hash function, allocating each group a number of columns proportional to its share of element types makes the expected approximation factor equal to $w_l/n_l = w/n$ for every group, and hence identical across groups. For $d>1$ hash rows, the paper derives the expected minimum bucket size $E[Y]$ for a group as $\sum_{x=1}^{n_l} \Pr(X\ge x)^d$ with $X\sim \mathrm{Bin}(n_l, 1/w_l)$, and claims that solving the equality of these quantities between groups (Equation 8) yields a column allocation that makes the expected approximation factors equal. The paper further states that FCM is the first sketch with provable multiplicative (rather than additive) error guarantees, that the price of fairness is negative for $d=1$ under random hashing and zero under uniform hashing, and that experiments confirm fairness with negligible additional error.
Load-bearing premise
The paper assumes, for multiple hash rows, that making the average smallest bucket size the same for every group also makes the average ratio of true to estimated frequency the same, but does not prove that the two are connected.
Editorial extensions
If this is right
- If FCM works as claimed, frequency-estimation sketches can report multiplicative error guarantees instead of additive ones, making estimates for rare items as trustworthy as those for common items.
- The same memory and time complexity as Count-Min means fairness comes without a performance penalty in construction or query cost.
- A negative price of fairness for one-row sketches means separating groups can improve total additive error by reducing bucket-size variance.
- The column-allocation equation offers exact and approximate near-linear-time algorithms for arbitrary numbers of groups.
- The technique applies to any grouping strategy, including demographic attributes and frequency-based partitions, not just binary splits.
Reading between the lines
- The equivalence between equal expected minimum bucket size and equal expected approximation factor is assumed rather than proven for $d>1$; a direct derivation of $E[\alpha]$ in terms of bucket-size distributions would settle whether the column allocation from Equation 8 actually equalizes the target quantity.
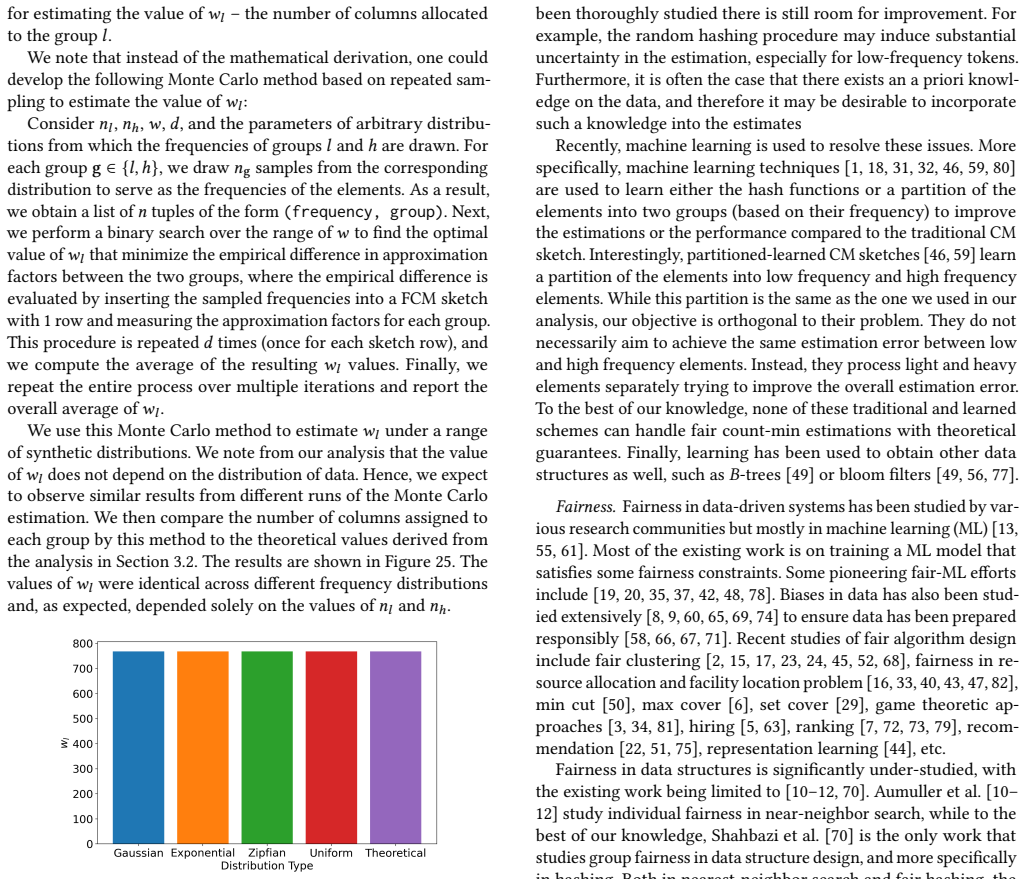
- The Monte Carlo validation in the paper only checks that the column allocation matches the theoretical $w_l$ values, not that the resulting approximation factors are equal; an experiment reporting per-group empirical $E[\alpha]$ for the solved $w_l$ would be a direct test of the fairness guarantee.
- FCM's guarantee is about expectations; worst-case or high-probability fairness bounds for individual elements could be a natural next step if the expectation-level claim holds.
- Because the grouping is arbitrary, the same construction could be used to enforce fairness across any protected attribute, with the price of fairness then depending on how unevenly element types are distributed across groups.
Signed reviews
Editorial analysis
A structured set of objections, weighed in public.
Referee Report
Summary. The paper proposes Fair-Count-Min (FCM), a Count-Min variant that partitions the sketch columns among element groups and uses group-aware semi-uniform hashing so that elements from different groups never collide. It claims that, with a suitable choice of per-group column counts w_l, FCM guarantees equal expected approximation factors E[α] across groups (Definition 2) without increasing the memory or time of a standard Count-Min sketch. For d=1, the paper derives w_l = (n_l/n)w through an exact cancellation. For d>1, it replaces the fairness target by Equation (8), which equalizes the expected minimum bucket cardinality E[Y], and then develops binary-search algorithms for w_l, a price-of-fairness analysis, and experiments on real and synthetic datasets.
Significance. The d=1 analysis is correct, and the accompanying price-of-fairness calculation for d=1 is a clean, parameter-free derivation against a standard Count-Min baseline. The paper also provides reproducible code and extensive experiments. However, the central advertised contribution—the d>1 fairness guarantee—is not derived. The manuscript explicitly substitutes a different quantity, E[Y], for the quantity in Definition 2, E[α], and the two are not equivalent: E[α] depends on the joint distribution of frequencies across the d rows, while E[Y] depends only on bucket cardinalities. Since the general-d fairness guarantee is the main result of the paper, the central claim fails as stated.
major comments (3)
- [Section 3.2, Equation (8)] The derivation changes the target from Definition 2, which requires equal E[α], to equality of E[Y], the expected minimum number of element types in a bucket. The text says, "we simplify our analysis by equalizing the expected number of element types hashed into the minimum-size bucket." This is not a simplification of the same object: for d>1, α(e)=f(e)/min_i C_i(e), where C_i(e) is the total frequency in the bucket of e in row i, so E[α] depends on the frequency distribution and on the joint behavior of the d rows, not only on bucket cardinalities. Equality of E[Y] does not imply equality of E[α]. Concretely, take n_l=n_h=4, w_l=w_h=2, d=2, so Equation (8) holds by symmetry. Let group l have frequencies {1,1,1,1000} and group h have frequencies {100,100,100,100}. In every realization each h element has α≈0.5, while an l element has α near 0.001 when it shares a bucket with the 1000-frequency element in at least one of the two rows, which occurs with probability 3/4. Hence E[α_l] and E[α_h] differ even though Equation (8) is satisfied. The abstract's and Section 1's claim that FCM is provably fair is therefore not established for d>1 and is false as stated.
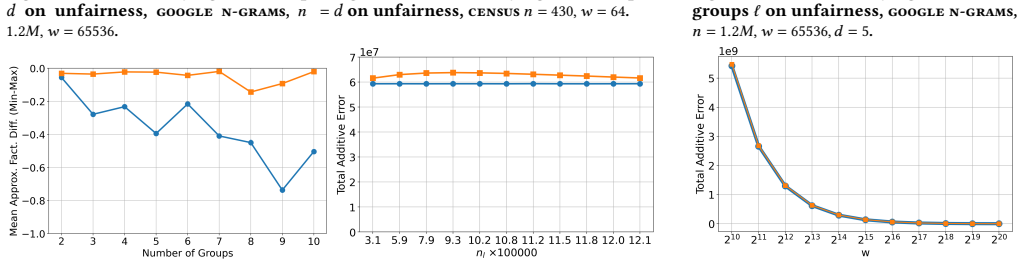
- [Sections 4 and 6.8] The allocation algorithms in Section 4 binary-search for w_l that solves Equation (8), and the validation experiment in Section 6.8 compares the Monte Carlo allocation to the value from Equation (8). Since Equation (8) equalizes E[Y] rather than E[α], these components do not produce or validate a sketch that satisfies Definition 2. The Monte Carlo experiment even reports that the computed w_l is independent of the frequency distribution, which is consistent with the fact that the target is a bucket-cardinality quantity, not an approximation-factor quantity. The unfairness experiments in Section 6.5 measure E[α_l]−E[α_h] and show near-zero values for FCM on the tested instances, but those are empirical observations on particular datasets and frequency distributions; they cannot rescue the general theorem, and the toy counterexample in the previous comment shows that the approach does not provide a worst-case or distribution-free guarantee.
- [Section 3.1, Theorem 1, and the contributions list] Theorem 1 is proved only for d=1, yet the abstract and the contribution list state without qualification that FCM "theoretically proves that FCM is fair, i.e., it ensures an equal expected approximation factor across groups." The only formal result in the paper is the d=1 case; the d>1 case is asserted through the Section 3.2 simplification, which, as noted, targets a different quantity. This mismatch is not merely presentational: it obscures the absence of a proof for the general case. If the intended contribution is restricted to d=1, the paper must say so explicitly; if the intended contribution includes d>1, a proof connecting Equation (8) to Definition 2 is required.
minor comments (4)
- [Section 5.2] The text states "we cannot directly compute PoF = L_CM - L_FCM," but Equation (12) defines PoF = L_FCM - L_CM; the signs in the two places are inconsistent.
- [Section 6.5] The definition of multi-group unfairness says "the difference between the maximum and minimum mean approximation factors across all groups," but the displayed expression is min - max; the order should be max - min.
- [Figure 15 caption] The caption ends with "d=5 2," which appears to be a typographical artifact; it should be simply "d=5."
- [Section 1] The claim that FCM is "the first frequency estimation sketch with provable multiplicative error guarantees" is not supported by the cited literature and is stronger than what is proved; the guarantee is equality of expected approximation factors, not a bounded multiplicative error guarantee in the usual sense.
Circularity Check
No significant circularity: the d=1 derivation is self-contained, the d>1 fairness gap is an unproven equivalence (a soundness issue) rather than a construction-forced conclusion, and the only self-citations are not load-bearing.
full rationale
The paper's central d=1 result is derived algebraically, not assumed. Equation (4) shows that E[alpha_l] = w_l / n_l exactly, and the analogous expression for the high group gives E[alpha_h] = (w - w_l) / (n - n_l); setting these equal yields w_l = n_l w / n. This is a parameter-free calculation using only the definition of the semi-uniform hash partition, with no fitted data and no dependence on any self-citation. The d>1 argument is different: in Section 3.2 the paper writes, 'we simplify our analysis by equalizing the expected number of element types hashed into the minimum-size bucket across d rows for all groups,' and then Equation (8) equalizes E[Y] rather than the actual fairness objective E[alpha]. This is an unproven and in general false equivalence, but it is not circularity within the meaning of this review: the paper does not define fairness as E[Y] equality, and it does not force the conclusion by normalization or by citing itself. A failed implication is a soundness/correctness defect, not a reduction of the prediction to its own inputs. The self-citations in the paper, such as the related-work reference to Fairhash [70], support novelty claims and are not load-bearing for the sketch's derivation. The Monte Carlo experiment in Section 6.8 checks the theoretical allocation rather than supplying a fitted parameter that is later renamed as a prediction. I therefore find no circular step and assign score 0.
Assumptions & free parameters
assumptions (2)
- domain assumption Row hashes are independent and uniform within each group's allocated columns.
- ad hoc to paper Equalizing expected minimum bucket sizes across groups is equivalent to equalizing expected approximation factors.
Cite this review
Pith. "Pith review of Fair-Count-Min: Frequency Estimation under Equal Group-wise Approximation Factor." pith.science (2026). https://pith.science/paper/MLWCTZCC
@misc{pith2026250518919,
  author       = {Pith},
  title        = {Pith review of: Fair-Count-Min: Frequency Estimation under Equal Group-wise Approximation Factor},
  year         = {2026},
  howpublished = {\url{https://pith.science/paper/MLWCTZCC}},
  note         = {Machine review of arXiv:2505.18919}
}
read the original abstract
Frequency estimation in streaming data often relies on sketches like Count-Min (CM) to provide approximate answers with sublinear space. However, CM sketches introduce additive errors that disproportionately impact low-frequency elements, creating fairness concerns across different groups of elements. We introduce Fair-Count-Min, a frequency estimation sketch that guarantees equal expected approximation factors across element groups, thus addressing the unfairness issue. We propose a column partitioning approach with group-aware semi-uniform hashing to eliminate collisions between elements from different groups. We provide theoretical guarantees for fairness, analyze the price of fairness, and validate our theoretical findings through extensive experiments on real-world and synthetic datasets. Our experimental results show that Fair-Count-Min achieves fairness with minimal additional error and maintains competitive efficiency compared to standard CM sketches.
Figures


Figures from the paper (30 more)






Reference graph
Works this paper leans on
-
[1]
Anders Aamand, Piotr Indyk, and Ali Vakilian. 2019. frequency estimation algorithms under Zipfian distribution.arXiv preprint arXiv:1908.05198(2019)
work page Pith review arXiv 2019
-
[2]
Sara Ahmadian, Alessandro Epasto, Marina Knittel, Ravi Kumar, Mohammad Mahdian, Benjamin Moseley, Philip Pham, Sergei Vassilvitskii, and Yuyan Wang
-
[3]
Encarnación Algaba, Vito Fragnelli, and Joaquín Sánchez-Soriano. 2019. The Shapley value, a paradigm of fairness.Handbook of the Shapley value(2019), 17–29
2019
-
[4]
Noga Alon, Yossi Matias, and Mario Szegedy. 1996. The space complexity of approximating the frequency moments. InProceedings of the twenty-eighth annual ACM symposium on Theory of computing. 20–29
1996
-
[5]
Mohammad Reza Aminian, Vahideh Manshadi, and Rad Niazadeh. 2023. Fair markovian search.A vailable at SSRN 4347447(2023)
2023
-
[6]
Abolfazl Asudeh, Tanya Berger-Wolf, Bhaskar DasGupta, and Anastasios Sidiropoulos. 2023. Maximizing coverage while ensuring fairness: A tale of conflicting objectives.Algorithmica85, 5 (2023), 1287–1331
2023
-
[7]
Abolfazl Asudeh, HV Jagadish, Julia Stoyanovich, and Gautam Das. 2019. De- signing fair ranking schemes. InProceedings of the 2019 international conference on management of data. 1259–1276
2019
-
[8]
Abolfazl Asudeh, Zhongjun Jin, and HV Jagadish. 2019. Assessing and remedying coverage for a given dataset. In2019 IEEE 35th International Conference on Data Engineering (ICDE). IEEE, 554–565
work page 2019
Show all 87 references
-
[9]
Abolfazl Asudeh, Nima Shahbazi, Zhongjun Jin, and HV Jagadish. 2021. Iden- tifying insufficient data coverage for ordinal continuous-valued attributes. In Proceedings of the 2021 international conference on management of data. 129–141
2021
-
[10]
Martin Aumuller, Sariel Har-Peled, Sepideh Mahabadi, Rasmus Pagh, and Francesco Silvestri. 2021. Fair near neighbor search via sampling.ACM SIGMOD Record50, 1 (2021), 42–49
2021
-
[11]
Martin Aumüller, Sariel Har-Peled, Sepideh Mahabadi, Rasmus Pagh, and Francesco Silvestri. 2022. Sampling a Near Neighbor in High Dimensions—Who is the Fairest of Them All?ACM Transactions on Database Systems (TODS)47, 1 (2022), 1–40
2022
-
[12]
Martin Aumüller, Rasmus Pagh, and Francesco Silvestri. 2020. Fair near neighbor search: Independent range sampling in high dimensions. InProceedings of the 39th ACM SIGMOD-SIGACT-SIGAI Symposium on Principles of Database Systems (PODS). 191–204
2020
-
[13]
Solon Barocas, Moritz Hardt, and Arvind Narayanan. 2017. Fairness in machine learning.Nips tutorial1 (2017), 2017
2017
-
[14]
2023.Fairness and machine learning: Limitations and opportunities
Solon Barocas, Moritz Hardt, and Arvind Narayanan. 2023.Fairness and machine learning: Limitations and opportunities. MIT press
2023
-
[15]
Suman Bera, Deeparnab Chakrabarty, Nicolas Flores, and Maryam Negahbani
-
[16]
Víctor Blanco and Ricardo Gázquez. 2023. Fairness in maximal covering location problems.Computers & Operations Research157 (2023), 106287
2023
-
[17]
Matteo Böhm, Adriano Fazzone, Stefano Leonardi, and Chris Schwiegelshohn
-
[18]
Diana Cai, Michael Mitzenmacher, and Ryan P Adams. 2018. A Bayesian non- parametric view on count-min sketch.Advances in neural information processing systems31 (2018)
2018
-
[19]
Flavio Calmon, Dennis Wei, Bhanukiran Vinzamuri, Karthikeyan Natesan Rama- murthy, and Kush R Varshney. 2017. Optimized pre-processing for discrimination prevention.Advances in neural information processing systems30 (2017)
2017
-
[20]
Fair clustering with multiple colors.arXiv preprint arXiv:2002.07892(2020)
2020 arXiv
-
[21]
Moses Charikar, Kevin Chen, and Martin Farach-Colton. 2002. Finding frequent items in data streams. InInternational colloquium on automata, languages, and programming. Springer, 693–703
2002
-
[22]
Jiawei Chen, Hande Dong, Xiang Wang, Fuli Feng, Meng Wang, and Xiangnan He. 2023. Bias and debias in recommender system: A survey and future directions. ACM Transactions on Information Systems41, 3 (2023), 1–39
2023
-
[23]
L Elisa Celis, Lingxiao Huang, Vijay Keswani, and Nisheeth K Vishnoi. 2019. Classification with fairness constraints: A meta-algorithm with provable guaran- tees. InProceedings of the conference on fairness, accountability, and transparency. 319–328
2019
-
[24]
Eden Chlamtáč, Yury Makarychev, and Ali Vakilian. 2022. Approximating fair clustering with cascaded norm objectives. InProceedings of the 2022 annual ACM-SIAM symposium on discrete algorithms (SODA). SIAM, 2664–2683
2022
-
[25]
Saar Cohen and Yossi Matias. 2003. Spectral bloom filters. InProceedings of the 2003 ACM SIGMOD international conference on Management of data. 241–252
2003
-
[26]
Flavio Chierichetti, Ravi Kumar, Silvio Lattanzi, and Sergei Vassilvitskii. 2017. Fair clustering through fairlets.Advances in neural information processing systems 30 (2017)
2017
-
[27]
Graham Cormode and Shan Muthukrishnan. 2005. An improved data stream summary: the count-min sketch and its applications.Journal of Algorithms55, 1 (2005), 58–75
2005
-
[28]
2020.Small summaries for big data
Graham Cormode and Ke Yi. 2020.Small summaries for big data. Cambridge University Press
2020
-
[29]
2009.Count-Min Sketch
Graham Cormode. 2009.Count-Min Sketch. Springer US, 511–516. https: //doi.org/10.1007/978-0-387-39940-9_87
2009 doi
-
[30]
Fan Deng and Davood Rafiei. 2007. New estimation algorithms for streaming data: Count-min can do more.Webdocs. Cs. Ualberta. Ca(2007)
2007
-
[31]
Emanuele Dolera, Stefano Favaro, and Stefano Peluchetti. 2021. A Bayesian nonparametric approach to count-min sketch under power-law data streams. In International Conference on Artificial Intelligence and Statistics. PMLR, 226–234
2021
-
[32]
Mohsen Dehghankar, Rahul Raychaudhury, Stavros Sintos, and Abolfazl Asudeh
-
[33]
Kate Donahue and Jon Kleinberg. 2020. Fairness and utilization in allocating resources with uncertain demand. InProceedings of the 2020 conference on fairness, accountability, and transparency. 658–668
2020
-
[34]
Kate Donahue and Jon Kleinberg. 2023. Fairness in model-sharing games. In Proceedings of the ACM Web Conference 2023. 3775–3783
2023
-
[35]
Cynthia Dwork, Moritz Hardt, Toniann Pitassi, Omer Reingold, and Richard Zemel. 2012. Fairness through awareness. InProceedings of the 3rd innovations in theoretical computer science conference. ACM, 214–226
2012
-
[36]
Emanuele Dolera, Stefano Favaro, and Stefano Peluchetti. 2023. Learning- augmented count-min sketches via Bayesian nonparametrics.Journal of Machine Learning Research24, 12 (2023), 1–60
2023
-
[37]
Michael Feldman, Sorelle A Friedler, John Moeller, Carlos Scheidegger, and Suresh Venkatasubramanian. 2015. Certifying and removing disparate impact. InProceedings of the 21th ACM SIGKDD International Conference on Knowledge Discovery and Data Mining. ACM, 259–268
2015
-
[38]
1991.An introduction to probability theory and its applications, Volume 2
William Feller. 1991.An introduction to probability theory and its applications, Volume 2. Vol. 2. John Wiley & Sons
1991
-
[39]
Éric Fusy and Gregory Kucherov. 2023. Count-min sketch with variable number of hash functions: an experimental study. InInternational Symposium on String Processing and Information Retrieval. Springer, 218–232
2023
-
[40]
Li Fan, Pei Cao, Jussara Almeida, and Andrei Z Broder. 2000. Summary cache: a scalable wide-area web cache sharing protocol.IEEE/ACM transactions on networking8, 3 (2000), 281–293
2000
-
[41]
Deke Guo, Yunhao Liu, Xiangyang Li, and Panlong Yang. 2010. False negative problem of counting bloom filter.IEEE transactions on knowledge and data engineering22, 5 (2010), 651–664
2010
-
[42]
Moritz Hardt, Eric Price, and Nati Srebro. 2016. Equality of opportunity in supervised learning. InAdvances in neural information processing systems. 3315– 3323
2016
-
[43]
Yuzi He, Keith Burghardt, Siyi Guo, and Kristina Lerman. 2020. Inherent trade- offs in the fair allocation of treatments.arXiv preprint arXiv:2010.16409(2020)
2020 arXiv
-
[44]
Pranay Gorantla, Kunal Marwaha, and Santhoshini Velusamy. 2023. Fair al- location of a multiset of indivisible items. InProceedings of the 2023 Annual ACM-SIAM Symposium on Discrete Algorithms (SODA). SIAM, 304–331
2023
-
[45]
Sedjro Salomon Hotegni, Sepideh Mahabadi, and Ali Vakilian. 2023. Approx- imation Algorithms for Fair Range Clustering. InInternational Conference on Machine Learning. PMLR, 13270–13284
2023
-
[46]
Chen-Yu Hsu, Piotr Indyk, Dina Katabi, and Ali Vakilian. 2019. Learning-based frequency estimation algorithms.. InInternational Conference on Learning Repre- sentations
2019
-
[47]
Yanmin Jiang, Xiaole Wu, Bo Chen, and Qiying Hu. 2021. Rawlsian fairness in push and pull supply chains.European Journal of Operational Research291, 1 (2021), 194–205
2021
-
[48]
Yuzi He, Keith Burghardt, and Kristina Lerman. 2020. A geometric solution to fair representations. InProceedings of the AAAI/ACM Conference on AI, Ethics, and Society. 279–285
2020
-
[49]
Tim Kraska, Alex Beutel, Ed H Chi, Jeffrey Dean, and Neoklis Polyzotis. 2018. The case for learned index structures. InProceedings of the 2018 international conference on management of data. 489–504
2018
-
[50]
Jason Li, Danupon Nanongkai, Debmalya Panigrahi, and Thatchaphol Saranurak
-
[51]
Yunqi Li, Hanxiong Chen, Shuyuan Xu, Yingqiang Ge, Juntao Tan, Shuchang Liu, and Yongfeng Zhang. 2022. Fairness in recommendation: A survey.arXiv preprint arXiv:2205.13619(2022)
2022 arXiv
-
[52]
Faisal Kamiran and Toon Calders. 2012. Data preprocessing techniques for classification without discrimination.Knowledge and Information Systems33, 1 (2012), 1–33
2012
-
[53]
Younes Ben Mazziane, Sara Alouf, and Giovanni Neglia. 2022. Analyzing count min sketch with conservative updates.Computer Networks217 (2022), 109315
2022
-
[54]
Younes Ben Mazziane and Othmane Marfoq. 2024. Count-Min Sketch with Conservative Updates: Worst-Case Analysis.arXiv preprint arXiv:2405.12034 (2024)
2024 arXiv
-
[55]
Ninareh Mehrabi, Fred Morstatter, Nripsuta Saxena, Kristina Lerman, and Aram Galstyan. 2021. A survey on bias and fairness in machine learning.ACM computing surveys (CSUR)54, 6 (2021), 1–35. 13
2021
-
[56]
Michael Mitzenmacher. 2018. A model for learned bloom filters and optimizing by sandwiching.Advances in Neural Information Processing Systems31 (2018)
2018
-
[57]
Yury Makarychev and Ali Vakilian. 2021. Approximation algorithms for socially fair clustering. InConference on Learning Theory. PMLR, 3246–3264
2021
-
[58]
Fatemeh Nargesian, Abolfazl Asudeh, and HV Jagadish. 2021. Tailoring data source distributions for fairness-aware data integration.Proceedings of the VLDB Endowment14, 11 (2021), 2519–2532
2021
-
[59]
Thuy Trang Nguyen and Cameron N Musco. [n. d.]. Partitioned-Learned Count- Min Sketch. ([n. d.])
-
[60]
Alexandra Olteanu, Carlos Castillo, Fernando Diaz, and Emre Kıcıman. 2019. Social data: Biases, methodological pitfalls, and ethical boundaries.Frontiers in big data2 (2019), 13
2019
-
[61]
Dana Pessach and Erez Shmueli. 2022. A review on fairness in machine learning. ACM Computing Surveys (CSUR)55, 3 (2022), 1–44
2022
-
[62]
Rajeev Motwani and Prabhakar Raghavan. 1996. Randomized algorithms.ACM Computing Surveys (CSUR)28, 1 (1996), 33–37
1996
-
[63]
Manish Raghavan, Solon Barocas, Jon Kleinberg, and Karen Levy. 2020. Mitigat- ing bias in algorithmic hiring: Evaluating claims and practices. InProceedings of the 2020 conference on fairness, accountability, and transparency. 469–481
2020
-
[64]
Ori Rottenstreich, Pedro Reviriego, Ely Porat, and S Muthukrishnan. 2021. Avoid- ing flow size overestimation in Count-Min sketch with Bloom filter constructions. IEEE Transactions on Network and Service Management18, 3 (2021), 3662–3676
2021
-
[65]
Babak Salimi, Bill Howe, and Dan Suciu. 2019. Data management for causal algorithmic fairness.arXiv preprint arXiv:1908.07924(2019)
2019 arXiv
-
[66]
Babak Salimi, Bill Howe, and Dan Suciu. 2020. Database repair meets algorithmic fairness.ACM SIGMOD Record49, 1 (2020), 34–41
2020
-
[67]
Guillaume Pitel and Geoffroy Fouquier. 2015. Count-Min-Log sketch: Approxi- mately counting with approximate counters. InInternational Symposium on Web AlGorithms
2015
-
[68]
Melanie Schmidt, Chris Schwiegelshohn, and Christian Sohler. 2020. Fair coresets and streaming algorithms for fair k-means. InApproximation and Online Algo- rithms: 17th International Workshop, W AOA 2019, Munich, Germany, September 12–13, 2019, Revised Selected Papers 17. Spr...
2020
-
[69]
Nima Shahbazi, Yin Lin, Abolfazl Asudeh, and HV Jagadish. 2023. Representation Bias in Data: A Survey on Identification and Resolution Techniques.Comput. Surveys(2023)
2023
-
[70]
Nima Shahbazi, Stavros Sintos, and Abolfazl Asudeh. 2024. Fairhash: A fair and memory/time-efficient hashmap.Proceedings of the ACM on Management of Data 2, 3 (2024), 1–29
2024
-
[71]
Suraj Shetiya, Ian P Swift, Abolfazl Asudeh, and Gautam Das. 2022. Fairness- aware range queries for selecting unbiased data. InICDE. IEEE, 1423–1436
2022
-
[72]
Babak Salimi, Luke Rodriguez, Bill Howe, and Dan Suciu. 2019. Interventional fairness: Causal database repair for algorithmic fairness. InProceedings of the 2019 International Conference on Management of Data. 793–810
2019
-
[73]
Ashudeep Singh and Thorsten Joachims. 2019. Policy learning for fairness in ranking.Advances in neural information processing systems32 (2019)
2019
-
[74]
Julia Stoyanovich, Serge Abiteboul, Bill Howe, HV Jagadish, and Sebastian Schel- ter. 2022. Responsible data management.Commun. ACM65, 6 (2022), 64–74
2022
-
[75]
Ian P Swift, Sana Ebrahimi, Azade Nova, and Abolfazl Asudeh. 2022. Maximizing fair content spread via edge suggestion in social networks.Proceedings of the VLDB Endowment15, 11 (2022), 2692–2705
2022
-
[76]
Daniel Ting. 2018. Count-min: Optimal estimation and tight error bounds using empirical error distributions. InProceedings of the 24th ACM SIGKDD International Conference on Knowledge Discovery & Data Mining. 2319–2328
2018
-
[77]
Ashudeep Singh and Thorsten Joachims. 2018. Fairness of exposure in rankings. InProceedings of the 24th ACM SIGKDD international conference on knowledge discovery & data mining. 2219–2228
2018
-
[78]
Muhammad Bilal Zafar, Isabel Valera, Manuel Gomez Rodriguez, and Krishna P Gummadi. 2017. Fairness beyond disparate treatment & disparate impact: Learn- ing classification without disparate mistreatment. InProceedings of the 26th International Conference on World Wide Web. Int...
2017
-
[79]
Meike Zehlike, Ke Yang, and Julia Stoyanovich. 2022. Fairness in ranking, part i: Score-based ranking.Comput. Surveys55, 6 (2022), 1–36
2022
-
[80]
Meifan Zhang, Hongzhi Wang, Jianzhong Li, and Hong Gao. 2020. Learned sketches for frequency estimation.Information Sciences507 (2020), 365–385
2020
-
[81]
Yan Zhao, Kai Zheng, Jiannan Guo, Bin Yang, Torben Bach Pedersen, and Chris- tian S Jensen. 2021. Fairness-aware task assignment in spatial crowdsourcing: Game-theoretic approaches. In2021 IEEE 37th International Conference on Data Engineering (ICDE). IEEE, 265–276
2021
-
[82]
Kapil Vaidya, Eric Knorr, Michael Mitzenmacher, and Tim Kraska. 2020. Parti- tioned Learned Bloom Filters. InInternational Conference on Learning Represen- tations
2020
-
[87]
Liping Zhou, Na Geng, Zhibin Jiang, and Xiuxian Wang. 2019. Public hospi- tal inpatient room allocation and patient scheduling considering equity.IEEE Transactions on Automation Science and Engineering17, 3 (2019), 1124–1139. APPENDIX A PRICE OF FAIRNESS: RANDOMNESS VS. UNIFOR...
2019
-
[2019]
Fair algorithms for clustering.Advances in Neural Information Processing Systems32 (2019)
2019
-
[2020]
Fair hierarchical clustering.Advances in Neural Information Processing Systems33 (2020), 21050–21060
2020
-
[2023]
In Proceedings of the 2023 Annual ACM-SIAM Symposium on Discrete Algorithms (SODA)
Near-Linear Time Approximations for Cut Problems via Fair Cuts. In Proceedings of the 2023 Annual ACM-SIAM Symposium on Discrete Algorithms (SODA). SIAM, 240–275
2023
-
[2025]
Fair Set Cover.KDD(2025)
2025
Reviewed August 7, 2026 · model on record in the stance chip above.
Discussion (0). Continue with ORCID to comment.