REVIEW 5 major objections 6 minor 114 references
AGN jet speed is the dominant tested parameter for heating low-density cosmic gas, so hot diffuse gas can reveal how black hole jets shape the universe.
Reviewed by Pith at T0; open to challenge. T0 means a machine referee read the full paper against a public rubric. the ladder, T0–T4 →
T0 review · deepseek-v4-flash
2026-08-02 06:06 UTC pith:MV4BO3QG
load-bearing objection A genuinely useful case study of jet-parameter variation in Simba-C, but the headline tSZ ratio outside filaments is shakier than the abstract implies: one region, one projection, and a filament mask fixed to the baseline run. the 5 major comments →
Here, There and Everywhere: How AGN jets affect galaxy cluster environments
The pith
A machine-rendered reading of the paper's core claim, the machinery that carries it, and where it could break.
Core claim
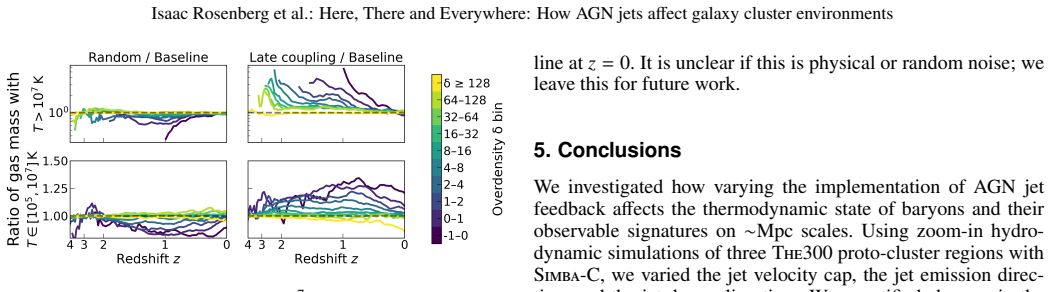
The central claim is that jet velocity is the dominant parameter among those varied in determining the thermal state of gas outside clusters at high redshift. Using zoom-in hydrodynamic simulations of three cluster regions, the paper compares runs with no jets, baseline jets (v_max = 7,000 km/s), and fast jets (v_max = 35,000 km/s), as well as random jet orientation and a longer decoupling time. In the most diffuse gas (overdensities δ<8), the fast-jet run contains up to nearly an order of magnitude more mass at T>10^7 K at z≈1–4, and about twice the Compton-y signal outside filaments compared with the baseline, while inside filaments the difference is only ~10%. The paper further finds that
What carries the argument
The central object is the jet-feedback prescription in the galaxy-formation simulation, parameterized by a velocity cap v_max that sets the maximum kick speed of momentum-loaded jets, a decoupling time that lets jets travel freely before interacting, and the jet emission direction. The analysis machinery is the comparison of these runs through overdensity-binned mass-weighted gas temperature and mock Compton-y maps, with a topological filament-finding algorithm used to separate signal inside and outside filaments. These tools let the paper ask which parameter most changes the thermal state of large-scale structure.
Load-bearing premise
The three simulated cluster regions were chosen for extreme superclustering, high ellipticity, and abundant black holes, and the paper itself cautions they may not be representative, so the claimed sensitivity of low-density gas to jet speed could be an artifact of sampling voids that sit unusually close to massive clusters.
What would settle it
A future measurement of the stacked Compton-y in cluster outskirts beyond ~5 Mpc, at the sensitivity of a spectral-distortion experiment (σ_⟨y⟩ ≈ 1.6×10^-8), would directly test the predicted gap between fast-jet and no-jet models; if the mean-y difference outside clusters does not appear, the claimed sensitivity of underdense gas to jet velocity fails. A cheaper calculation: run the same feedback variations in a large periodic simulation box and check whether the order-of-magnitude boost of T>10^7 K gas at δ<8 survives outside cluster-proximate environments.
If this is right
- A ~100% enhancement of Compton-y outside filaments (versus ~10% inside) means stacked tSZ measurements around clusters could discriminate jet models even though the absolute signal there is faint.
- The order-of-magnitude boost in T>10^7 K gas in δ<8 regions at z≈1–4 identifies the presence of very hot gas in sparse environments as a redshift-dependent marker of jet activity.
- Higher-velocity jets matching observed BCG stellar masses and baryon fractions implies that strong kinetic jet feedback, not just winds or thermal feedback, is needed to explain massive central galaxies.
- Because random jet orientation and delayed coupling produce subtler, non-uniform effects, future model comparisons should prioritize jet velocity (momentum) over angular details.
- Future CMB spectral-distortion and high-resolution tSZ experiments could provide a direct test of the predicted mean-y difference between no-jet and fast-jet scenarios.
Where Pith is reading between the lines
- A testable extension not in the paper: run the same jet-parameter variations in a large periodic cosmological box and stack tSZ outside filaments around field halos, which would show whether the ~100% underdense boost survives outside the cluster-proximate voids the paper samples.
- The paper does not separate jet velocity from momentum flux, since mass-loading is held fixed; varying the two independently would clarify whether the dominant physical quantity is speed itself or total momentum injection.
- If hot low-density gas is as sensitive as claimed, AGN jet feedback could measurably affect interpretations of the 'missing baryons' problem and cosmological surveys that rely on the thermal SZ background, since low-density gas outside clusters is usually assumed to be cool.
- An observational follow-up could compare stacked tSZ around clusters with known giant radio jets versus radio-quiet clusters; the paper's model predicts stronger outside-filament signal in the former.
Editorial analysis
A structured set of objections, weighed in public.
Referee Report
Summary. The paper presents zoom-in hydrodynamical simulations of three massive cluster regions from the Three Hundred project using Simba-C, varying the AGN jet velocity cap (7,000 vs 35,000 km/s, plus a no-jet run), the jet decoupling time (alpha = 1e-4 vs 2e-3), and the jet emission direction (angular-momentum-aligned vs random). It measures IGM gas temperature and density in bins of gas overdensity, mock tSZ maps, filament classification with DisPerSE, oriented stacking of halo tSZ profiles, and compares BCG stellar masses, BH-halo relations, and baryon fractions to eRASS1 and other X-ray data. The central claim is that jet velocity is the dominant tested parameter for heating low-density gas at z > 1, and that the tSZ signal in regions outside filaments is enhanced by ~100%, making hot low-density gas a promising observational probe of AGN feedback. The paper explicitly frames itself as a case study and includes several caveats about the specialized simulation regions and resolution limits.
Significance. If the result holds, it would identify a new observational discriminator for AGN jet feedback — the thermal state of diffuse, cluster-exterior gas at z~1–4 — and would motivate targeted stacking with next-generation tSZ surveys. The study has genuine strengths: the jet parameters are varied a priori within a fixed simulation code and are not fitted to the comparison data, so the eRASS1 BCG masses and BH-halo data provide an independent check; the mock tSZ pipeline is clearly described; and the paper is careful about resolution and about the non-representative nature of its regions. However, at present the headline quantitative claims are not fully robust because the ~100% outside-filament ratio rests on a single region, a single projection, and a filament mask fixed to the baseline run, and because the varied 'jet velocity' is entangled with mass/energy injection. With additional robustness tests and appropriately qualified conclusions, the paper would be a useful contribution.
major comments (5)
- [§3.4, §4.4, Fig. 6] The ~100% outside-filament enhancement is measured with a filament mask derived from the baseline run only. DisPerSE is run on the baseline y-map and the same skeleton is imposed on all feedback runs, with a fixed 1.5 h^-1 cMpc radius and one projection of region A. If fast jets broaden or shift pressure structures, gas that would be filamentary in the fast-jet map is classified as 'outside', while the no-jet run's narrower pressure network suppresses its outside signal. The headline ratio in the Abstract is therefore not robust to this classification choice. Please rerun filament finding per run, or at least vary the persistence threshold and filament width, and report the sensitivity. Multiple regions/projections with error bars are also needed to support the stated magnitude.
- [§2.4, Eq. (9)] Changing v_Max while keeping Eq. (9) fixed simultaneously changes the jet mass outflow rate and the kinetic energy injection rate; if instead the mass outflow is held constant, the momentum flux changes. The sentence 'The mass-loading remains constant ... so in changing the jet velocity we are also modifying the momentum flux' is not internally consistent. The causal statement that 'jet velocity is the dominant parameter' should therefore be rephrased in terms of the actual injected energy/momentum, or the separate contributions should be quantified. Without this, the attribution of the effect specifically to 'velocity' is not clean.
- [§2.2, §4.2, Abstract] The quantitative hot-gas results come from only three regions deliberately selected for extreme superclustering, high ellipticity, and high BH abundance (Eq. 3). The underdense gas sampled is cluster-proximate, and the paper itself states that 'these are the voids that would be most susceptible to jet-induced heating' and that the regions 'may not be representative of the average.' The Abstract's unqualified phrases 'low-density environments' and 'under-dense regions outside filaments' overstate the scope. Please qualify the central claim to cluster-proximate supercluster environments, or provide evidence (e.g., volume/overdensity statistics) that the effect is generic.
- [§4.3, Table 2] The comparison to FOSSIL's global <y> sensitivity is not appropriate. Table 2 reports the mean y in an overdense zoom-in region, not a global sky signal, and the difference between feedback models in this region cannot be equated with the change in the global monopole. The sentence indicating that FOSSIL 'might be able to discriminate such feedback models' is therefore unsupported. Please remove or reframe this claim, or compute the expected contribution of such regions to the global y and its uncertainty.
- [§4.6, Fig. 8] The claim that the fast-jet run 'provides the best match' to eRASS1 is based on a visual comparison of ~100 BCGs with no goodness-of-fit statistic, and the BCG aperture/ICL systematics are acknowledged. Since this statement appears in the Abstract, it needs either a quantitative assessment (e.g., scatter, selection function, or a likelihood) or a more hedged formulation such as 'consistent with' rather than 'best match'.
minor comments (6)
- [§4.4] The sentence 'The Compton-y profile is computed from the baseline y-map' is ambiguous. The middle and right columns of Fig. 6 compare several feedback models, so the text should clarify that the profiles are extracted from each run's y-map using the baseline-derived filament mask.
- [§4.3, Table 2] Please provide uncertainties for the mean-y values in Table 2. Without them, it is difficult to judge whether the reported differences between runs are meaningful.
- [§3.4] The capitalization 'DiSperSE' is inconsistent with 'DisPerSE' in several places; please standardize.
- [§4.5, Fig. 7] The caption says the shaded bands show the 'estimated standard error on the mean for equivalent SO observations,' while the text states the bands are ±0.2 C_m(r)/sqrt(3). Please align the figure, caption, and text.
- [§4.5] Typo: 'anlayses' should be 'analyses.'
- [§4.9–4.10] The random-direction and late-coupling runs are performed in single, different regions. Please state explicitly that comparisons of their relative impact to the velocity runs rely on within-region comparisons, and avoid cross-region statements without noting this limitation.
Circularity Check
No circularity: varied jet parameters are prescribed inputs and external comparisons are independent checks.
full rationale
The paper's central claim is that jet velocity cap is the dominant tested parameter for heating low-density gas and that hot gas outside filaments is a sensitive observable. This is a simulation comparison, not a derivation in which an input is constructed from the output. The varied parameters (vMax=7,000/35,000 km/s, alpha=1e-4/2e-3, jet direction) are prescribed in Sec. 2.4, and the eRASS1/Gaspari/Giodini comparisons in Secs. 4.6-4.8 are external observational checks. Simba-C was calibrated to different summary statistics (z=0 stellar mass function, M_BH-M*, quenched fraction, Sec. 2.1), so the fast-jet match to BCG and gas fractions is not a fitted-input-called-prediction. The paper's own caveats - the fixed baseline DisPerSE skeleton, one region/projection for the ~100% outside-filament tSZ ratio, and low-density regions 'most susceptible to jet-induced heating' - are limitations on robustness/generalization, not circularity: the outside-filament ratio is still computed from simulated y-maps in a fixed mask and does not reduce to an input parameter by construction. Self-citations (Lokken et al. 2023 for supercluster selection; Santoni et al. 2024/2026 for persistence cuts) are auxiliary methodological choices with independent content and do not force the physical conclusions.
Axiom & Free-Parameter Ledger
free parameters (3)
- Jet velocity cap vMax =
7,000 (baseline), 35,000 (fast), disabled (no jets) km/s
- Decoupling time scaling alpha =
1e-4 (baseline), 2e-3 (late)
- Jet direction model =
aligned with angular momentum; randomized
axioms (4)
- domain assumption Planck 2016 cosmological parameters (H0=67.77, Ωm=0.307, Ωb=0.048, σ8=0.823, ns=0.96)
- domain assumption Simba-C subgrid galaxy formation model (chemical enrichment, BH seeding, torque/Bondi accretion, X-ray/wind/jet feedback) is a valid representation of baryon physics on cluster scales
- ad hoc to paper Jet feedback prescription: mass-loaded jets with fixed momentum flux 20 c η Ṁ_BH, velocity cap vMax, and free propagation for t_dec = α t_Hubble before coupling
- domain assumption DisPerSE persistence thresholds (1 and 1.5) and fixed filament radius 1.5 h^-1 cMpc robustly define filament membership; the baseline skeleton is used for all feedback runs
Cite this review
Pith. "Pith review of Here, There and Everywhere: How AGN jets affect galaxy cluster environments." pith.science (2026). https://pith.science/paper/MV4BO3QG
@misc{pith2026260713132,
  author       = {Pith},
  title        = {Pith review of: Here, There and Everywhere: How AGN jets affect galaxy cluster environments},
  year         = {2026},
  howpublished = {\url{https://pith.science/paper/MV4BO3QG}},
  note         = {Machine review of arXiv:2607.13132}
}
read the original abstract
Active galactic nuclei (AGN) feedback via black hole-driven jets and winds plays a key role in redistributing matter across megaparsec scales. However, the implementation of jet feedback in cosmological simulations remains highly prescriptive, leading to uncertainties in the predicted state of the Warm-Hot Intergalactic Medium and other extragalactic observables. We investigate how variations in AGN jet velocity, orientation, and delayed hydrodynamic coupling impact the thermodynamic state of gas surrounding galaxy clusters. We aim to identify observational signatures in the thermal Sunyaev-Zel'dovich (tSZ) effect and galaxy properties that can constrain these models. We employ zoom-in hydrodynamic simulations centered on three galaxy clusters from The Three Hundred, utilizing the SIMBA-C model and various feedback parameters. We use filament-finding algorithms and oriented stacking to probe the effect on large-scale structure and compare our results to observational data for brightest cluster galaxies from eRASS1, black hole-halo mass relations and baryonic mass fractions. Jet velocity is the dominant tested parameter in heating low-density environments at $z > 1$. At lower-$z$, higher velocity jets quench star formation, expel baryonic matter, and prevent black hole growth. While the tSZ signal within the central cluster and surrounding filaments is only affected by $\sim10\%$, the signal in under-dense regions outside filaments is enhanced by $\sim100\%$. In this case study, high velocity AGN jets provide the best match to galaxy properties from eRASS1 and other X-ray surveys. We find that hot gas in low-density regimes is a sensitive probe of AGN feedback. Future high-resolution tSZ surveys like the Simons Observatory and spectral-distortion experiments like FOSSIL have the potential to probe the thermal state of the gas outside clusters to distinguish between these feedback models.
Figures


Reference graph
Works this paper leans on
-
[1]
2022, FOSSIL: FTS fOr CMB Spectral diStortIon expLoration: A mission concept for the M-class ESA call, eSA mission proposal
Aghanim, N. 2022, FOSSIL: FTS fOr CMB Spectral diStortIon expLoration: A mission concept for the M-class ESA call, eSA mission proposal
2022
-
[2]
2022, Publications of the Astronomical Society of Japan, 74, 175–208 Anglés-Alcázar, D., Davé, R., Faucher-Giguère, C.-A., Özel, F., & Hopkins, P
Akino, D., Eckert, D., Okabe, N., et al. 2022, Publications of the Astronomical Society of Japan, 74, 175–208 Anglés-Alcázar, D., Davé, R., Faucher-Giguère, C.-A., Özel, F., & Hopkins, P. F. 2016, Monthly Notices of the Royal Astronomical Society, 464, 2840–2853 Anglés-Alcázar, D., Faucher-Giguère, C.-A., Kereš, D., et al. 2017, Monthly No- tices of the R...
2022
-
[3]
2025, MNRAS, 538, 1628
Bagchi, J., Ray, S., Dhiwar, S., et al. 2025, MNRAS, 538, 1628
2025
-
[4]
K., Balogh, M
Baldry, I. K., Balogh, M. L., Bower, R. G., et al. 2006, Monthly Notices of the Royal Astronomical Society, 373, 469–483
2006
-
[5]
Ballo, L., Heras, F. J. H., Barcons, X., & Carrera, F. J. 2012, Astronomy & As- trophysics, 545, A66
2012
-
[6]
2018, MNRAS, 476, 2689
Biffi, V ., Planelles, S., Borgani, S., et al. 2018, MNRAS, 476, 2689
2018
-
[7]
2024, MNRAS, 534, 655
Bigwood, L., Amon, A., Schneider, A., et al. 2024, MNRAS, 534, 655
2024
-
[8]
A., Irši ˇc, V ., Amon, A., & Sijacki, D
Bigwood, L., Bourne, M. A., Irši ˇc, V ., Amon, A., & Sijacki, D. 2025, MNRAS, 542, 3206
2025
-
[9]
Bond, J. R. & Efstathiou, G. 1987, MNRAS, 226, 655
1987
-
[10]
1952, MNRAS, 112, 195
Bondi, H. 1952, MNRAS, 112, 195
1952
-
[11]
& Hoyle, F
Bondi, H. & Hoyle, F. 1944, MNRAS, 104, 273
1944
-
[12]
Bosch, R. C. E. v. d. 2016, The Astrophysical Journal, 831, 134
2016
-
[13]
2024, A&A, 685, A106 Cañas, R., Lagos, C
Bulbul, E., Liu, A., Kluge, M., et al. 2024, A&A, 685, A106 Cañas, R., Lagos, C. d. P., Elahi, P. J., et al. 2020, MNRAS, 494, 4314 Cano-Díaz, M., Maiolino, R., Marconi, A., et al. 2012, A&A, 537, L8
2024
-
[14]
2025, A&A, 704, A110
Chiu, I.-N., Ghirardini, V ., Grandis, S., et al. 2025, A&A, 704, A110
2025
-
[15]
2012, Monthly Notices of the Royal Astronomical Society, 426, 510–530
Chluba, J., Nagai, D., Sazonov, S., & Nelson, K. 2012, Monthly Notices of the Royal Astronomical Society, 426, 510–530
2012
-
[16]
2013, Monthly Notices of the Royal Astronomical Society, 430, 3054–3069
Chluba, J., Switzer, E., Nelson, K., & Nagai, D. 2013, Monthly Notices of the Royal Astronomical Society, 430, 3054–3069
2013
-
[17]
P., Naab, T., & Johansson, P
Choi, E., Ostriker, J. P., Naab, T., & Johansson, P. H. 2012, The Astrophysical Journal, 754, 125
2012
-
[18]
2016, Astronomy & Astrophysics, 592, A46
Chon, G., Puchwein, E., & Böhringer, H. 2016, Astronomy & Astrophysics, 592, A46
2016
-
[19]
F., Davé, R., Sorini, D., & Anglés-Alcázar, D
Christiansen, J. F., Davé, R., Sorini, D., & Anglés-Alcázar, D. 2020, Monthly Notices of the Royal Astronomical Society, 499, 2617–2635
2020
-
[20]
O., Heald, G., Jarrett, T., et al
Clarke, A. O., Heald, G., Jarrett, T., et al. 2017, Astronomy & Astrophysics, 601, A25
2017
-
[21]
2022, Monthly Notices of the Royal Astronomical Society, 511, 2897–2913
Contreras-Santos, A., Knebe, A., Pearce, F., et al. 2022, Monthly Notices of the Royal Astronomical Society, 511, 2897–2913
2022
-
[22]
R., Madhavacheril, M
Coulton, W. R., Madhavacheril, M. S., Duivenvoorden, A. J., et al. 2023, The Atacama Cosmology Telescope: High-resolution component-separated maps across one-third of the sky
2023
-
[23]
A., Eke, V
Crain, R. A., Eke, V . R., Frenk, C. S., et al. 2007, Monthly Notices of the Royal Astronomical Society, 377, 41–49
2007
-
[24]
2022, Monthly Notices of the Royal Astro- nomical Society, 514, 977–996
Cui, W., Dave, R., Knebe, A., et al. 2022, Monthly Notices of the Royal Astro- nomical Society, 514, 977–996
2022
-
[25]
A., Anglés-Alcázar, D., & Yang, X
Cui, W., Davé, R., Peacock, J. A., Anglés-Alcázar, D., & Yang, X. 2021, Nature Astronomy, 5, 1069
2021
-
[26]
2018, Monthly Notices of the Royal Astro- nomical Society, 480, 2898–2915
Cui, W., Knebe, A., Yepes, G., et al. 2018, Monthly Notices of the Royal Astro- nomical Society, 480, 2898–2915
2018
-
[27]
2013, Monthly Notices of the Royal Astronomical Society, 437, 816–830
Cui, W., Murante, G., Monaco, P., et al. 2013, Monthly Notices of the Royal Astronomical Society, 437, 816–830
2013
-
[28]
J., & Mahato, M
Dabhade, P., Saikia, D. J., & Mahato, M. 2023, Journal of Astrophysics and Astronomy, 44 Davé, R., Anglés-Alcázar, D., Narayanan, D., et al. 2019, Monthly Notices of the Royal Astronomical Society, 486, 2827–2849 Davé, R., Thompson, R., & Hopkins, P. F. 2016, Monthly Notices of the Royal Astronomical Society, 462, 3265–3284 Article number, page 16 Isaac R...
2023
-
[29]
& Statler, T
Diehl, S. & Statler, T. S. 2008, ApJ, 687, 986
2008
-
[30]
2010, MNRAS, 405, 1544
Dolag, K., Murante, G., & Borgani, S. 2010, MNRAS, 405, 1544
2010
-
[31]
2014, Monthly Notices of the Royal Astronomical Society, 444, 1453–1468 Euclid Collaboration, Scaramella, R., Amiaux, J., et al
Dubois, Y ., Pichon, C., Welker, C., et al. 2014, Monthly Notices of the Royal Astronomical Society, 444, 1453–1468 Euclid Collaboration, Scaramella, R., Amiaux, J., et al. 2022, A&A, 662, A112
2014
-
[32]
2025, arXiv e-prints, arXiv:2512.03038
Fabbian, G., Bianchini, F., Sabyr, A., et al. 2025, arXiv e-prints, arXiv:2512.03038
arXiv 2025
-
[33]
2012, Annual Review of Astronomy & Astrophysics, 50, 455–489
Fabian, A. 2012, Annual Review of Astronomy & Astrophysics, 50, 455–489
2012
-
[34]
J., Cheng, E
Fixsen, D. J., Cheng, E. S., Gales, J. M., et al. 1996, ApJ, 473, 576
1996
-
[35]
1998, Advances in Mathematics, 134, 90
Forman, R. 1998, Advances in Mathematics, 134, 90
1998
-
[36]
2019, The Astrophysical Journal, 884, 169
Gaspari, M., Eckert, D., Ettori, S., et al. 2019, The Astrophysical Journal, 884, 169
2019
-
[37]
2026, Cosmological back- reaction of baryons on dark matter in the CAMELS simulations
Gebhardt, M., Anglés-Alcázar, D., Genel, S., et al. 2026, Cosmological back- reaction of baryons on dark matter in the CAMELS simulations
2026
-
[38]
2024, Astronomy & Astrophysics, 689, A298
Ghirardini, V ., Bulbul, E., Artis, E., et al. 2024, Astronomy & Astrophysics, 689, A298
2024
-
[39]
2009, The Astrophysical Journal, 703, 982–993
Giodini, S., Pierini, D., Finoguenov, A., et al. 2009, The Astrophysical Journal, 703, 982–993
2009
-
[40]
Gitti, M., Brighenti, F., & McNamara, B. R. 2012, Advances in Astronomy, 2012, 1–24
2012
-
[41]
H., Sivanandam, S., Zabludoff, A
Gonzalez, A. H., Sivanandam, S., Zabludoff, A. I., & Zaritsky, D. 2013, The Astrophysical Journal, 778, 14
2013
-
[42]
H., Bluck, A
Goubert, P. H., Bluck, A. F. L., Piotrowska, J. M., & Maiolino, R. 2024, The role of environment and AGN feedback in quenching local galaxies: Comparing cosmological hydrodynamical simulations to the SDSS
2024
-
[43]
D., Greene, J
Goulding, A. D., Greene, J. E., Ma, C.-P., et al. 2016, ApJ, 826, 167
2016
-
[44]
2025, The hot circumgalactic medium in stacked X-rays: observations vs simulations
Grayson, S., Scannapieco, E., Comparat, J., et al. 2025, The hot circumgalactic medium in stacked X-rays: observations vs simulations
2025
-
[45]
Grayson, S., Scannapieco, E., Davé, R., Babul, A., & Hough, R. T. 2026, ApJ, 999, 9
2026
-
[46]
2023, The Astrophysical Journal, 957, 17
Grayson, S., Scannapieco, E., & Davé, R. 2023, The Astrophysical Journal, 957, 17
2023
-
[47]
Gyulassy, A. G. 2008, Combinatorial construction of Morse-Smale complexes for data analysis and visualization (University of California, Davis) Gómez, J. S., Hough, T., Jiménez Muñoz, A., et al. 2025, Astronomy & Astro- physics, 697, A171
2008
-
[48]
2025b, Phys
Hadzhiyska, B., Ferraro, S., & Zhou, R. 2025b, Phys. Rev. D, 111, 023534 Harnois-Déraps, J., van Waerbeke, L., Viola, M., & Heymans, C. 2015, MNRAS, 450, 1212
2015
-
[49]
Heckman, T. M. & Best, P. N. 2014, Annual Review of Astronomy and Astro- physics, 52, 589–660
2014
-
[50]
Hopkins, P. F. 2014, GIZMO: Multi-method magneto-hydrodynamics+gravity code, Astrophysics Source Code Library, record ascl:1410.003
2014
-
[51]
Hopkins, P. F. 2017, arXiv e-prints, arXiv:1712.01294
Pith/arXiv arXiv 2017
-
[52]
F., Quataert, E., & Murray, N
Hopkins, P. F., Quataert, E., & Murray, N. 2012, Monthly Notices of the Royal Astronomical Society, 421, 3522–3537
2012
-
[53]
F., Wellons, S., Anglés-Alcázar, D., Faucher-Giguère, C.-A., & Grudi´c, M
Hopkins, P. F., Wellons, S., Anglés-Alcázar, D., Faucher-Giguère, C.-A., & Grudi´c, M. Y . 2021, Monthly Notices of the Royal Astronomical Society, 510, 630–638
2021
-
[54]
T., Rennehan, D., Kobayashi, C., et al
Hough, R. T., Rennehan, D., Kobayashi, C., et al. 2023, Monthly Notices of the Royal Astronomical Society, 525, 1061–1076
2023
-
[55]
T., Shao, Z., Cui, W., et al
Hough, R. T., Shao, Z., Cui, W., et al. 2024, MNRAS, 532, 476
2024
-
[56]
& Lyttleton, R
Hoyle, F. & Lyttleton, R. A. 1939, Proceedings of the Cambridge Philosophical Society, 35, 405
1939
-
[57]
2022, Monthly Notices of the Royal Astronomical Society, 513, 3768–3787 Ivezi´c, Ž., Kahn, S
Irodotou, D., Fragkoudi, F., Pakmor, R., et al. 2022, Monthly Notices of the Royal Astronomical Society, 513, 3768–3787 Ivezi´c, Ž., Kahn, S. M., Tyson, J. A., et al. 2019, ApJ, 873, 111
2022
-
[58]
1999, The Astrophysical Journal Supplement Series, 125, 439–462
Iwamoto, K., Brachwitz, F., Nomoto, K., et al. 1999, The Astrophysical Journal Supplement Series, 125, 439–462
1999
-
[59]
G., Starkenburg, T
Iyer, K. G., Starkenburg, T. K., Bryan, G. L., et al. 2025, ApJ, 994, 174
2025
-
[60]
& Fabbiano, G
Kim, D.-W. & Fabbiano, G. 2015, ApJ, 812, 127
2015
-
[61]
2024, A&A, 688, A210
Kluge, M., Comparat, J., Liu, A., et al. 2024, A&A, 688, A210
2024
-
[62]
2016, Monthly Notices of the Royal Astronomical Society, 457, 4340–4359
Klypin, A., Yepes, G., Gottlöber, S., Prada, F., & Heß, S. 2016, Monthly Notices of the Royal Astronomical Society, 457, 4340–4359
2016
-
[63]
Krumholz, M. R. & Gnedin, N. Y . 2011, ApJ, 729, 36
2011
-
[64]
R., et al
Kuchner, U., Aragón-Salamanca, A., Pearce, F. R., et al. 2020, Monthly Notices of the Royal Astronomical Society, 494, 5473–5491
2020
-
[65]
Lagos, C. D. P., Padilla, N. D., Strauss, M. A., Cora, S. A., & Hao, L. 2011, MNRAS, 414, 2148
2011
-
[66]
2023, Monthly Notices of the Royal Astronomical Society, 523, 1228–1246
Li, Q., Cui, W., Yang, X., et al. 2023, Monthly Notices of the Royal Astronomical Society, 523, 1228–1246
2023
-
[67]
2020, MNRAS, 495, 2930
Li, Q., Cui, W., Yang, X., et al. 2020, MNRAS, 495, 2930
2020
-
[68]
& Mohr, J
Lin, Y . & Mohr, J. J. 2004, The Astrophysical Journal, 617, 879–895
2004
-
[69]
H., Ferraro, S., Schaan, E., et al
Liu, R. H., Ferraro, S., Schaan, E., et al. 2025, Phys. Rev. D, 112, 083561
2025
-
[70]
R., et al
Lokken, M., Cui, W., Bond, J. R., et al. 2023, Monthly Notices of the Royal Astronomical Society, 523, 1346–1363
2023
-
[71]
2025, The Astrophysical Jour- nal, 982, 186
Lokken, M., van Engelen, A., Aguena, M., et al. 2025, The Astrophysical Jour- nal, 982, 186
2025
-
[72]
2025, ApJ, 980, 187
Long, Q.-C., Dong, A.-J., Zhi, Q.-J., & Shang, L.-H. 2025, ApJ, 980, 187
2025
-
[73]
2025, Astronomy & Astrophysics, 702, A221
Ma, W., Cui, W., Davé, R., Anglés-Alcázar, D., & Guo, H. 2025, Astronomy & Astrophysics, 702, A221
2025
-
[74]
2024, in Society of Photo-Optical Instrumentation Engineers (SPIE) Conference Series, V ol
Maffei, B., Aghanim, N., Aumont, J., et al. 2024, in Society of Photo-Optical Instrumentation Engineers (SPIE) Conference Series, V ol. 13102, Millimeter, Submillimeter, and Far-Infrared Detectors and Instrumentation for Astron- omy XII, ed. J. Zmuidzinas & J.-R. Gao, 131020N
2024
-
[75]
2018, Monthly Notices of the Royal Astronomical Society
Marinacci, F., V ogelsberger, M., Pakmor, R., et al. 2018, Monthly Notices of the Royal Astronomical Society
2018
-
[76]
2012, MNRAS, 420, 2859
Martizzi, D., Teyssier, R., & Moore, B. 2012, MNRAS, 420, 2859
2012
-
[77]
& Nulsen, P
McNamara, B. & Nulsen, P. 2007, Annual Review of Astronomy and Astro- physics, 45, 117–175
2007
-
[78]
& Matsushita, K
Nagino, R. & Matsushita, K. 2009, A&A, 501, 157
2009
-
[79]
2006, Nu- clear Physics A, 777, 424–458
Nomoto, K., Tominaga, N., Umeda, H., Kobayashi, C., & Maeda, K. 2006, Nu- clear Physics A, 777, 424–458
2006
-
[80]
Oei, M. S. S. L., Hardcastle, M. J., Timmerman, R., et al. 2024, Nature, 633, 537–541
2024
discussion (0)
Sign in with ORCID, Apple, or X to comment. Anyone can read and Pith papers without signing in.