REVIEW 4 major objections 6 minor 43 references
Fully-automated patient-level malaria assessment on field-prepared thin blood film microscopy images, including Supplementary Information
T0 review · 4 major / 6 minor · reviewed 2026-08-14 · deepseek-v4-flash
Pith's one-line read A fully automated pipeline reads field-prepared thin blood films, counts malaria parasites, and identifies the species with accuracy close to clinical needs.
desk verdict A genuinely complete field-slide thin-film malaria pipeline with real patient-level results, but the headline quantitation number is measured against a reference the authors themselves do not trust. read the letter →
The pith
A machine-rendered reading of the paper's core claim, the machinery that carries it, and where it could break.
The reading
What carries the argument
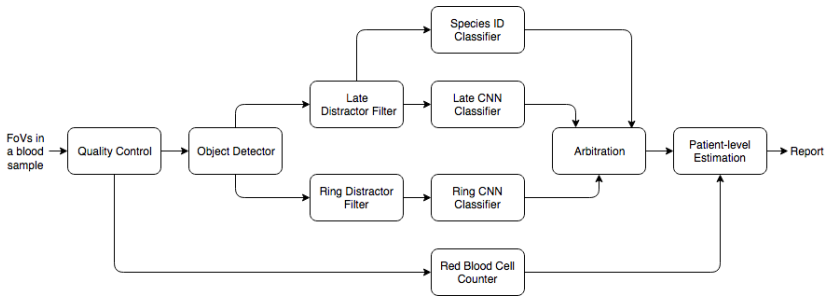
The load-bearing mechanism is a two-branch decision cascade plus a bias-corrected counting formula. Each field-of-view is quality controlled, red blood cells are counted from unclumped cells only (the scanner keeps collecting frames until 20,000 single RBCs are tallied), and candidate objects are found by a purple-highlighting grayscale transform $gray = RB/G^2$ with dynamic thresholding. Each branch then applies a gradient-boosted distractor filter followed by a CNN, with object arbitration assigning shared detections to the branch with the higher score. Quantitation uses $\hat{P} = (n_R - \hat{fp}/\hat{s})(5\times 10^6 / n_{RBC})$, and the paper derives that patient-level counting error is governed by $\sigma(s)/\mu(s) + \sigma(fp)/\mu(s) \cdot 1/P$, which lets the system choose operating points for diagnosis versus quantitation. Species ID sums species probabilities over late-stage objects, then overrides or flags P. falciparum based on ring density and the ring-to-late-stage ratio, including detecting mixed infections when both signals are high.
What would settle it
Re-count the 81 holdout slides with expert microscopists under standardized in-house conditions, then compare the algorithm's estimates against those recounts: if the median error becomes meaningfully larger than 18% or the 31% discrepancy persists against the cleaner reference, the claim of close-to-sufficient quantitation is not confirmed. For species ID, a blinded evaluation on a larger set of P. ovale and P. malariae slides would settle whether the 44% and 67% accuracies reflect scarce training data or a methodological limit.
Extended reading notes
Core claim
The paper's central claim is that a complete, field-deployable thin-film malaria assessment system—built from a color-based candidate detector, a gradient-boosted distractor filter, and convolutional classifiers arranged in two branches, one for ring-stage parasites and one for late stages—produces patient-level parasitemia estimates and species predictions that are close to the accuracy required for drug resistance studies and clinical use on field-prepared samples. Quantitation is grounded in a formula that corrects raw parasite counts by expected sensitivity and false-positive rate and scales by an automated red-blood-cell count, with an error decomposition showing that variation in sample-level sensitivity ($\sigma(s)/\mu(s)$) is the dominant error source at high parasitemia. Species identification uses late-stage morphology as the primary signal and ring density plus ring-to-late-stage ratio as secondary signals to catch P. falciparum, which typically presents only rings. On holdout slides the system achieves 18% and 31% median quantitation errors against in-house and field reference counts, respectively, and per-species accuracies of 70–93% for the common species, with a large boost for P. falciparum when the thin film result is combined with the companion thick film system.
Load-bearing premise
The system's claimed quantitation accuracy rests on the field microscopists' counts for 81 holdout slides being accurate enough to serve as ground truth, even though the paper itself says those counts are highly variable and that in-house recounts are preferable.
Editorial extensions
If this is right
- Drug-resistance sentinel sites could replace or augment expert microscopists with an automated reader that counts P. falciparum rings on thin films, since the measured 18% median error against in-house recounts is at or near the 25% target used for such studies.
- Because the machine routinely scans 20,000 red cells instead of the microscopist's 1,000, quantitation noise from Poisson sampling drops substantially, especially in the 16,000–80,000 parasites/µL range, making automated counts more reproducible than manual ones.
- Combining the thin film system with the companion thick film system raises P. falciparum species identification from 70% to 94%, which suggests a tandem automated pipeline can meet the 90% expert-level bar for the two dominant species.
- Patient-level error metrics, rather than object-level ROC curves, provide a way for future malaria microscopy studies to report results that compare directly with clinical requirements.
- The system's species identification remains below expert level for the rarer P. ovale and P. malariae, implying deployment for speciation would currently need more data or careful geographical priors for those species.
Reading between the lines
- The 31% median error versus field counts may overstate the algorithm's true error: since field counts themselves carry Poisson and counting noise, the comparison on 81 slides is partly two noisy measurements disagreeing; the 18% error versus in-house recounts is the cleaner estimate of system performance.
- The same architecture—color-based candidate detection, cheap distractor filtering, CNN classification, and count correction—could transfer to other rare-object counting tasks in stained microscopy wherever a specific stain color marks candidate objects, such as tuberculosis bacilli or other blood parasites; the paper does not make this claim.
- The species-ID failure pattern on P. ovale and P. malariae is plausibly a data-quantity effect, since those species are rare in the training set; a testable extension would be collecting more Po and Pm late-stage examples and re-measuring the same confusion matrix.
- Automated thin-film quantitation is explicitly restricted to high parasitemia; extending patient-level assessment to low parasitemia would require integrating the thick-film branch's lower limit of detection, which is already the stated division of labor.
Signed reviews
Editorial analysis
A structured set of objections, weighed in public.
Referee Report
Summary. The paper presents a fully-automated pipeline for patient-level malaria assessment on field-prepared thin blood film microscopy images, combining quality control, RBC counting, object detection, distractor filters, CNN classifiers, species ID, and patient-level disposition. The system is trained on a large dataset of 798 image sets from 765 patients spanning multiple continents, with sample-level train/validation separation. The main reported results are: 18% median quantitation error versus in-house counts on 24 Pf holdout slides, 31% median error versus field counts on 81 Pf holdout slides, and species identification accuracies of 70% for Pf (94% with tandem thick film), 93% for Pv, 44% for Po, and 67% for Pm. The authors claim these results are 'close to sufficiently accurate' for drug-resistance monitoring and clinical use-cases.
Significance. If the central claims hold, this is a significant contribution to automated malaria microscopy, with a complete, field-oriented system evaluated with patient-level metrics on a diverse dataset. Strengths include the large and diverse field-prepared dataset, sample-level integrity in train/validation splits, the use of patient-level not object-level metrics, and an explicit discussion of how automation reduces Poisson sampling error. The paper also addresses a documented gap in prior work by focusing on field-prepared slides. However, the supporting evidence for the headline quantitative claims has important gaps that need to be addressed before the claims can be accepted.
major comments (4)
- [§IV.A.2, Eqns (3), (8), (9)] The derivation of the quantitation error budget is dimensionally inconsistent. In Eqn (1), nR is a count of rings in the nRbc examined RBCs, while \hat{fp} is defined as an expected number of FPs per µL; subtracting the latter from the former in the numerator is not valid. The correct expression should use the expected FP count in the examined blood volume, i.e. \hat{fp}·(nRbc/5e6). The later derivation switches between FP count discrepancy (Δfp in Eqn (5)) and per-µL FP rates in Eqn (3), and as written the second term in Eqn (9) does not follow dimensionally. This inconsistency prevents the quantitative bound of 'usually less than 23%' from being derived from the equations as given.
- [§IV.C.2, Fig. 4] The 31% median quantitation error on the 81-slide holdout is measured against field counts, which the paper itself (citing reference [13]) describes as highly variable due to Poisson noise and the difficulty of manual RBC counting. If the field counts are noisy, the reported 31% may be largely disagreement between two imperfect measurements rather than the algorithm's true error. The paper presents no paired comparison on the same slides: the 18% figure comes from a different 24-slide subset measured against in-house counts. Without an uncertainty model for the field-count reference or a paired analysis, the claim that the system meets the <25% error target for drug-resistance monitoring is not supported.
- [§IV.C.2, §IV.A.2] There is an inconsistency between the predicted and observed quantitation error. The paper predicts from Eqn (9) that ring quantitation error will 'usually be less than 23%' using σ(s)/µ(s)=0.13 and σ(fp)/µ(s)=6000, yet the observed median error on the 81-slide holdout is 31%. The paper attributes the discrepancy to field-count noise and Poisson variability without quantification. It also does not state explicitly whether the σ values used in the prediction are computed on the validation set or on the same holdout used for the reported results. The authors should report the distribution of errors (not just medians), give confidence intervals, and clarify the provenance of the σ values.
- [§IV.D, Table I] The species identification claim is overbroad as stated in the abstract. The holdout set contains only 9 Po and 3 Pm samples, so the reported accuracies of 44% and 67% have very wide confidence intervals, and the paper itself acknowledges that the algorithm does not meet the WHO 90% threshold for these species. The abstract and conclusion that results are 'close to sufficiently accurate' for clinical use should be qualified: the data support this only for Pf (in tandem with thick film) and Pv, not for Po and Pm. This is a load-bearing point for the central claim.
minor comments (6)
- [Eqn (2)] The expression 'gray = RB/G^2 + ε' should use explicit multiplication, e.g., 'R·B' or 'R*B', to avoid ambiguity with a variable named RB.
- [§IV.C.2] The text 'P > 60k/L' should read 'P > 60k/µL' for consistency with the rest of the paper.
- [Table I] The use of red color to indicate treatment-affecting errors is not accessible in grayscale printing; please add a symbol or footnote.
- [Fig. 4] Beyond the ±25% reference lines, a Bland-Altman plot or limits-of-agreement analysis would show whether the error is systematic or random and would be more informative for assessing clinical acceptability.
- [Table I] The species-ID accuracies would be more interpretable with confidence intervals (e.g., Wilson intervals) given the small cell counts, especially for Po and Pm.
- [General] The Supplementary Information is described as a separate arXiv posting [8], but it is also included in the manuscript; please make the reference consistent, for example by citing the appendix sections.
Circularity Check
Main results are direct holdout measurements; no reduction of predictions to fitted inputs.
full rationale
The paper's central quantitative claims are measured on holdout data rather than derived from the fitting procedure: 18% median quantitation error against in-house counts on 24 slides, 31% median error against field counts on 81 slides, and a species-ID confusion matrix on 42 samples. The quantitation estimator in Eqn. 1 uses expected sensitivity and FP-rate hyperparameters obtained from a validation set, which is standard practice, and Eqn. 9 propagates the variance of those quantities into an expected-error estimate. That estimate ('expect our ring quantitation error to usually be less than ... 23%') is an in-sample model calculation, not an independent validation, but it is not used as the reported result and does not make the holdout measurements circular. The only notable self-citation is the tandem thick-film assumption for Pf species ID, where the paper defers to the thick-film method of [6]; this is a stated conditional assumption based on a separately published result, and the measured 70% Pf accuracy is reported independently. No equation in the paper reduces by construction to its own inputs, and no fitted parameter is renamed as a prediction. Thus there is no significant circularity.
Assumptions & free parameters
free parameters (6)
- tRing =
not stated
- tLate =
not stated
- expected sensitivity 's =
not stated (mean or median of sample sensitivities on validation)
- expected FP rate 'fp =
not stated (a µ(fp) of 1.6k is reported at a diagnosis operating point)
- Species ID ring-density and ratio thresholds =
empirically determined, not stated
- QC pre-set thresholds =
not stated
assumptions (7)
- standard math Poisson distribution governs parasite counts in blood volumes.
- domain assumption Healthy human blood contains 5e6 RBCs per µL.
- domain assumption Giemsa staining consistently colors parasite nuclei purple and RBCs pink or gray, so the grayscale transform in Eqn 2 highlights parasites.
- ad hoc to paper Transitional and doubtful objects can be excluded from training without biasing the classifier.
- domain assumption The holdout set is representative of the target field use-case and independent from training at the clinic level.
- domain assumption Human expert annotations used as ground truth are correct.
- ad hoc to paper CNN training with capped per-sample contributions and distractor selection produces a classifier that generalizes to new field slides.
Cite this review
Pith. "Pith review of Fully-automated patient-level malaria assessment on field-prepared thin blood film microscopy images, including Supplementary Information." pith.science (2026). https://pith.science/paper/NC3DFRXB
@misc{pith2026190801901,
  author       = {Pith},
  title        = {Pith review of: Fully-automated patient-level malaria assessment on field-prepared thin blood film microscopy images, including Supplementary Information},
  year         = {2026},
  howpublished = {\url{https://pith.science/paper/NC3DFRXB}},
  note         = {Machine review of arXiv:1908.01901}
}
read the original abstract
Malaria is a life-threatening disease affecting millions. Microscopy-based assessment of thin blood films is a standard method to (i) determine malaria species and (ii) quantitate high-parasitemia infections. Full automation of malaria microscopy by machine learning (ML) is a challenging task because field-prepared slides vary widely in quality and presentation, and artifacts often heavily outnumber relatively rare parasites. In this work, we describe a complete, fully-automated framework for thin film malaria analysis that applies ML methods, including convolutional neural nets (CNNs), trained on a large and diverse dataset of field-prepared thin blood films. Quantitation and species identification results are close to sufficiently accurate for the concrete needs of drug resistance monitoring and clinical use-cases on field-prepared samples. We focus our methods and our performance metrics on the field use-case requirements. We discuss key issues and important metrics for the application of ML methods to malaria microscopy.
Figures

Figures from the paper (10 more)




Reference graph
Works this paper leans on
-
[13]
N. Linder et al., “A malaria diagnostic tool based on computer vision screening and visualization of Plasmodium falciparum candidate areas in digitized blood smears”, PLoS One, 2014
work page 2014
-
[1]
World Health Organization, “World malaria report 2018”, Geneva: World Health Organization’, WHO, 2018
work page 2018
-
[2]
CDC, https://www.cdc.gov/malaria/diagnosis treatment/clinicians2.html
-
[3]
G. Nazare-Pembele, L. Rojas, F.A. Nunez, “Lack of knowledge regard- ing the microscopic diagnosis of malaria by technicians of the laboratory network in Luanda, Angola”, Biomedica, 2016
work page 2016
-
[4]
Mi- croscopy and outpatient malaria case management among older children and adults in Kenya
D. Zurovac, B. Midia, S.A. Ochola, M. English, R.W. Snow, “Mi- croscopy and outpatient malaria case management among older children and adults in Kenya”, Trop Med Int Health. 2006
work page 2006
-
[5]
Basic Malaria Microscopy: Tutor’s guide
World Health Organization and Center for Disease Control, “Basic Malaria Microscopy: Tutor’s guide”, WHO, 2010
work page 2010
-
[6]
C. Mehanian, et al., ”Computer-Automated Malaria Diagnosis and Quantitation Using Convolutional Neural Networks”, CVPR, 2017
work page 2017
-
[7]
Garnham, ”Malaria parasites and other haemosporidia”, Black- well Scientific Publications Ltd., 1966
P.C.C. Garnham, ”Malaria parasites and other haemosporidia”, Black- well Scientific Publications Ltd., 1966
work page 1966
Show all 43 references
-
[8]
Supplementary Information for ‘Fully-automated patient-level malaria assessment on field-prepared thin blood film microscopy images’
C.B. Delahunt, M.S. Jaiswal et al., “Supplementary Information for ‘Fully-automated patient-level malaria assessment on field-prepared thin blood film microscopy images’ ”, arXiv, 2019
2019
-
[9]
Image analysis and machine learning for detecting malaria
M. Poostchi, K. Silamut, R. Maude, S. Jaeger and G. Thoma, “Image analysis and machine learning for detecting malaria”, Transl Res, 2018
2018
-
[10]
Koller and Y
D. Koller and Y . Bengio, ”A fireside chat with Daphne Koller”, ICLR 2018, https://www.youtube.com/watch?v=N4mdV1CIpvI
2018
-
[11]
M.T. Le, T. R. Bretschneider, C. Kuss and P. R. Preiser, ”A novel semi-automatic image processing approach to determine P. falciparum parasitemia in Giemsa-stained thin blood smears”, BMC Cell Biol, 2008
2008
-
[12]
Computer vision for microscopy diagnosis of malaria
F. B. Tek, A. G. Dempster and I. Kale, “Computer vision for microscopy diagnosis of malaria”, Malaria J, 2009
2009
-
[14]
Automated status identification of microscopic images obtained from malaria thin blood smears using bayes decision: A study case in Plasmodium falciparum
D. Anggraini et al., “Automated status identification of microscopic images obtained from malaria thin blood smears using bayes decision: A study case in Plasmodium falciparum”, ICEEI, 2011
2011
-
[15]
G. P. Gopakumar et al., ”Convolutional neural network-based malaria diagnosis from focus stack of blood smear images acquired using custom-built slide scanner”, J Biophotonics, 2018
2018
-
[16]
Abbas, et al., ”Machine aided malaria parasitemia detection in Giemsa-stained thin blood smears”, Neural Comp & Application, 2018
N. Abbas, et al., ”Machine aided malaria parasitemia detection in Giemsa-stained thin blood smears”, Neural Comp & Application, 2018
2018
-
[17]
Recent Advances of Malaria Parasites Detection Systems Based on Mathematical Morphology
A. Loddo, C. Di Ruberto and M. Kocher. “Recent Advances of Malaria Parasites Detection Systems Based on Mathematical Morphology”, Sensors 2018
2018
-
[18]
N. E. Ross, C. J. Pritchard, D. M. Rubin and A. G. Duse, ”Automated image processing method for the diagnosis and classification of malaria on thin blood smears”, Med & Bio Engineering & Computing, 2006
2006
-
[19]
Motic Optical, https://www.motic.com
-
[20]
K. He, X. Zhang, S. Ren and J. Sun, ”Spatial pyramid pooling in deep convolutional networks for visual recognition”, ECCV , 2014
2014
-
[21]
Ren, et al., ”Faster R-CNN: Towards real-time object detection with region proposal networks”, Adv Neural Inf Process Syst , 2015
S. Ren, et al., ”Faster R-CNN: Towards real-time object detection with region proposal networks”, Adv Neural Inf Process Syst , 2015
2015
-
[22]
Liu, et al., ”SSD: Single shot multibox detector”, ECCV , 2016
W. Liu, et al., ”SSD: Single shot multibox detector”, ECCV , 2016
2016
-
[23]
Redmon, et al., ”You only look once: Unified, real-time object detection”, CVPR, 2016
J. Redmon, et al., ”You only look once: Unified, real-time object detection”, CVPR, 2016
2016
-
[24]
Pertuz, D
S. Pertuz, D. Puig and M. A. Garcia, ”Analysis of focus measure operators for shape-from-focus”, Pattern Recognit, 2013
2013
-
[25]
L. Kang, P. Ye, Y . Li and D. Doermann, ”Convolutional neural networks for no-reference image quality assessment”, CVPR, 2014
2014
-
[26]
M. Jaiswal, et al., ”Characterization of cervigram image sharpness using multiple self-referenced measurements and random forest classifiers”, Optics and Biophotonics in Low-Resource Settings IV , 2018
2018
-
[27]
Chen and C
T. Chen and C. Guestrin, ”XGBoost: A Scalable Tree Boosting System”, Proc 22nd ACM SIGKDD, San Francisco, 2016
2016
-
[28]
J. F. Brenner, et al., ”An automated microscope for cytologic research a preliminary evaluation”, Journal of Histochem & Cytochem, 1976
1976
-
[29]
LeCun, Y
Y . LeCun, Y . Bengio and G. Hinton, ”Deep learning”, Nature, 2015
2015
-
[30]
Litjens, et al., ”A survey on deep learning in medical image analysis”, Med Image Analysis, 2017
G. Litjens, et al., ”A survey on deep learning in medical image analysis”, Med Image Analysis, 2017
2017
-
[31]
Russakovsky, et al., ”ImageNet Large Scale Visual Recognition Competition”, International Journal of Computer Vision, 2015
O. Russakovsky, et al., ”ImageNet Large Scale Visual Recognition Competition”, International Journal of Computer Vision, 2015
2015
-
[32]
Szegedy, et al., ”Going Deeper with Convolutions”, CVPR, 2015
C. Szegedy, et al., ”Going Deeper with Convolutions”, CVPR, 2015
2015
-
[33]
J. T. Springenberg, A. Dosovitskiy, T. Brox and M. Riedmiller, ”Striving for simplicity: The all convolutional net”, arXiv:1412.6806, 2014
2014 arXiv
-
[34]
Simonyan and A
K. Simonyan and A. Zisserman, ”Very deep convolutional networks for large-scale image recognition”, arXiv:1409.1556, 2014
2014 arXiv
-
[35]
Jia, et al., ”Caffe: Convolutional architecture for fast feature embed- ding”, Proc ACM Intern’l Conf Multimedia, 2014
Y . Jia, et al., ”Caffe: Convolutional architecture for fast feature embed- ding”, Proc ACM Intern’l Conf Multimedia, 2014
2014
-
[36]
Glorot and Y
X. Glorot and Y . Bengio, ”Understanding the difficulty of training deep feedforward neural networks”, Proc 13th Intern’l Conf AI & Stats, 2010
2010
-
[37]
Epidemiology of malaria in endemic areas
B. Autino, A. Noris, R. Russo, F. Castelli, “Epidemiology of malaria in endemic areas”, Mediterr J Hematol Infect Diseases. 2012
2012
-
[38]
Haralick, K
R. Haralick, K. Shanmugam and D. Its’hak, ”Textural features for image classification”, IEEE Trans on Systems, Man, and Cybernetics, 1973
1973
-
[39]
Yosinski, J
J. Yosinski, J. Clune, Y . Bengio and H. Lipson, ”How transferable are features in deep neural networks?”, Adv Neural Inf Process Syst, 2014
2014
-
[40]
Malaria Microscopy Quality Assurance Manual - Ver2
WHO, “Malaria Microscopy Quality Assurance Manual - Ver2”, 2016
2016
-
[41]
Dhorda, WW ARN, Private Communication
M. Dhorda, WW ARN, Private Communication
-
[42]
White, ”The parasite clearance curve”, Malaria J, 2011
N. White, ”The parasite clearance curve”, Malaria J, 2011
2011
-
[43]
Automated microscopy for routine malaria diagnosis: a field comparison on Giemsa-stained blood films in Peru
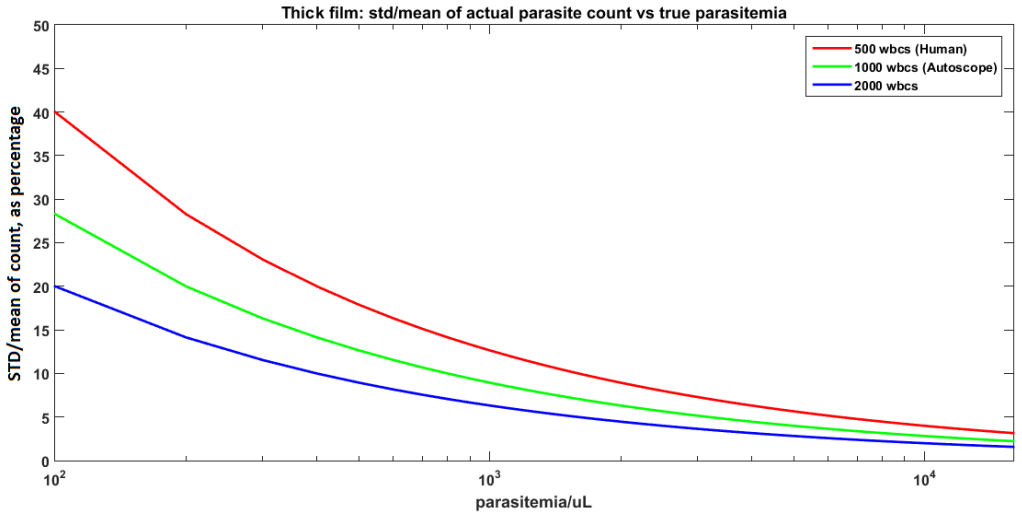
K. Torres et al., “Automated microscopy for routine malaria diagnosis: a field comparison on Giemsa-stained blood films in Peru”, Malaria J, 2018. Fig. 8. Irreducible Poisson error on thick films for P from 10/ µL to 16k/µL, at three values of N = # WBCs counted: 500 (red curve),...
2018
Reviewed August 14, 2026 · model on record in the stance chip above.
Discussion (0). Continue with ORCID to comment.