REVIEW 4 major objections 7 minor 23 references
DriveIndia: An Object Detection Dataset for Diverse Indian Traffic Scenes
T0 review · 4 major / 7 minor · reviewed 2026-08-06 · deepseek-v4-flash
Pith's one-line read DriveIndia contributes a 66,986-image object detection dataset for unstructured Indian traffic, with 24 classes and a best YOLOv8 baseline of 78.7% mAP50.
desk verdict A potentially valuable Indian traffic detection dataset, but the paper's central artifact isn't public yet and a split-count inconsistency needs to be fixed before trusting the numbers. read the letter →
The pith
A machine-rendered reading of the paper's core claim, the machinery that carries it, and where it could break.
The reading
What carries the argument
The load-bearing object is the dataset itself, together with its annotation and evaluation protocol. Images are recorded at 1920x1080 from vehicle-mounted cameras, annotated as normalized YOLO-format bounding boxes in per-image text files, and passed through a two-stage quality-assurance process, a Laplacian-variance blur filter, and class-distribution monitoring across splits. This protocol makes the dataset directly consumable by standard detectors, which is what allows the paper to report comparable baselines across YOLOv5, YOLOv8, YOLOv9, YOLOv11, RT-DETR, and EfficientDet and to attribute performance gaps to class frequency and visual ambiguity rather than to format or preprocessing differences.
What would settle it
Release the dataset, count the images and label files in each split, verify the per-class instance counts against Figure 3 and Table III, and retrain YOLOv8 with the stated protocol: matching the 78.7% mAP50 would confirm the central claims, while finding that the training split has 53,586 rather than 54,856 images, or that several classes have far fewer instances than reported, would falsify them.
Extended reading notes
Core claim
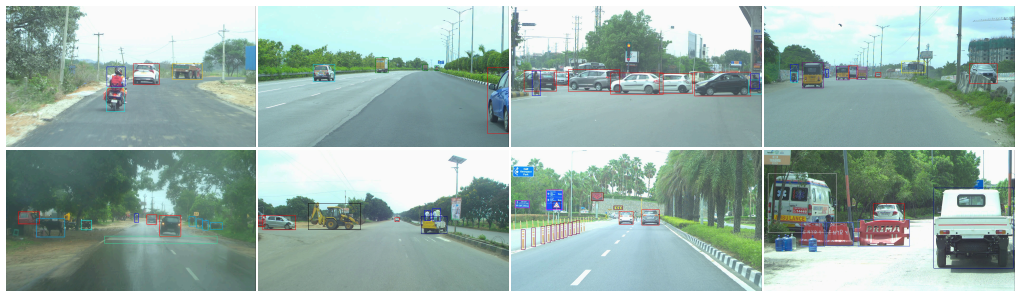
The central claim is that DriveIndia provides the largest publicly available object detection dataset focused on unstructured Indian traffic, with 66,986 images, 24 object classes, and approximately 471,092 labeled instances, organized into standard train/validation/test splits and compatible with standard detection frameworks. The dataset is designed around region-specific classes—autorickshaws, tractors, pushcarts, animals, speed bumps, potholes, and zebra crossings—that are absent or rare in international benchmarks, and it deliberately includes fog, rain, overcast skies, uneven lighting, and unmarked lanes. The paper further claims that the standardized benchmark results, with YOLOv8 as the strongest detector at 78.7% mAP50, establish usable baselines and reveal that common Indian road users such as cars, motorcycles, autorickshaws, and trucks are detected with high accuracy while rare, small, or visually ambiguous classes remain hard.
Load-bearing premise
The load-bearing premise is that the dataset exists exactly as described—66,986 annotated images with the stated splits and class distribution—but the paper itself gives conflicting training counts (53,586 in Section III.A versus 54,856 in Section IV.A), and the dataset is not publicly accessible at submission, so this description is unverified.
Editorial extensions
If this is right
- If the dataset is released as described, researchers get a common benchmark for real-time detection on Indian roads where cars, motorcycles, autorickshaws, pedestrians, animals, and road infrastructure coexist in one annotation format.
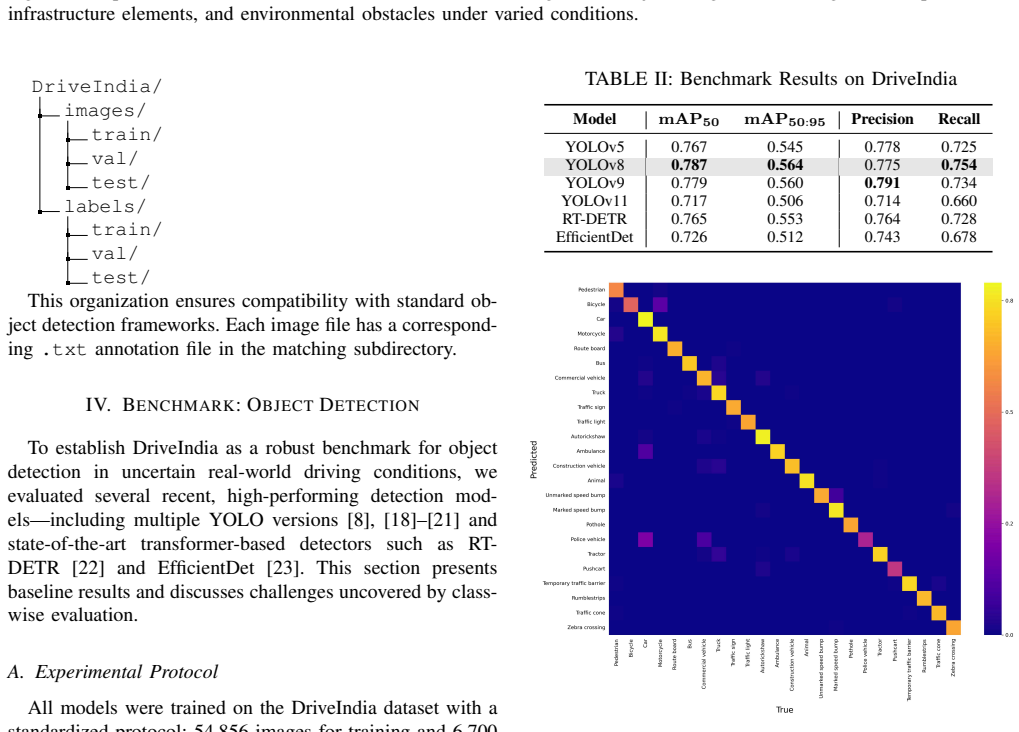
- The baseline tables give direct comparison points: any future detector should be measured against YOLOv8's 78.7% mAP50 and 56.4% mAP50:95 on the same splits.
- The per-class results define a concrete long-tail problem: rare safety-critical classes such as pothole, unmarked speed bump, police vehicle, and pushcart will need targeted augmentation or loss weighting before they can be considered usable.
- Because annotations are in YOLO format, the dataset can plug into existing training pipelines without conversion, making it a low-friction addition to detection research.
- The comparison to IDD, DATS, ITD, and BDD100K positions DriveIndia as a complement rather than a replacement: it adds fog, rain, and rural-highway coverage to the Indian landscape.
Reading between the lines
- If the training-split inconsistency (53,586 versus 54,856 images) is resolved before release, the benchmark's comparability will depend on exactly which split produced Table II; the paper should pin that down for anyone reproducing the numbers.
- Because night-time data is listed as absent, extending the collection protocol to night and to northern or hilly regions would directly test whether the geographic and illumination diversity claims generalize beyond southern India.
- A testable extension would be to train with class-balanced sampling or copy-paste augmentation and measure whether pothole and pushcart mAP rise without hurting common-class mAP.
- The release location and licensing terms will determine whether DriveIndia becomes a living community benchmark or a static snapshot; fixed splits and a permissive non-commercial license would make it usable for leaderboard-style comparison.
Editorial analysis
A structured set of objections, weighed in public.
Referee Report
Summary. The paper introduces DriveIndia, a proposed object detection dataset for Indian traffic scenes, consisting of 66,986 high-resolution (1920×1080) RGB images annotated in YOLO format across 24 classes, covering urban, rural, and highway driving in varied weather and lighting conditions. The authors evaluate YOLOv5, YOLOv8, YOLOv9, YOLOv11, RT-DETR, and EfficientDet on a train/val/test split, reporting YOLOv8 as the best with mAP50 78.7% and mAP50:95 56.4%. The dataset is to be made publicly available through the TiHAN-IIT Hyderabad portal.
Significance. DriveIndia addresses a relevant gap: existing Indian driving datasets are smaller or limited to specific tasks or conditions, and international benchmarks do not capture the heterogeneity of Indian traffic. If released as described, the dataset would be a substantial resource for detection research in developing regions, with useful annotation guidelines, explicit discussion of long-tail classes, and an honest limitations section. The paper provides machine-checked claims only in a limited sense; the quantitative results are measurements on the authors' private data, so reproducibility currently rests on the planned public release. The class-wise analysis and the comparison with existing datasets are valuable contributions.
major comments (4)
- [Section III.A and Section IV.A] Section III.A states the dataset is split into 53,586 training, 6,700 validation, and 6,700 test images, which sum to the stated total of 66,986. Section IV.A states that 54,856 images were used for training with 6,700 each for validation and test, which would sum to 68,256 images. These counts are inconsistent and no explanation is given. Because the dataset is not yet publicly accessible, a reader cannot verify which number is correct; this affects both the headline scale claim and the benchmark protocol. Please correct the discrepancy and make every occurrence of split sizes consistent.
- [Section V and Section I] Section V says the dataset 'will be publicly released' and the Introduction lists as a contribution the 'largest publicly available object detection dataset,' yet no download link or archived release is provided at submission. For a dataset paper the artifact is the central claim, so the current description makes the benchmark prospective rather than verifiable. Please provide the actual hosting location or a clearly dated release plan, and adjust the wording in Section I from 'publicly available' to 'to be released' until the artifact is accessible.
- [Section IV.A and Table III] The experimental protocol in Section IV.A states that 'Model performance was assessed on the test set,' but Table III is captioned 'Per-class detection performance on the DriveIndia Validation set.' The paper also does not state which split was used for Fig. 4 (example detections) or Fig. 5 (confusion matrix). This ambiguity matters because the class-wise analysis is used to draw conclusions about long-tail performance; please clarify whether per-class numbers are from validation or test and, if both are used, report them separately.
- [Section IV.A] The 'standardized protocol' is never specified quantitatively: the paper gives no image resolution used for training, batch size, optimizer, learning rate, number of epochs, augmentation strategy, or inference settings for any of the YOLO/RT-DETR/EfficientDet models. Without these details the baseline numbers in Table II cannot be reproduced or meaningfully compared across models. Please include the full training protocol and any configuration files or code in an appendix or supplementary material.
minor comments (7)
- [Table I] Table I lists the task type for IDD as '3D Object Detection'; the original IDD dataset is primarily for 2D detection and semantic segmentation, while IDD-3D is the 3D variant. Please correct this to avoid misrepresenting the compared dataset.
- [Section II] EfficientDet is described as a 'transformer-based detector' in Section II and Section IV; EfficientDet is based on a CNN backbone with a BiFPN feature network, not a transformer. Please correct the description.
- [Section III.D] The Laplacian variance threshold of 20 is stated without specifying the image scale or preprocessing; please clarify how the threshold was applied to the 1920×1080 images.
- [Section III.B and Fig. 3] Fig. 3 shows the class frequency distribution but is not discussed in the text; add a sentence summarizing the long-tail distribution, as it is central to the motivation for the rare classes.
- [Section VII] In the bullet 'Sparse Representation of Rare Classes:' there is a missing space after the colon ('Classes:Safety-critical'). Please fix the typo.
- [Abstract and Section III.A] The abstract reports '120+ hours' and '3,400+ kilometers' of driving, but these figures are not repeated in Section III.A; align the numbers between the abstract and the dataset overview.
- [Reference [9] and Section V] Reference [9] points to the 'tiand-datasets' URL while Section V links to the general TiHAN dataset portal (tihan.iith.ac.in/TiAND.html); please make the dataset URL consistent and ensure the exact release location is given.
Circularity Check
No circular derivation found: the baselines are direct measurements on the proposed dataset, so there is no reduction of outputs to inputs by construction.
full rationale
DriveIndia is a dataset paper: its central outputs (66,986 images, 471,092 instances, 24 classes, and the Table II/III detector scores) are reported descriptions of the artifact and empirical measurements on it, not derivations from a fitted model or from the dataset definition itself. The YOLO baselines were trained and then evaluated on held-out test images, so their mAP values are external to any claim being proven; there is no equation in the paper in which a predicted quantity equals its defining input by construction. The comparison numbers for IDD, DATS, ITD, and BDD100K are imported from prior external work and are not used to force DriveIndia's own numbers. The internal inconsistency between Section III.A's 53,586 training images and Section IV.A's 54,856 training images, and the prospective 'will be publicly released' availability statement, are verification and correctness concerns rather than circularity: they do not make any result identical to its premise. No load-bearing self-citation chain or uniqueness theorem is invoked. Accordingly, the correct finding is no significant circularity (score 0).
Assumptions & free parameters
free parameters (3)
- Laplacian variance threshold for blur filtering =
20
- Minimum object visibility for labeling =
50%
- Train/validation/test split ratio =
80/10/10 (53,586/6,700/6,700 in Section III; 54,856/6,700/6,700 in Section IV.A)
assumptions (4)
- domain assumption The dataset annotations accurately reflect ground-truth objects in the images
- domain assumption The collected images genuinely represent diverse weather and lighting conditions as claimed
- domain assumption The dataset will be publicly released via the TiHAN repository
- domain assumption Standard detection metrics are comparable across datasets
Cite this review
Pith. "Pith review of DriveIndia: An Object Detection Dataset for Diverse Indian Traffic Scenes." pith.science (2026). https://pith.science/paper/NGI4I5UD
@misc{pith2026250719912,
  author       = {Pith},
  title        = {Pith review of: DriveIndia: An Object Detection Dataset for Diverse Indian Traffic Scenes},
  year         = {2026},
  howpublished = {\url{https://pith.science/paper/NGI4I5UD}},
  note         = {Machine review of arXiv:2507.19912}
}
read the original abstract
We introduce DriveIndia, a large-scale object detection dataset purpose-built to capture the complexity and unpredictability of Indian traffic environments. The dataset contains 66,986 high-resolution images annotated in YOLO format across 24 traffic-relevant object categories, encompassing diverse conditions such as varied weather (fog, rain), illumination changes, heterogeneous road infrastructure, and dense, mixed traffic patterns and collected over 120+ hours and covering 3,400+ kilometers across urban, rural, and highway routes. DriveIndia offers a comprehensive benchmark for real-world autonomous driving challenges. We provide baseline results using state-of-the-art YOLO family models, with the top-performing variant achieving a mAP50 of 78.7%. Designed to support research in robust, generalizable object detection under uncertain road conditions, DriveIndia will be publicly available via the TiHAN-IIT Hyderabad dataset repository https://tihan.iith.ac.in/TiAND.html (Terrestrial Datasets -> Camera Dataset).
Figures


Figures from the paper (1 more)
Reference graph
Works this paper leans on
-
[1]
Are we ready for autonomous driving? the kitti vision benchmark suite,
A. Geiger, P. Lenz, and R. Urtasun, “Are we ready for autonomous driving? the kitti vision benchmark suite,” in 2012 IEEE Conference on Computer Vision and Pattern Recognition (CVPR) . IEEE, June 2012, pp. 3354–3361
work page 2012
-
[2]
nuscenes: A multimodal dataset for autonomous driving,
H. Caesar, V . Bankiti, A. H. Lang, S. V ora, V . E. Liong, Q. Xu, A. Krishnan, Y . Pan, G. Baldan, and O. Beijbom, “nuscenes: A multimodal dataset for autonomous driving,” 2020. [Online]. Available: https://arxiv.org/abs/1903.11027
arXiv 2020
-
[3]
Idd: A dataset for exploring problems of autonomous navigation in unconstrained environments,
G. Varma, A. Subramanian, A. Namboodiri, M. Chandraker, and C. V . Jawahar, “Idd: A dataset for exploring problems of autonomous navigation in unconstrained environments,” in 2019 IEEE Winter Conference on Applications of Computer Vision (WACV) . IEEE, January 2019, pp. 1743–1751
work page 2019
-
[4]
Idd-3d: Indian driving dataset for 3d unstructured road scenes,
S. Dokania, A. H. A. Hafez, A. Subramanian, M. Chandraker, and C. V . Jawahar, “Idd-3d: Indian driving dataset for 3d unstructured road scenes,” in Proceedings of the IEEE/CVF Winter Conference on Applications of Computer Vision (WACV) , January 2023, pp. 4482– 4491
work page 2023
-
[5]
Dats 2022: A versatile indian dataset for object detection in unstructured traffic conditions,
B. A. Paranjape and A. A. Naik, “Dats 2022: A versatile indian dataset for object detection in unstructured traffic conditions,” Data in Brief , vol. 43, p. 108470, 2022
work page 2022
-
[6]
N. G. S. S. Srinath, A. Z. Joseph, S. Umamaheswaran, C. L. Priyanka, M. Nair, and P. Sankaran, “Nitcad-developing an object detection, classification and stereo vision dataset for autonomous navigation in indian roads,” Procedia Computer Science , vol. 171, pp. 207–216, 2020
work page 2020
-
[7]
Tiand: A multimodal dataset for autonomy on indian roads,
N. Kumar, A. S, A. Thakur, O. Gopi, A. Dasgupta, A. Algole, B. Anand, V . S. Mutnuri, S. Reddy, N. P. B. Mannam, S. Saripalli, and R. Pachamuthu, “Tiand: A multimodal dataset for autonomy on indian roads,” in 2024 IEEE Intelligent Vehicles Symposium (IV) , 2024, pp. 688–694
work page 2024
-
[8]
You only look once: Unified, real-time object detection,
J. Redmon, S. Divvala, R. Girshick, and A. Farhadi, “You only look once: Unified, real-time object detection,” 2016. [Online]. Available: https://arxiv.org/abs/1506.02640
arXiv 2016
Show all 23 references
-
[9]
Tihan autonomous navigation dataset repository,
I. H. TiHAN, “Tihan autonomous navigation dataset repository,” 2024, accessed: April 30, 2025. [Online]. Available: https://tihan.iith. ac.in/tiand-datasets/
2024
-
[10]
The cityscapes dataset for semantic urban scene understanding,
M. Cordts, M. Omran, S. Ramos, T. Rehfeld, M. Enzweiler, R. Benen- son, U. Franke, S. Roth, and B. Schiele, “The cityscapes dataset for semantic urban scene understanding,” in Proc. of the IEEE Conference on Computer Vision and Pattern Recognition (CVPR) , 2016
2016
-
[11]
Bdd100k: A diverse driving dataset for heterogeneous multitask learning,
F. Yu, H. Chen, X. Wang, W. Xian, Y . Chen, F. Liu, V . Madhavan, and T. Darrell, “Bdd100k: A diverse driving dataset for heterogeneous multitask learning,” in Proceedings of the IEEE/CVF Conference on Computer Vision and Pattern Recognition (CVPR) , 2020, pp. 2633–2642. [Onli...
2020
-
[12]
Itd: Indian traffic dataset for intelligent transportation systems,
A. Agarwal, A. Thombre, K. Kedia, and I. Ghosh, “Itd: Indian traffic dataset for intelligent transportation systems,” in 2024 16th International Conference on COMmunication Systems & NETworkS (COMSNETS). IEEE, January 2024, pp. 842–850
2024
-
[13]
Perfor- mance comparison of different cnn models for indian road dataset,
A. Mukhopadhyay, P. Biswas, A. Agarwal, and I. Mukherjee, “Perfor- mance comparison of different cnn models for indian road dataset,” in Proceedings of the 3rd International Conference on Graphics and Signal Processing, June 2019, pp. 29–33
2019
-
[14]
Comparative study of deep learning models for vehicle detection in an unconstrained road scenario,
J. Sehgal, M. Sharma, J. Chatterjee, and A. Mehra, “Comparative study of deep learning models for vehicle detection in an unconstrained road scenario,” in 2020 International Conference on Communication and Signal Processing (ICCSP) . IEEE, July 2020, pp. 1076–1080
2020
-
[15]
Labelimg: Label image tool,
Tzutalin, “Labelimg: Label image tool,” https://github.com/ HumanSignal/labelImg, 2015, accessed: April 30, 2025
2015
-
[16]
Analysis of focus measure operators for shape-from-focus,
S. Pertuz, D. Puig, and M. A. Garcia, “Analysis of focus measure operators for shape-from-focus,” Pattern Recognition, vol. 46, no. 5, pp. 1415–1432, 2013
2013
-
[17]
The effect of improving annotation quality on object detection datasets: A preliminary study,
J. Heller, J.-H. Won, K. Saenko, L. Castrejon, and M. Schmidt, “The effect of improving annotation quality on object detection datasets: A preliminary study,” in Proceedings of the IEEE/CVF Conference on Computer Vision and Pattern Recognition Workshops (CVPRW), 2020
2020
-
[18]
Ultralytics yolov5,
G. Jocher, “Ultralytics yolov5,” 2020. [Online]. Available: https: //github.com/ultralytics/yolov5
2020
-
[19]
Ultralytics yolov8,
G. Jocher, A. Chaurasia, and J. Qiu, “Ultralytics yolov8,” 2023. [Online]. Available: https://github.com/ultralytics/ultralytics
2023
-
[20]
Yolov9: Learning what you want to learn using programmable gradient information,
C.-Y . Wang and H.-Y . M. Liao, “Yolov9: Learning what you want to learn using programmable gradient information,” 2024
2024
-
[21]
Ultralytics yolo11,
G. Jocher and J. Qiu, “Ultralytics yolo11,” 2024. [Online]. Available: https://github.com/ultralytics/ultralytics
2024
-
[22]
Detrs beat yolos on real-time object detection,
Y . Zhao, W. Lv, S. Xu, J. Wei, G. Wang, Q. Dang, Y . Liu, and J. Chen, “Detrs beat yolos on real-time object detection,” 2023
2023
-
[23]
Efficientdet: Scalable and efficient object detection,
M. Tan, R. Pang, and Q. V . Le, “Efficientdet: Scalable and efficient object detection,” 2020. [Online]. Available: https://arxiv.org/abs/ 1911.09070
2020 arXiv
Reviewed August 6, 2026 · model on record in the stance chip above.
Discussion (0). Continue with ORCID to comment.