REVIEW 3 major objections 5 minor 39 references
The Partial Response Network: a neural network nomogram
T0 review · 3 major / 5 minor · reviewed 2026-08-14 · deepseek-v4-flash
Pith's one-line read The Partial Response Network rewrites a trained multilayer perceptron as a sparse additive model of one- and two-variable effects, matching black-box accuracy while making every effect visible in a nomogram.
desk verdict A useful but not fully verified recipe for converting an MLP into a sparse additive nomogram; the main claim outruns the evidence. read the letter →
The pith
A machine-rendered reading of the paper's core claim, the machinery that carries it, and where it could break.
The reading
What carries the argument
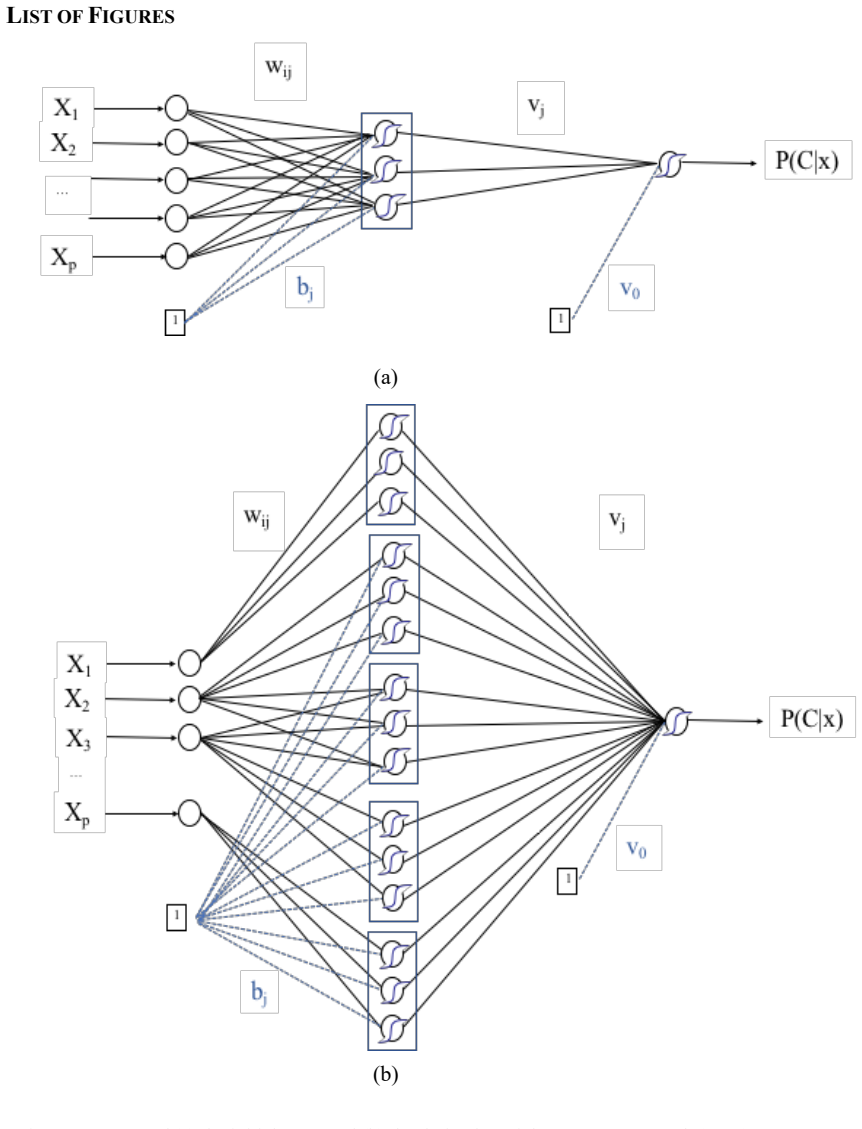
The machinery is the functional ANOVA decomposition of the logit, anchored at the median of the data. Each partial response is computed by holding all other inputs at the anchor: the univariate term for $x_i$ is the logit at $(0,\ldots,x_i,\ldots,0)$ minus the anchor logit, and the bivariate term for $(x_i,x_j)$ subtracts the two univariate terms and the anchor. The paper emphasises that these terms add back up to the exact logit, so interpretability is not bought by a local Taylor expansion. The logistic Lasso then selects which partial responses are statistically meaningful, and the selected terms are re-expressed as a GANN/SENN by copying the hidden weights of the original MLP and rescaling the output weights and biases according to equations (18)--(23), so the structured network's initial output exactly matches the Lasso fit. A final pass of gradient descent recalibrates the component functions without the removed variables and interactions, which the paper argues further smooths the curves and can improve accuracy.
What would settle it
Construct or find a tabular classification problem with an essential three-way interaction, train an MLP, and apply the PRN pipeline; if the PRN's holdout AUROC falls clearly below the original MLP's, the truncation hypothesis is false for that setting. A broader version is a benchmark sweep measuring the PRN-minus-MLP AUROC gap across many datasets to estimate how often the truncation holds.
Extended reading notes
Core claim
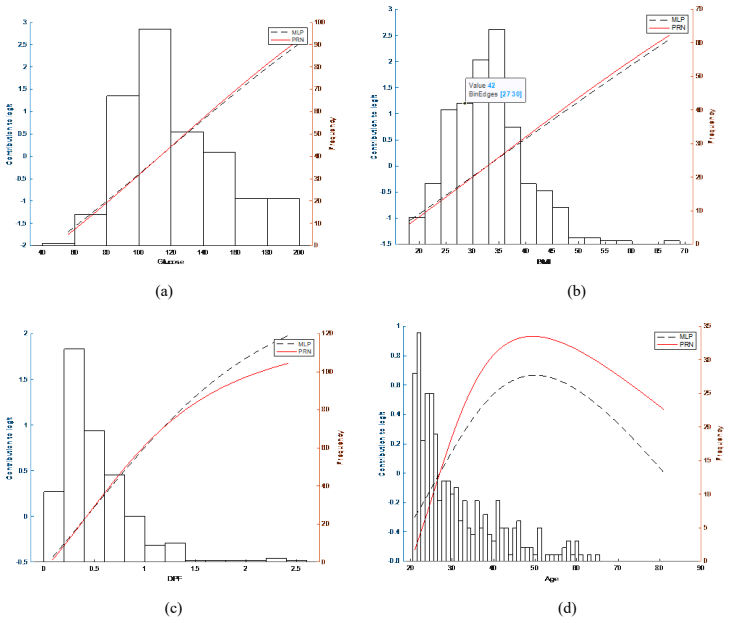
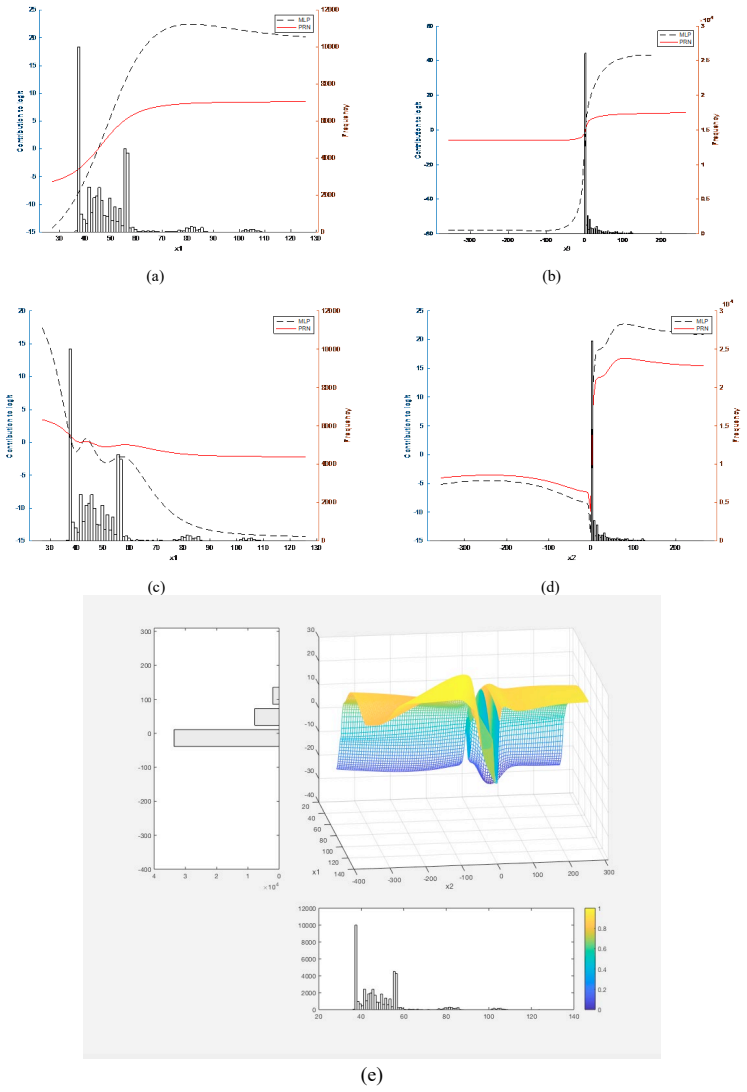
The paper's central claim is that a fully connected MLP for binary classification does not have to be treated as a black box. The functional ANOVA decomposition of its logit is an identity, not a local approximation: it holds at every point in input space and decomposes the logit into a sum of a constant, univariate terms, bivariate terms, and higher-order interactions. The authors hypothesise that the higher-order interactions can be truncated without compromising performance, and the experiments support that hypothesis on the benchmarks considered. What remains is a sparse additive model whose components, the partial responses, are selected by a logistic Lasso and then assembled into a Generalised Additive Neural Network, a self-explaining network whose output-layer weights are rescaled copies of the original MLP weights. After a short gradient-descent recalibration, the resulting PRN is claimed to be exactly as transparent as logistic regression while matching or exceeding the original MLP's AUROC; on the Shuttle data it reaches AUROC 1.000 from just two variables and one two-way interaction.
Load-bearing premise
The load-bearing premise is that the ANOVA decomposition of a trained MLP's logit can be truncated to univariate and bivariate terms without a meaningful loss of classification performance.
Editorial extensions
If this is right
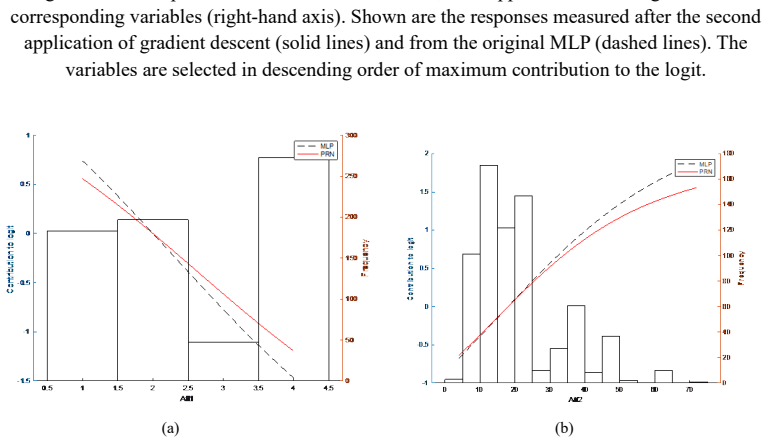
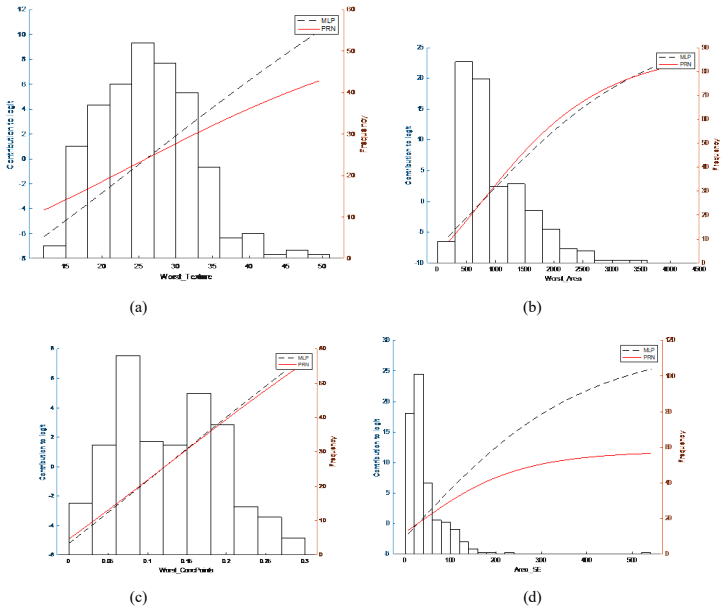
- Users of tabular classifiers can obtain a global nomogram showing how each variable and pair of variables shifts the log-odds, not just a local explanation around one test point.
- GANN architecture is inferred from data: the logistic Lasso over partial responses decides which univariate and bivariate terms to keep, removing the need for predefined structure or prior feature selection.
- The PRN can outperform the original MLP on the same data, because dropping noisy higher-order interactions acts like signal denoising rather than a loss of information.
- Bivariate terms are sufficient to capture real interactions, as in the Shuttle example where two variables plus one two-way interaction reach perfect AUROC.
- The method is stable: random restarts of the MLP produce almost identical partial responses and consistent selected structure.
Reading between the lines
- The same ANOVA-plus-Lasso recipe could be applied to other probabilistic base classifiers, for instance probabilistic support vector machines or gradient-boosted probability models, to give them the same nomogram-style explanations.
- If the stability across random seeds extends beyond the benchmarks, the PRN could be used as a diagnostic for whether a black-box MLP has learned spurious high-order structure: effects that disappear under truncation are likely noise.
- The Lasso coefficients on partial responses may be interpretable as odds-ratio weights, which would let clinicians quote adjusted odds ratios for continuous variables directly from the network.
Signed reviews
Editorial analysis
A structured set of objections, weighed in public.
Referee Report
Summary. The paper proposes the Partial Response Network (PRN), a method that starts from a trained multilayer perceptron (MLP), decomposes its logit using a functional ANOVA representation anchored at the median, truncates the decomposition to univariate and bivariate terms, and applies a logistic Lasso for feature selection. The selected partial responses are then replicated as a generalized additive neural network / self-explaining neural network, which can be retrained and optionally re-pruned. The authors claim that the PRN is as transparent as logistic regression and achieves comparable or superior classification performance to the original MLP on five UCI datasets plus the Statlog Shuttle dataset.
Significance. If the central claim is validated, the PRN would be a practically useful bridge between flexible neural-network classifiers and globally interpretable additive models, offering sparse feature selection and a nomogram-like visualization of univariate and bivariate effects. The paper has several genuine strengths: identity (1) and the recursive construction (14)-(17) are exact by design; the weight-replication equations (18)-(23) are explicit and testable; the empirical section compares against strong baselines including SAM, GBM, SVM, and RF; and the reported stability across random initializations is encouraging. The main reservations are that the truncation hypothesis is an empirical assumption supported only by low-dimensional benchmark data, and that the stated orthogonality of the anchored decomposition is not generally correct.
major comments (3)
- [Section 2, Eqs. (14)-(17)] The claim that the decomposition terms are 'orthogonal in a functional sense' and can be regarded as independent effects is not correct for the components defined in Eqs. (14)-(16). These are point-anchored (cut-HDMR) components obtained by setting all other variables to zero, not the measure-based orthogonal ANOVA components discussed in [19]. In the standard functional ANOVA, components are typically defined through conditional expectations and satisfy zero-integral conditions, which do not generally hold for the anchored recursion. The Lasso is applied to these components, so the selection and the interpretation of each partial response as an independent effect depend on the actual correlations among components. I recommend either replacing the anchored components with measure-based orthogonal ANOVA components or explicitly reframing the method as an anchored decomposition and removing the orthogonality/independence interpretation.
- [Section 2, truncation hypothesis; Section 3, Tables 1-2] The central claim that the decomposition can be truncated to univariate and bivariate terms 'without compromising performance' rests on an untested empirical assumption. The paper's own wording calls this a hypothesis, but the validation is limited to five UCI datasets plus Shuttle, all comparatively low-dimensional and known to be well approximated by low-order structure; there is no synthetic or real dataset in which higher-order interactions are known to be essential. In a regime where a third-order or higher interaction is required, the anchored univariate and bivariate components can be arbitrarily close to zero, and the PRN could collapse to a constant while the MLP retains discriminative power. I ask the authors to add a diagnostic for the magnitude of the discarded higher-order terms and to include at least one experiment (e.g., synthetic data with a controlled interaction order) that characterizes when truncation fails, or to soften the 'fully interpretable representation' claim accordingly.
- [Section 3, Table 1 and McNemar statement] The sentence stating that performance differences are not significant at the 5% level via the McNemar test is unsupported by any reported test statistic, p-value, or description of how the test was applied across the ten random initializations. The reported standard deviations for the PRN are very small relative to the MLP, but it is unclear whether the ten runs vary the MLP initialization on a single fixed split or also vary the split; the text describes a fixed split for Pima but not consistently for the other datasets. This information is needed to assess the 'comparable or superior performance' claim.
minor comments (5)
- [Section 1.1 and References] The citation for Generalized Additive Models appears to be incorrect: the text says 'Generalized Additive Models (GAMs) [11]', but reference [11] is the Sparse Additive Model paper by Ravikumar et al.; the GAM citation should likely be [10] or another appropriate source.
- [Section 2.2] The term 'logistic Lasso' is cited to [21], which is the group lasso for logistic regression; the text later refers to 'group Lasso' in the Discussion. Please clarify whether a standard Lasso or a group Lasso is used for the partial responses, since this affects the theoretical justification and implementation.
- [Eq. (17) and surrounding text] The notation in Eq. (17) is ambiguous: the summation over subsets '{i1,...,in-1}' should specify that the sum runs over all proper subsets of the index set, and the notation in Eq. (1) for pairs should be i<j rather than i≠j to avoid double-counting.
- [Section 3, Tables 1-2] No confidence intervals or standard errors of the AUROC differences are reported, and the claim that PRN 'often selects fewer variables than SAM' is not quantified in a table; please add the selected-feature counts for each dataset and method.
- [General] There are numerous typographical errors, including 'univatiate', 'wtih', 'explitic', 'trunctated', 'ANOV A', 'inonosphere', and 'witb'; a thorough proofreading pass is needed.
Circularity Check
No circularity: the PRN rests on an exact ANOVA identity plus held-out empirical validation, not on fitting the target result into its inputs.
full rationale
The derivation chain is self-contained. Equation (1) is presented as an identity, and equations (14)-(17) recursively define the partial responses so that their sum exactly reproduces the MLP logit; this is a mathematical decomposition, not a fitted prediction. The truncation to univariate and bivariate terms is explicitly stated as a hypothesis ('for interpretability we make the hypothesis that it is possible to truncate (1) and retain only univariate and bivariate terms without compromising performance'), and the paper's central empirical claim is supported by AUROC measured on held-out test partitions in Tables 1 and 2, including comparisons with GBM, SVM, RF, and SAM. The GANN/SENN replication equations (18)-(23) initialize the structured network to reproduce the Lasso solution, but that is an implementation step rather than the evidence for the paper's claims. The self-citation to prior nomogram work [18] is contextual related work and is not load-bearing: no argument in the present paper reduces to an unverified claim from that citation. There is a possible technical concern that the median-anchored recursive components are not orthogonal in the functional-ANOVA sense of [19], but that would be a correctness or identifiability issue, not circularity, since the components are still defined directly from the MLP and evaluated on independent test data.
Assumptions & free parameters
free parameters (4)
- Anchor point for ANOVA decomposition =
Median of each variable after normalization to zero median and unit standard deviation
- Lasso regularization parameter lambda =
Not reported explicitly; presumably chosen by cross-validation
- MLP architecture and ARD hyperparameters =
Not specified in the paper
- Retraining hyperparameters (learning rate, weight decay, epochs) =
Not specified in the paper
assumptions (4)
- domain assumption The logit of the MLP can be truncated to univariate and bivariate ANOVA terms without compromising performance.
- domain assumption The ANOVA terms are orthogonal in a functional sense and can be treated as independent inputs for the Lasso.
- domain assumption The MLP trained with ARD is a sufficiently accurate and smooth estimator of the true logit.
- domain assumption The logistic Lasso applied to partial responses yields a sparse set of effects that generalize.
Cite this review
Pith. "Pith review of The Partial Response Network: a neural network nomogram." pith.science (2026). https://pith.science/paper/NGQ57YKB
@misc{pith2026190805978,
  author       = {Pith},
  title        = {Pith review of: The Partial Response Network: a neural network nomogram},
  year         = {2026},
  howpublished = {\url{https://pith.science/paper/NGQ57YKB}},
  note         = {Machine review of arXiv:1908.05978}
}
read the original abstract
Among interpretable machine learning methods, the class of Generalised Additive Neural Networks (GANNs) is referred to as Self-Explaining Neural Networks (SENN) because of the linear dependence on explicit functions of the inputs. In binary classification this shows the precise weight that each input contributes towards the logit. The nomogram is a graphical representation of these weights. We show that functions of individual and pairs of variables can be derived from a functional Analysis of Variance (ANOVA) representation, enabling an efficient feature selection to be carried by application of the logistic Lasso. This process infers the structure of GANNs which otherwise needs to be predefined. As this method is particularly suited for tabular data, it starts by fitting a generic flexible model, in this case a Multi-layer Perceptron (MLP) to which the ANOVA decomposition is applied. This has the further advantage that the resulting GANN can be replicated as a SENN, enabling further refinement of the univariate and bivariate component functions to take place. The component functions are partial responses hence the SENN is a partial response network. The Partial Response Network (PRN) is equally as transparent as a traditional logistic regression model, but capable of non-linear classification with comparable or superior performance to the original MLP. In other words, the PRN is a fully interpretable representation of the MLP, at the level of univariate and bivariate effects. The performance of the PRN is shown to be competitive for benchmark data, against state-of-the-art machine learning methods including GBM, SVM and Random Forests. It is also compared with spline-based Sparse Additive Models (SAM) showing that a semi-parametric representation of the GAM as a neural network can be as effective as the SAM though less constrained by the need to set spline nodes.
Figures
Figures from the paper (4 more)


Reference graph
Works this paper leans on
-
[19]
which involves a Taylor expansion of 𝑆𝑆(𝑤𝑤, 𝛼𝛼) = −𝑆𝑆𝑤𝑤 − 𝐸𝐸(𝑤𝑤, 𝛼𝛼) about the current operating point S* located at the current point values of the weights, referred to as the most probable weights for the current instance of the network, wMP,by evaluating the Hessian 𝐴𝐴 = ∇∇𝑆𝑆(𝑤𝑤𝑀𝑀𝑃𝑃, 𝛼𝛼) : 𝑆𝑆∗(w, α) ≈ S(𝑤𝑤𝑀𝑀𝑃𝑃, α) + 1 2 (𝑤𝑤 − 𝑤𝑤𝑀𝑀𝑃𝑃)A(𝑤𝑤 − 𝑤𝑤𝑀𝑀𝑃𝑃) . (1...
-
[1]
Univariate partial response corresponding to input Xi This is shown in fig.1. (b) for input X1. Zero inputs for all other inputs will not contriubute to the activation of the hidden nodes. The hidden layer weights w1j connected to node X1 remain the same as in the original MLP but the weights and bias to the output node need to be adjusted as follows: 𝑣𝑣𝑖...
-
[2]
Bivariate partial response for input pair {Xk ,Xl} This is shown in fig.1. (b) for inputs X2 and X3. This time, in order to replicate the partial response multiplied by the Lasso coefficient, it is necessary to add three elements to the structure, namely, a univariate partial response for each of the inputs involved and a coupled network that both inputs ...
-
[3]
Finally, an amount is added to the sum total of the values calculated for the bias term in the structured neural network. This amount is equal to the intercept of the logistic Lasso, β0. Two matters are worthy of note. First, if an individual variable is present in both univariate and bivariate effects then the weights for the univariate networks are adde...
work page 1989
-
[4]
S.G. Schnyder, J. Despraz, C.A. Peña-Reyes, Improving Neural Network Interpretabil- ity via Rule Extraction, in: Int. Conf. Artif. Neural Networks (ICANN). Lect. Notes Comput. Sci. V ol. 11139-11141., Rhodes, 2018
work page 2018
-
[5]
C. Rudin, Stop explaining black box machine learning models for high stakes deci- sions and use interpretable models instead, Nat. Mach. Intell. 1 (2019) 206–215. https://doi.org/10.1038/s42256-019-0048-x
-
[6]
E. Christodoulou, J. Ma, G.S. Collins, E.W. Steyerberg, J.Y . Verbakel, B.Van Calster, A systematic review shows no performance benefit of machine learning over logistic regression for clinical prediction models, J. Clinical Epidemiology, 10 (2019):12-22
work page 2019
-
[7]
T. Rögnvaldsson, T.A. Etchells, L. You, D. Garwicz, I. Jarman, P.J.G. Lisboa, How to find simple and accurate rules for viral protease cleavage specificities, BMC Bioinfor- matics. 10 (2009) 149. https://doi.org/10.1186/1471-2105-10-149
Show all 39 references
-
[8]
Ruiz, T.A
H. Ruiz, T.A. Etchells, I.H. Jarman, J.D. Martín, P.J.G. Lisboa, A principled approach to network-based classification and data representation, Neurocomputing. 112 (2013) 79–91. https://doi.org/10.1016/j.neucom.2012.12.050
2013 doi
-
[9]
Lundberg, S.-I
S. Lundberg, S.-I. Lee, A Unified Approach to Interpreting Model Predictions, in: I. Guyon, U. V . Luxburg, S. Bengio, H. Wallach, R. Fergus, S. Vishwanathan, R.Garnett (Eds.), Adv. Neural Inf. Process. Syst. 30, 2017: pp. 4765–4774
2017
-
[10]
Why Should I Trust You?,
M.T. Ribeiro, S. Singh, C. Guestrin, “Why Should I Trust You?,” in: Proc. 22nd ACM 16 SIGKDD Int. Conf. Knowl. Discov. Data Min. - KDD ’16, ACM Press, New York, New York, USA, 2016: pp. 1135–1144. https://doi.org/10.1145/2939672.2939778
2016
-
[11]
Z. Zhou, H. Cai, S. Rong, Y . Song, K. Ren, W. Zhang, Y . Y u, J. Wang, Activation Maximization Generative Adversarial Nets, ArXiv:1703.02000 [Cs.LG]. (2017). http://arxiv.org/abs/1703.02000
2017 arXiv
-
[12]
Greenshtein, Y
E. Greenshtein, Y . Ritov, Persistence in high-dimensional linear predictor selection and the virtue of overparametrization, Bernoulli. 10 (2004) 971–988. https://doi.org/10.3150/bj/1106314846
2004
-
[13]
Alvarez-Melis, T.S
D. Alvarez-Melis, T.S. Jaakkola, Towards Robust Interpretability with Self-Explaining Neural Networks, in: 32nd Conf. Neural Inf. Process. Syst. (NeurIPS 2018), Montréal, Canada, 2018
2018
-
[14]
Y . Lou, R. Caruana, and J. Gehrke, Intelligible models for classification and regres- sion. In Proceedings of the 18th ACM SIGKDD International Conference on Knowledge Discovery and Data Mining (KDD’12), ACM,:150–158 (2012)
2012
-
[15]
Ravikumar, J
P. Ravikumar, J. Lafferty, H. Liu, L. Wasserman, Sparse additive models, J. R. Stat. Soc. Ser. B (Statistical Methodol. 71 (2009) 1009–1030. https://doi.org/10.1111/j.1467-9868.2009.00718.x
2009
-
[16]
Brás-Geraldes, A
C. Brás-Geraldes, A. Papoila, P. Xufre, Odds ratio function estimation using a general- ized additive neural network, Neural Comput. Appl. (2019). https://doi.org/10.1007/s00521-019-04189-7
2019 doi
-
[17]
Tibshirani, Regression Shrinkage and Selection Via the Lasso, J
R. Tibshirani, Regression Shrinkage and Selection Via the Lasso, J. R. Stat. Soc. B. 58 (1996) 267–288. https://doi.org/10.2307/2346178
1996 doi
-
[18]
Sarle, Neural Networks and Statistical Models, SAS USers Gr
W.S. Sarle, Neural Networks and Statistical Models, SAS USers Gr. Int. Conf. (1994). https://doi.org/10.1.1.27.699
1994
-
[20]
de Waal, J
D.A. de Waal, J. V . du Toit, Automation of Generalized Additive Neural Networks for Predictive Data Mining, Appl. Artif. Intell. 25 (2011) 380–425. https://doi.org/10.1080/08839514.2011.570156
2011
-
[21]
Cadarso-Suárez, J
C. Cadarso-Suárez, J. Roca-Pardiñas, A. Figueiras, W. González-Manteiga, Non-para- metric estimation of the odds ratios for continuous exposures using generalized addi- tive models with an unknown link function, Stat. Med. 24 (2005) 1169–1184. https://doi.org/10.1002/sim.1978
2005 doi
-
[22]
Van Belle, B
V . Van Belle, B. Van Calster, S. Van Huffel, J.A.K. Suykens, P. Lisboa, Explaining Support Vector Machines: A Color Based Nomogram, PLoS One. 11 (2016) e0164568. https://doi.org/10.1371/journal.pone.0164568
2016 doi
-
[23]
Hooker, Generalized Functional ANOV A Diagnostics for High-Dimensional Func- tions of Dependent Variables, J
G. Hooker, Generalized Functional ANOV A Diagnostics for High-Dimensional Func- tions of Dependent Variables, J. Comput. Graph. Stat. 16 (2007) 709–732. https://doi.org/10.1198/106186007X237892
2007 doi
-
[24]
MacKay, The Evidence Framework Applied to Classification Networks, Neural Comput
D.J.C. MacKay, The Evidence Framework Applied to Classification Networks, Neural Comput. 4 (1992) 720–736. https://doi.org/10.1162/neco.1992.4.5.720
1992 doi
-
[25]
Meier, S
L. Meier, S. Van De Geer, P. Bühlmann, The group lasso for logistic regression, J. R. Stat. Soc. Ser. B Stat. Methodol. (2008). https://doi.org/10.1111/j.1467- 9868.2007.00627.x
2008
-
[26]
Nabney, NETLAB : algorithms for pattern recognitions, Springer, 2002
I. Nabney, NETLAB : algorithms for pattern recognitions, Springer, 2002
2002
-
[27]
Friedman, Greedy function approximation: A gradient boosting machine, Ann
J.H. Friedman, Greedy function approximation: A gradient boosting machine, Ann. Stat. (2001)
2001
-
[28]
Vapnik, Statistical learning theory, 1998
V . Vapnik, Statistical learning theory, 1998. 17
1998
-
[29]
Breiman, Random Forests, Mach
L. Breiman, Random Forests, Mach. Learn. 45 (2001) 5–32. https://doi.org/10.1023/A:1010933404324
2001 doi
-
[30]
Dua, Dheeru and Graff, UCI Machine Learning Repository, (2013)
C. Dua, Dheeru and Graff, UCI Machine Learning Repository, (2013). http://ar- chive.ics.uci.edu/ml
2013
-
[31]
Ripley, Pattern Recognition and Neural Networks, Cambridge University Press, Cambridge, 1996
B.D. Ripley, Pattern Recognition and Neural Networks, Cambridge University Press, Cambridge, 1996. https://doi.org/10.1017/CBO9780511812651
1996 doi
-
[32]
UCI Machine Learning Repository; 2013
Lichman M. UCI Machine Learning Repository; 2013. Available from: http://ar- chive.ics.uci.edu/ml
2013
-
[33]
Sigillito, S.P
V .G. Sigillito, S.P. Wing, L. V . Hutton, K.B. Baker, Classification of radar returns from the ionosphere using neural networks, Johns Hopkins APL Tech. Dig. (Applied Phys. Lab. (1989)
1989
-
[34]
Wolberg, O.L
W.H. Wolberg, O.L. Mangasariant, Multisurface method of pattern separation for medical diagnosis applied to breast cytology (linear programniing/pattern recogni- tion/expert systems/cancer diagnosis), Proc. Natl. Acad. Sci. United States. 87 (1990) 9193–9196
1990
-
[35]
Fogel, E.C
D.B. Fogel, E.C. Wasson, E.M. Boughton, Evolving neural networks for detecting breast cancer, Cancer Lett. 96 (1995) 49–53. https://doi.org/10.1016/0304- 3835(95)03916-K
1995 doi
-
[36]
Abbass, An evolutionary artificial neural networks approach for breast cancer di- agnosis, Artif
H.A. Abbass, An evolutionary artificial neural networks approach for breast cancer di- agnosis, Artif. Intell. Med. 25 (2002) 265–281. https://doi.org/10.1016/S0933- 3657(02)00028-3
2002 doi
-
[37]
Street, W.H
W.N. Street, W.H. Wolberg, O.L. Mangasarian, Nuclear feature extraction for breast tumor diagnosis, in: R.S. Acharya, D.B. Goldgof (Eds.), Int. Symp. Electron. Imaging Sci. Technol., 1993: pp. 861–870. https://doi.org/10.1117/12.148698
1993 doi
-
[38]
Zhang, J
H. Zhang, J. Wang, Z. Sun, J.M. Zurada, N.R. Pal, Feature Selection for Neural Net- works Using Group Lasso Regularization, IEEE Trans. Knowl. Data Eng. (2020). https://doi.org/10.1109/TKDE.2019.2893266
2020
-
[39]
Liu, J.W
T. Liu, J.W. Xiao, Z. Huang, E. Kong, Y . Liang, BP Neural Network Feature Selection Based on Group Lasso Regularization, in: Proc. - 2019 Chinese Autom. Congr. CAC 2019, 2019. https://doi.org/10.1109/CAC48633.2019.8996679. 18 LIST OF FIGURES (a) (b) Fig. 1. Structure of (a) t...
2019
Reviewed August 14, 2026 · model on record in the stance chip above.
Discussion (0). Continue with ORCID to comment.